

Yesterday, the euro moved lower against the greenback, which resulted in an invalidation of the earlier breakout. Despite this deterioration EUR/USD rebounded slightly earlier today. Will we see verification or maybe invalidation of yesterday’s breakdown in the coming days?
In our opinion the following forex trading positions are justified - summary:
- EUR/USD: short (a stop-loss order at 1.2250; the initial downside target at 1.1466)
- GBP/USD: short (a stop-loss order at 1.3272; the initial downside target at 1.2375)
- USD/JPY: none
- USD/CAD: none
- USD/CHF: none
- AUD/USD: none
EUR/USD
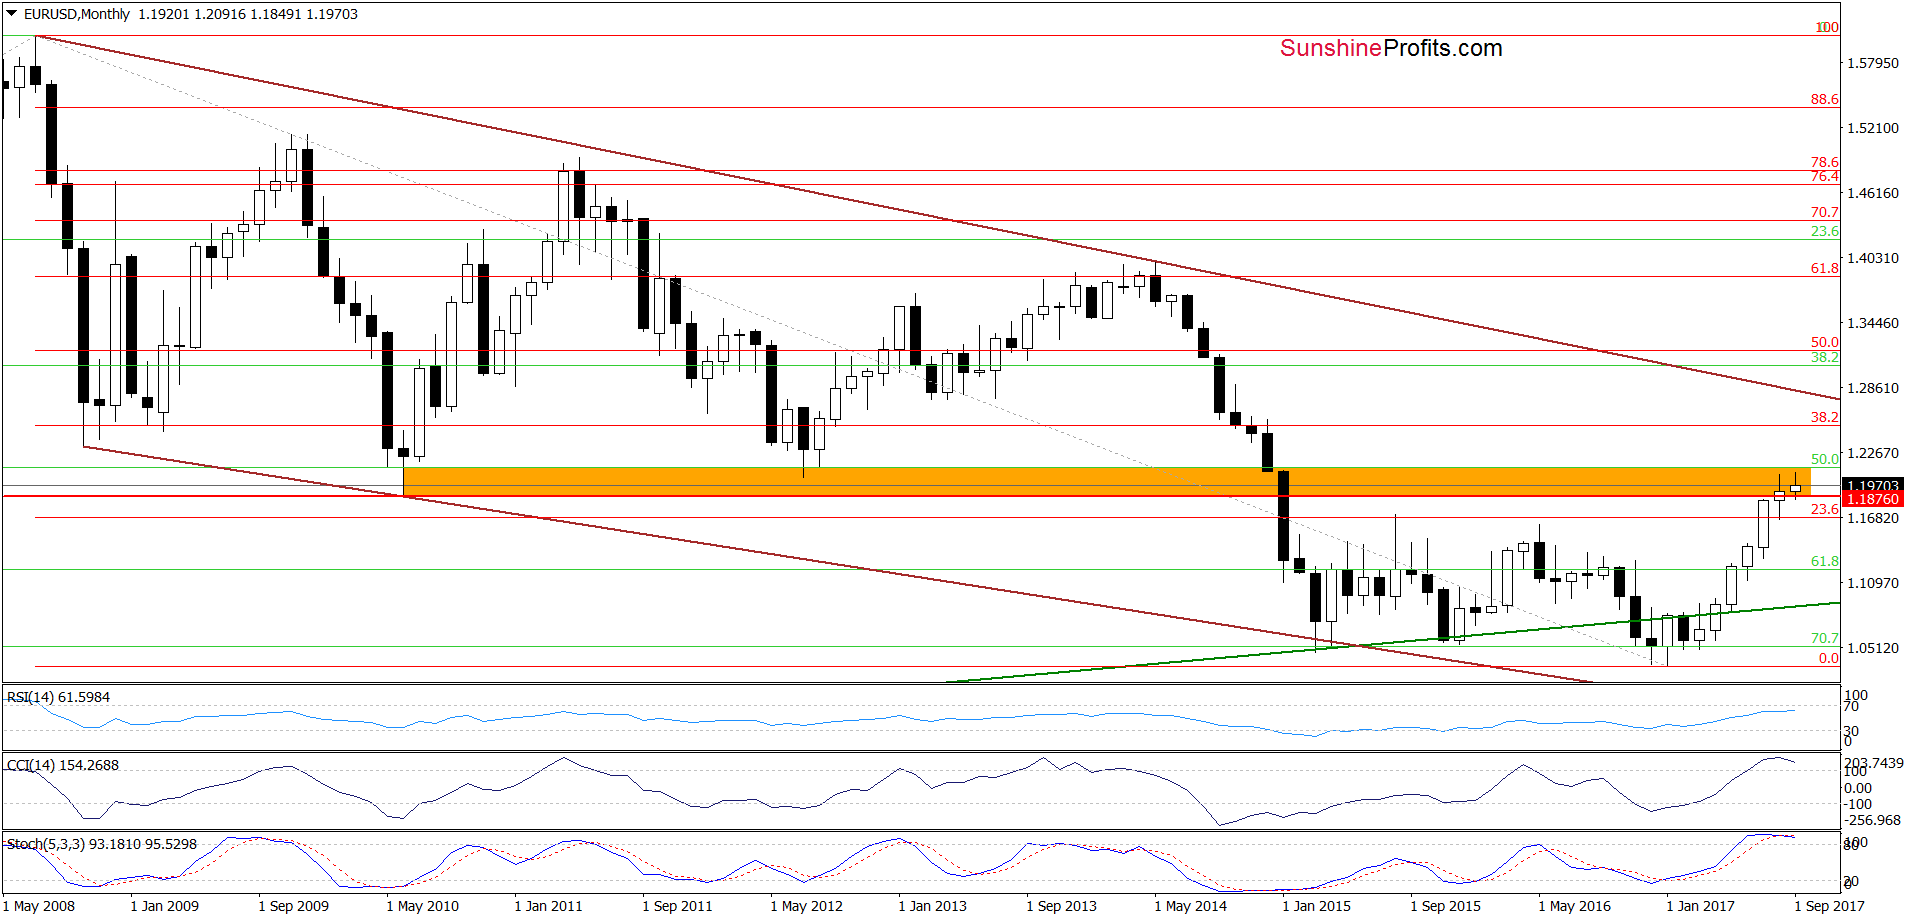
Looking at the long-term chart, we see that EUR/USD is still trading in the orange resistance zone. Additionally, indicators increased to the highest levels since April 2014. Back then, such high readings of the CCI and Stochastic Oscillator preceded bigger move to the downside, which suggests that we may see a similar price action in the coming week(s).
When we take a look at the medium-term chart below, we can see that the CCI and Stochastic Oscillator already generated the sell signals, supporting currency bears.
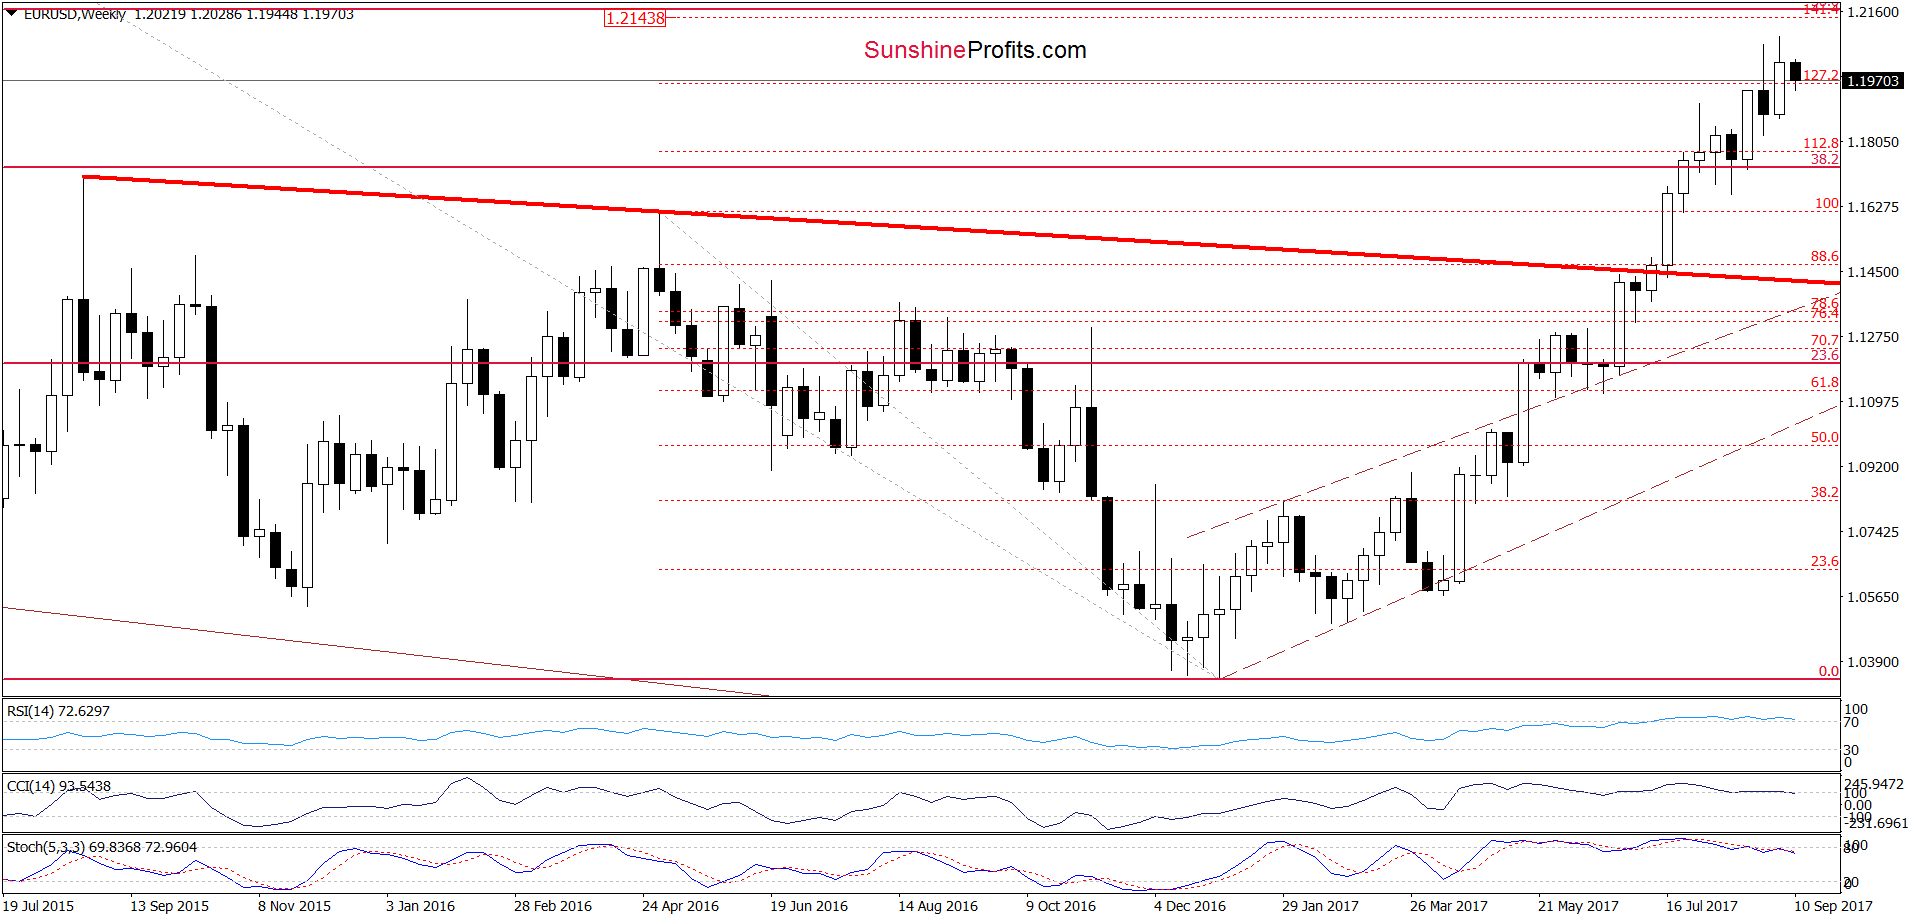
On the above chart, we also see that the exchange rate is quite close to invalidating the earlier breakout above the 127.2% Fibonacci extension. On top of that, yesterday, EUR/USD slipped below the upper border of the brown rising trend channel, invalidating the earlier breakout.
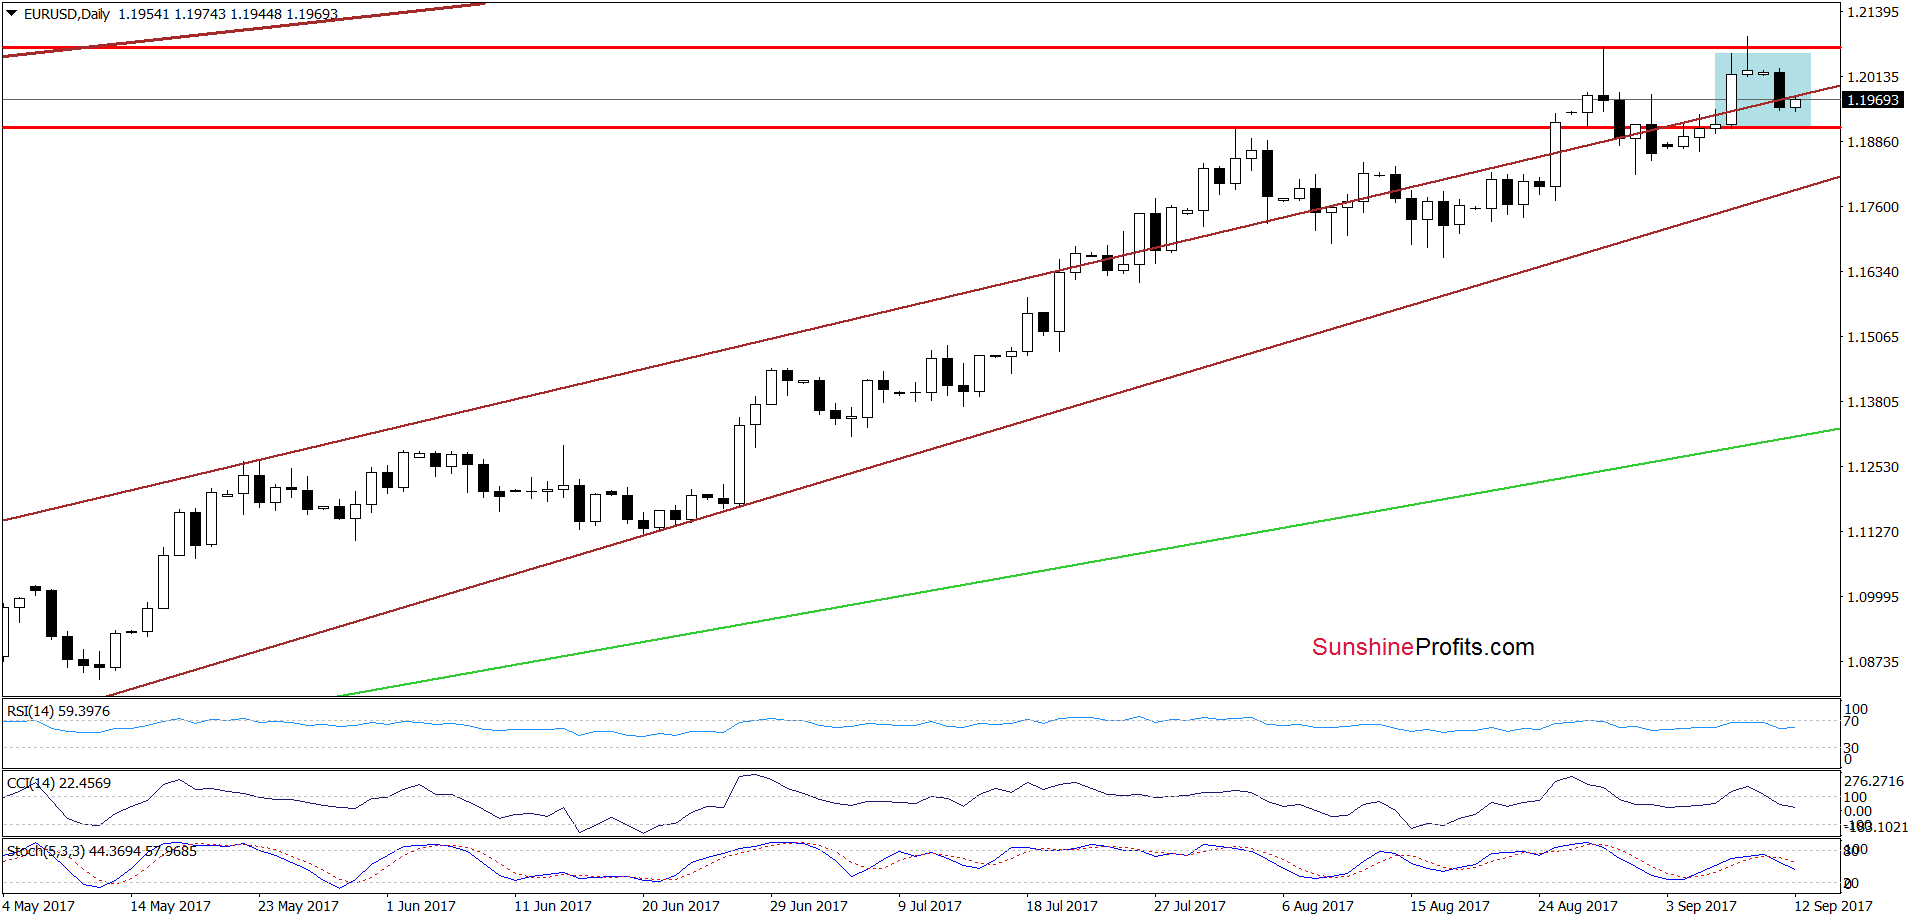
Earlier today, the pair rebounded slightly, but taking into account all the above-mentioned factors and the sell signals generated by the daily indicators, we think that it’s nothing more than a verification of yesterday’s breakdown. If this is the case, we’ll see reversal and further deterioration in the very near future. How low could the exchange rate go? In our opinion, the first downside target will be the lower border of the brown rising trend channel (currently around 1.1792).
Very short-term outlook: bearish
Short-term outlook: mixed with bearish bias
MT outlook: mixed
LT outlook: mixed
Trading position (short-term; our opinion): Short positions (with a stop-loss order at 1.2250 and the initial downside target at 1.1466) are justified from the risk/reward perspective. We will keep you informed should anything change, or should we see a confirmation/invalidation of the above.
USD/CAD
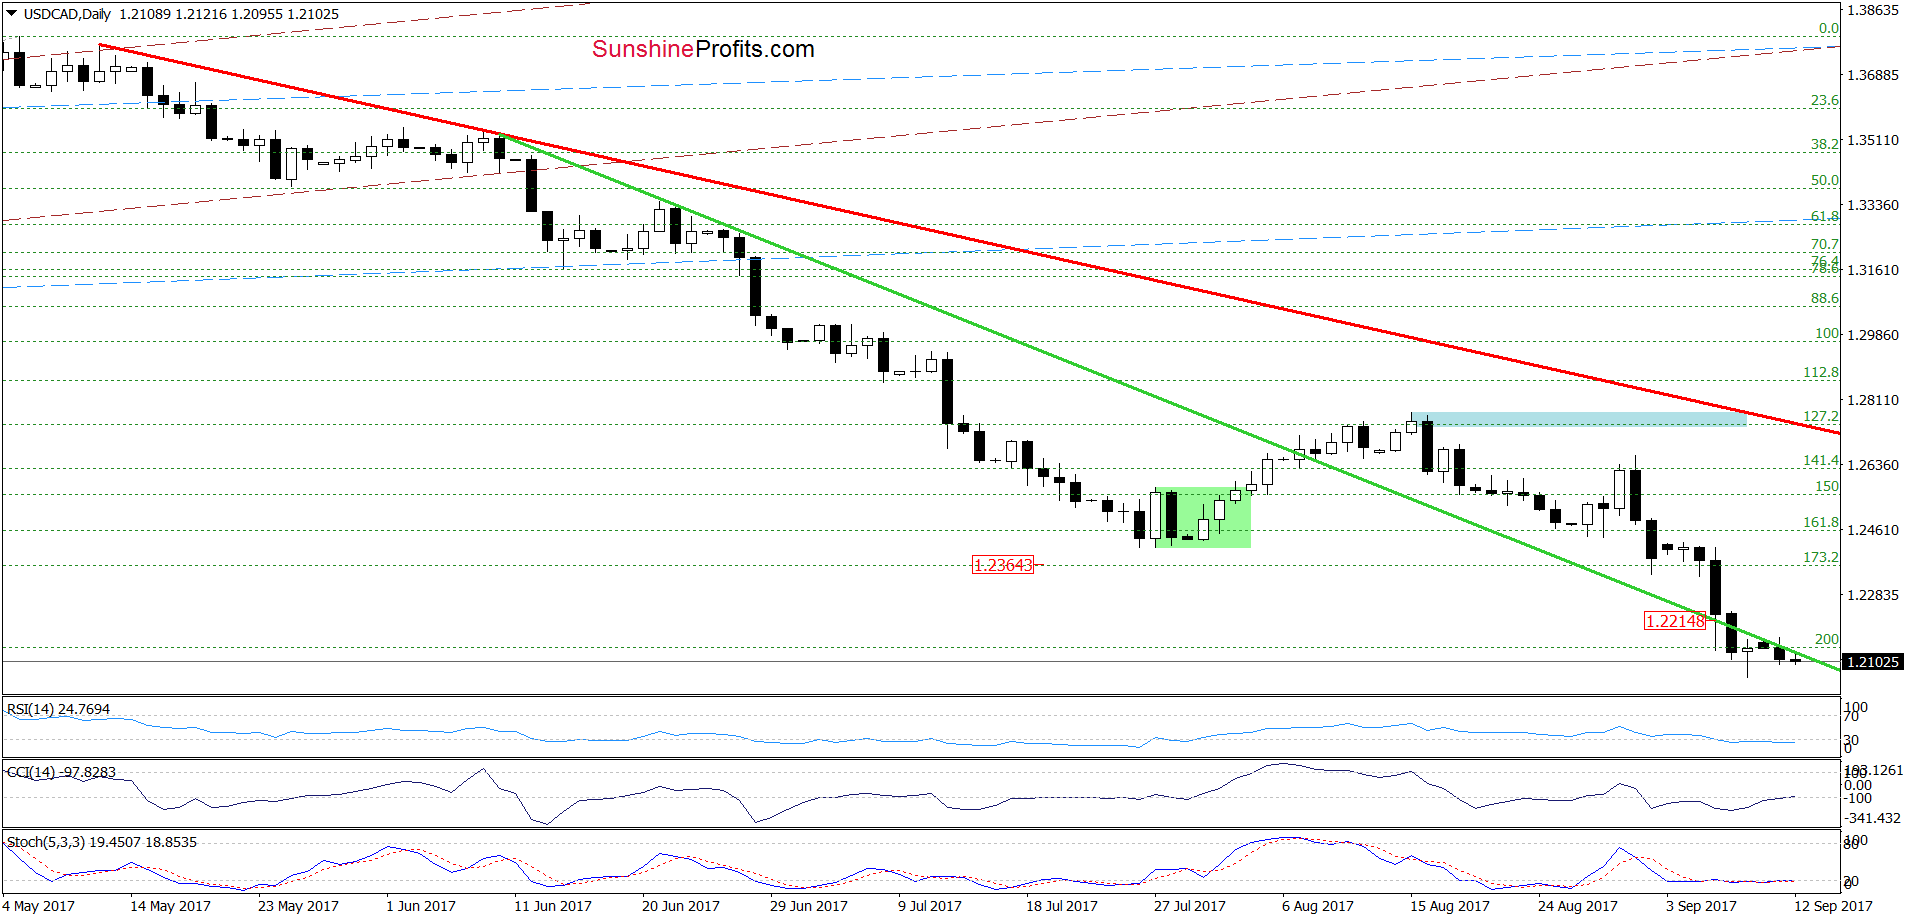
Looking at the daily chart, we see that USD/CAD extended losses and remains below the green support line and the 200% Fibonacci extension.
What’s next for the exchange rate? Let’s take a closer look at the weekly chart and try to find out.
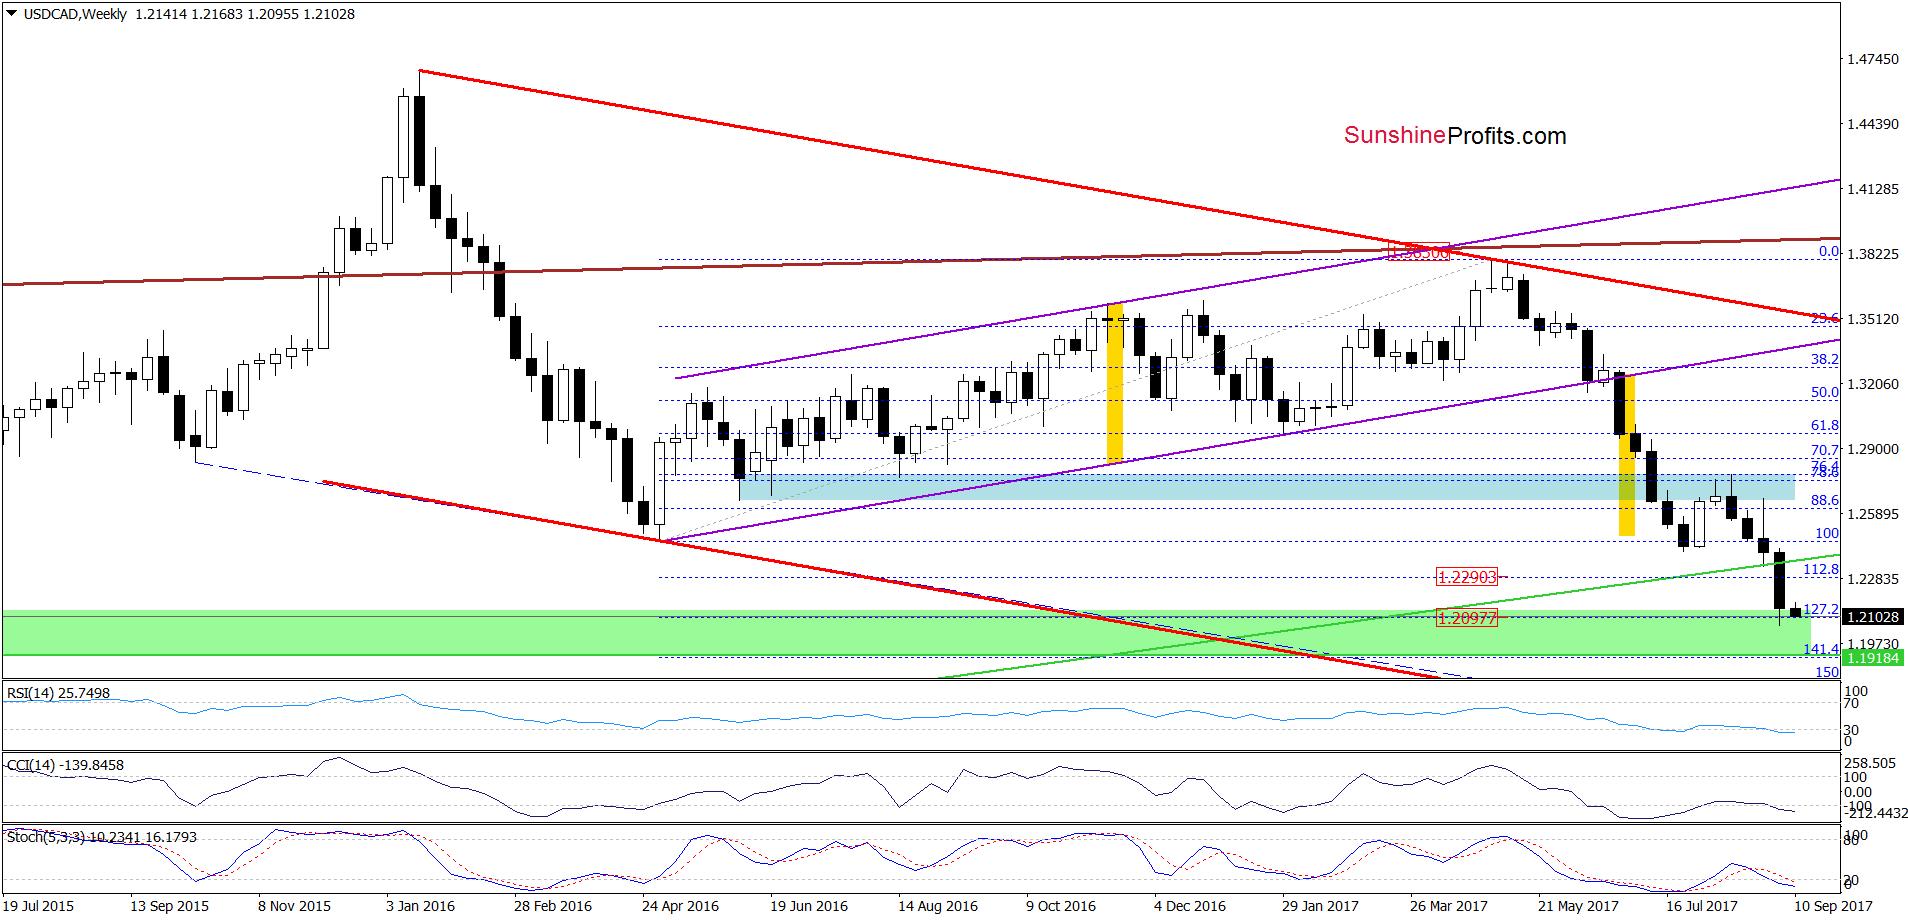
From this perspective, we see that although USD/CAD hit a fresh 2017 low in the previous week, the pair is still trading around the upper border of the green support zone (created by the 127.2% Fibonacci extension), which could stop currency bears in the coming week – especially when take into account the 50% Fibonacci retracement (based on the entire 2011-2016 upward move) marked on the long-term chart below.
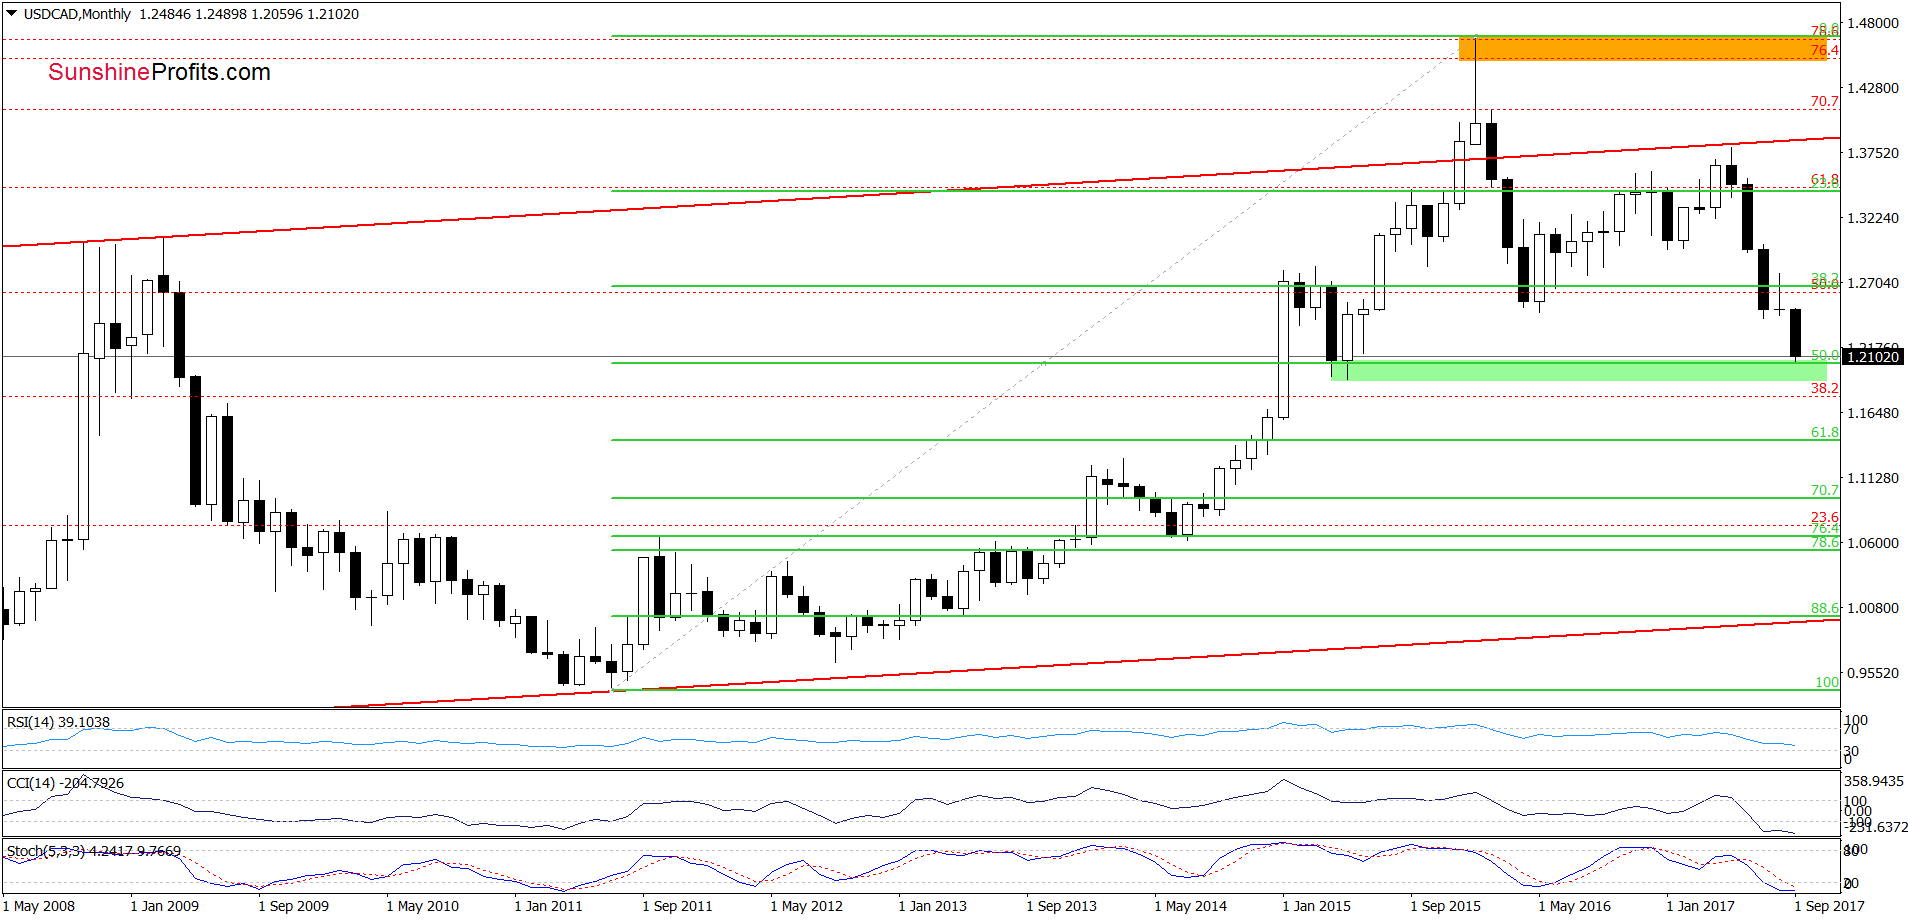
Nevertheless, even if the above-mentioned supports do not stop currency bears and the pair extends losses, the next downside target will be quite close – around 1.1918, where the lower line of the green zone (created by the 141.4% Fibonacci extension and the May 2015 lows) currently is.
Very short-term outlook: mixed
Short-term outlook: mixed with bullish bias
MT outlook: mixed
LT outlook: mixed
Trading position (short-term; our opinion): No positions are justified from the risk/reward perspective at the moment. We will keep you informed should anything change, or should we see a confirmation/invalidation of the above.
USD/CHF
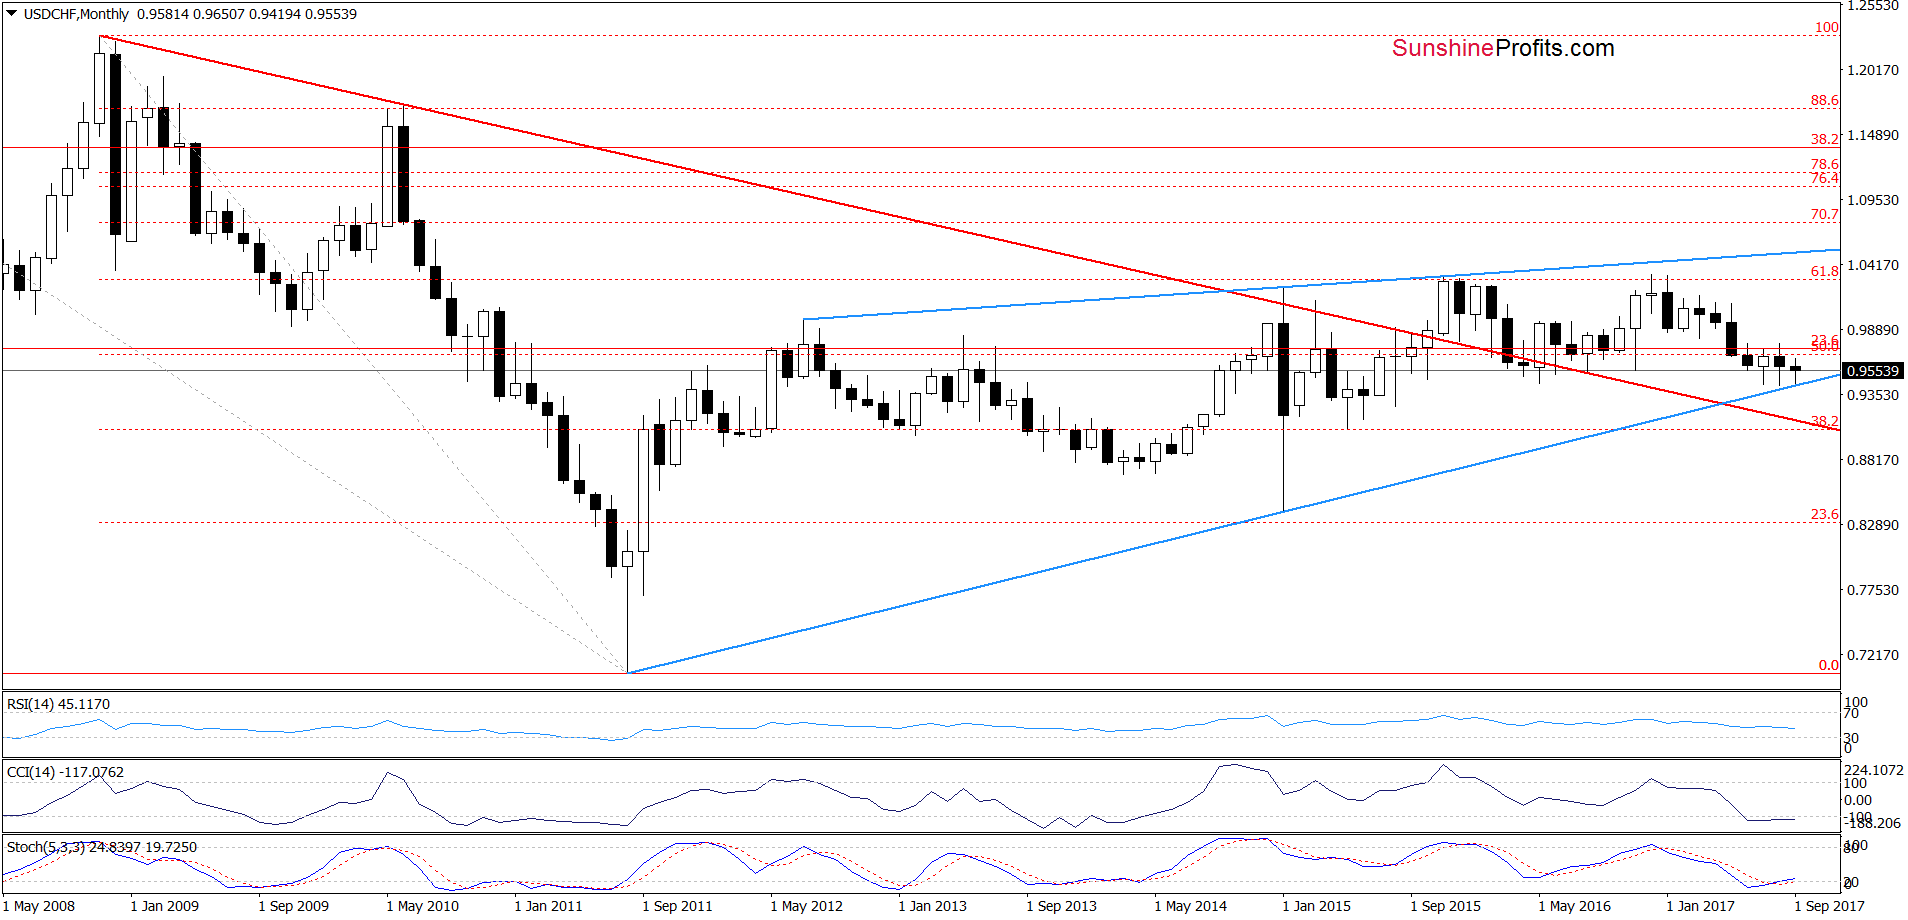
In our last commentary on this currency pair, we wrote the following:
(…) What’s next? Taking into account the fact that the above-mentioned levels [the lower border of the orange declining trend channel and the long-term blue rising support line] stopped currency bears two times in the previous weeks, it seems that history will repeat itself once again and we’ll see another reversal from current prices in the coming week.
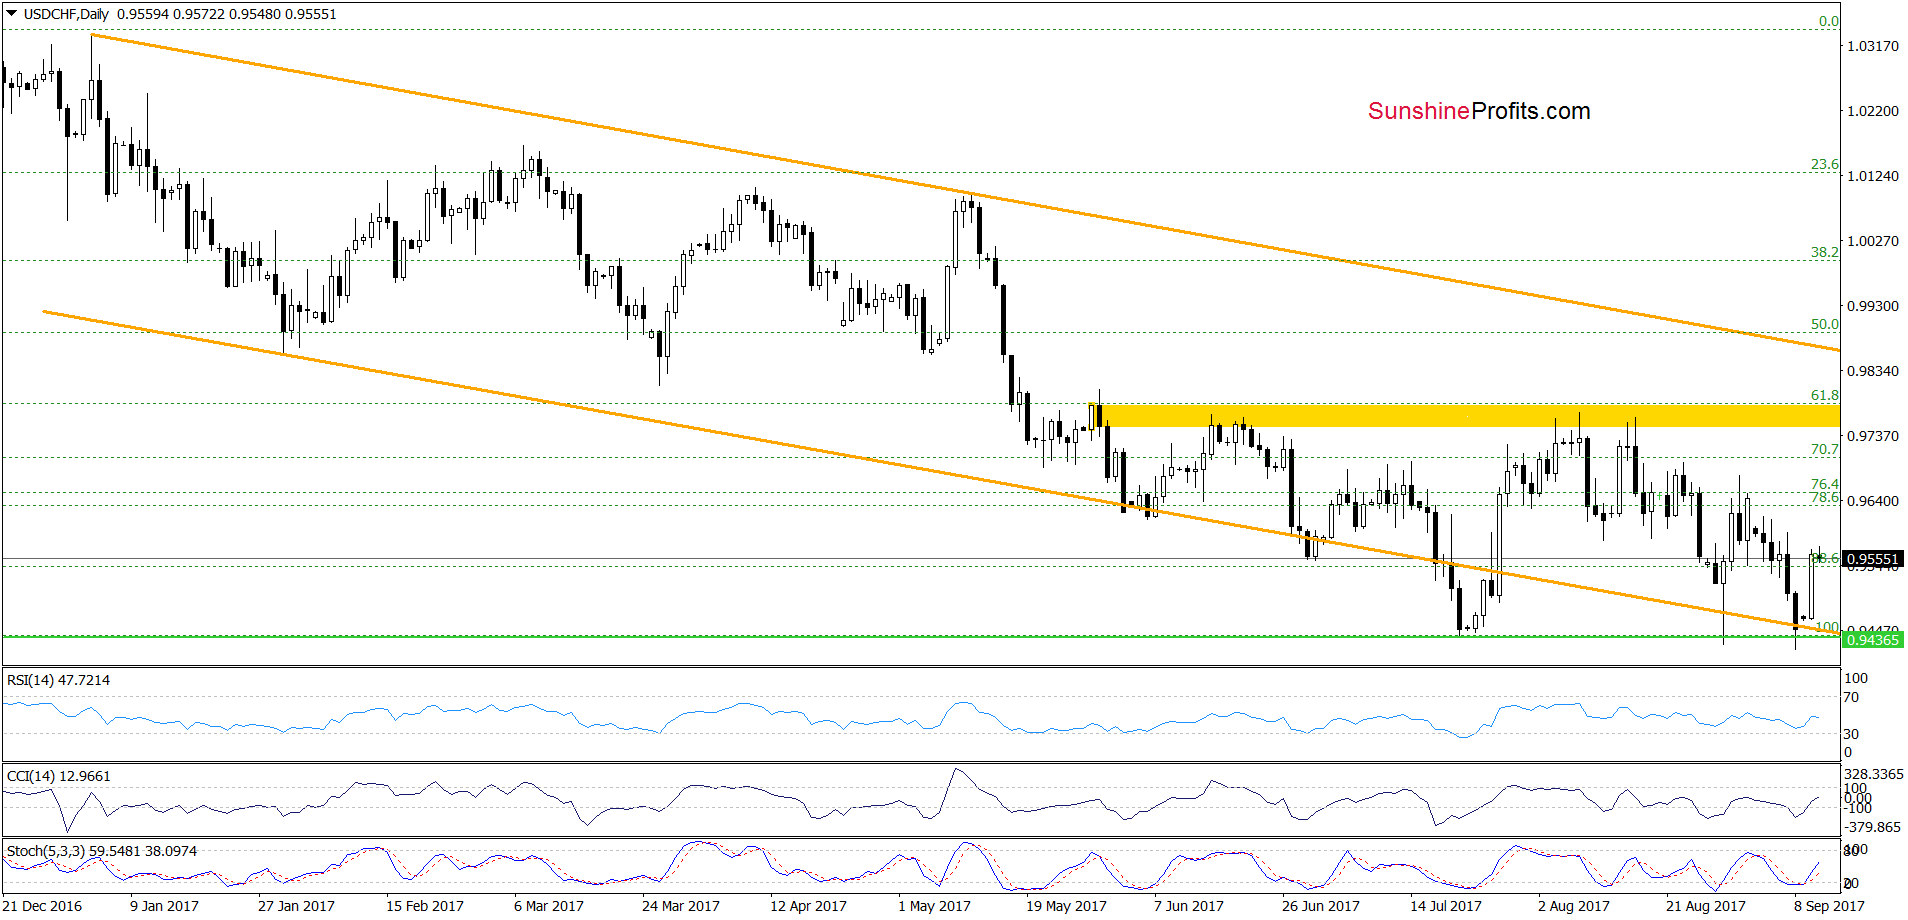
From today’s point of view, we see that the situation developed in line with the above scenario and USD/CHF bounced off the long-term blue rising support line seen on the monthly chart, invalidating the earlier small breakdown below the lower border of the orange declining trend channel. Taking this positive event into account and combining it with the buy signals generated by the daily (and even monthly) indicators, we think that further improvement is just around the corner. If this is the case and the pair increases from current levels, the initial upside target will be the yellow resistance zone seen on the daily chart (around 0.9751-0.9781).
Very short-term outlook: mixed with bullish bias
Short-term outlook: mixed with bullish bias
MT outlook: mixed
LT outlook: mixed
Trading position (short-term; our opinion): No positions are justified from the risk/reward perspective at the moment. We will keep you informed should anything change, or should we see a confirmation/invalidation of the above.
Thank you.
Nadia Simmons
Forex & Oil Trading Strategist
Przemyslaw Radomski, CFA
Founder, Editor-in-chief, Gold & Silver Fund Manager
Gold & Silver Trading Alerts
Forex Trading Alerts
Oil Investment Updates
Oil Trading Alerts

