

Sounds contradictory, but is perfectly true nonetheless. Just like you need to go faster than the car in front of you to be able to overtake it, the price sometimes has to rise faster than a steeply-sloping support level does so that it doesn't break down. Think about keeping your head above water when swimming. So, how has gold fared at this task yesterday? What kind of consequences will that bring in the very near future? Future that some might say is already knocking on the door...
While yesterday's Alert was brief, today's Alert is going to be longer, even though once again not much has happened. Gold is more or less where it's been trading 24 hours ago (at the moment of writing these words) - yes, it's below $1,400 once again.
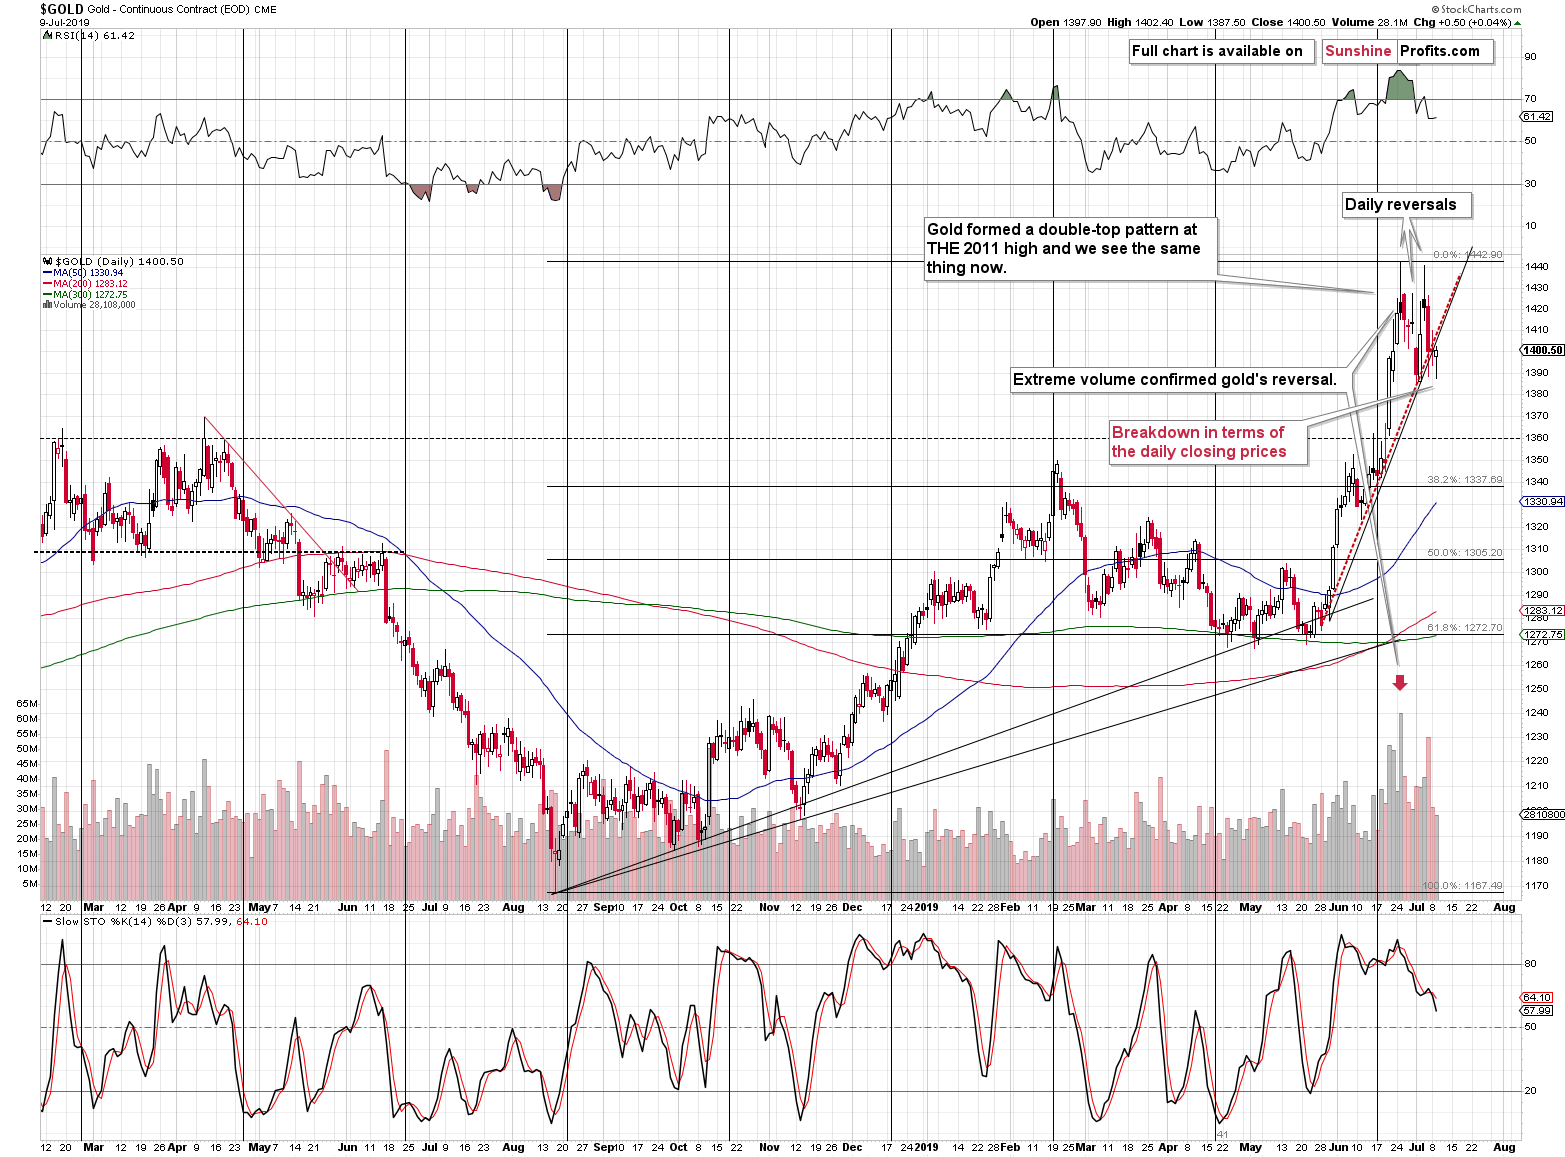
Even though gold closed half a dollar higher yesterday, this was actually a bearish technical development. That's because of rising support line that we mentioned yesterday. While it's not clear if gold closed below the support line based on the May low and the early June low if we based it on the intraday lows, it is clear that it closed below it when we consider the daily closing prices. We marked this closing-price-based line with red. Gold moved a little higher, but the line was rising faster than fifty cents per day, which resulted in a rather quiet - but still - breakdown.
What's likely to follow a breakdown? A decline. And what has gold been doing in the overnight trading?
It's been declining. Even though it appears insignificant, this move lower is the follow-up of a breakdown in terms of the daily closing prices, which makes it significant. Breakdowns are sometimes immediately followed by volatile declines and sometimes we see a consolidation or a pullback to the previously broken level first. Either of them could take place in gold, but there is a slight indication that volatility is about to increase to the downside...
Silver Is Pointing Its Finger
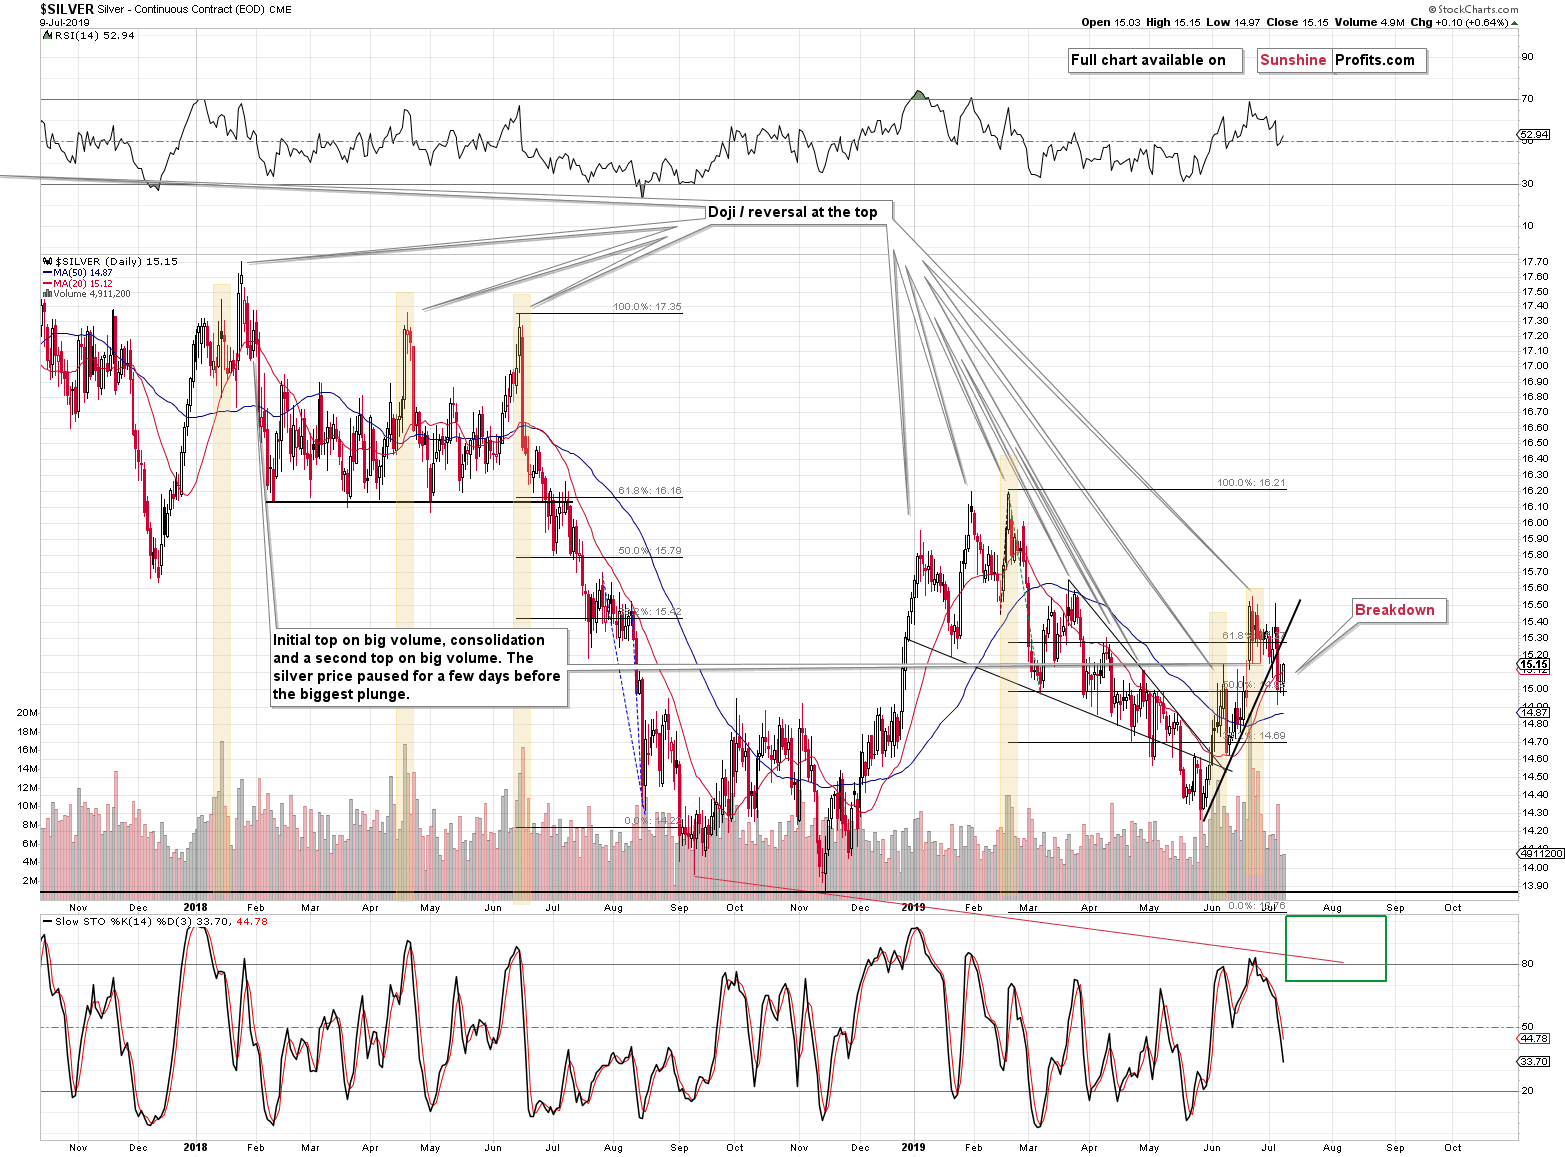
Silver just managed to close higher, more so than gold did and it's daily rally - although very small in absolute terms - was visibly bigger than the one that we saw in gold. This means that silver just outperformed on a very short-term basis. And if you've been following our analyses for at least some time, you know that this means that a price slide is likely just around the corner. Please take a look at the cases that we marked with yellow on the above chart - silver outperformed right at the top. Of course, in this case the price move is relatively small in general, which is one of the reasons that made us write about only a "slight indication" in the final sentence of the previous paragraph.
Another reason is that it was not only silver that moved more visibly than gold. The same thing happened in the mining stocks.
Making Sense of Miners' Strength
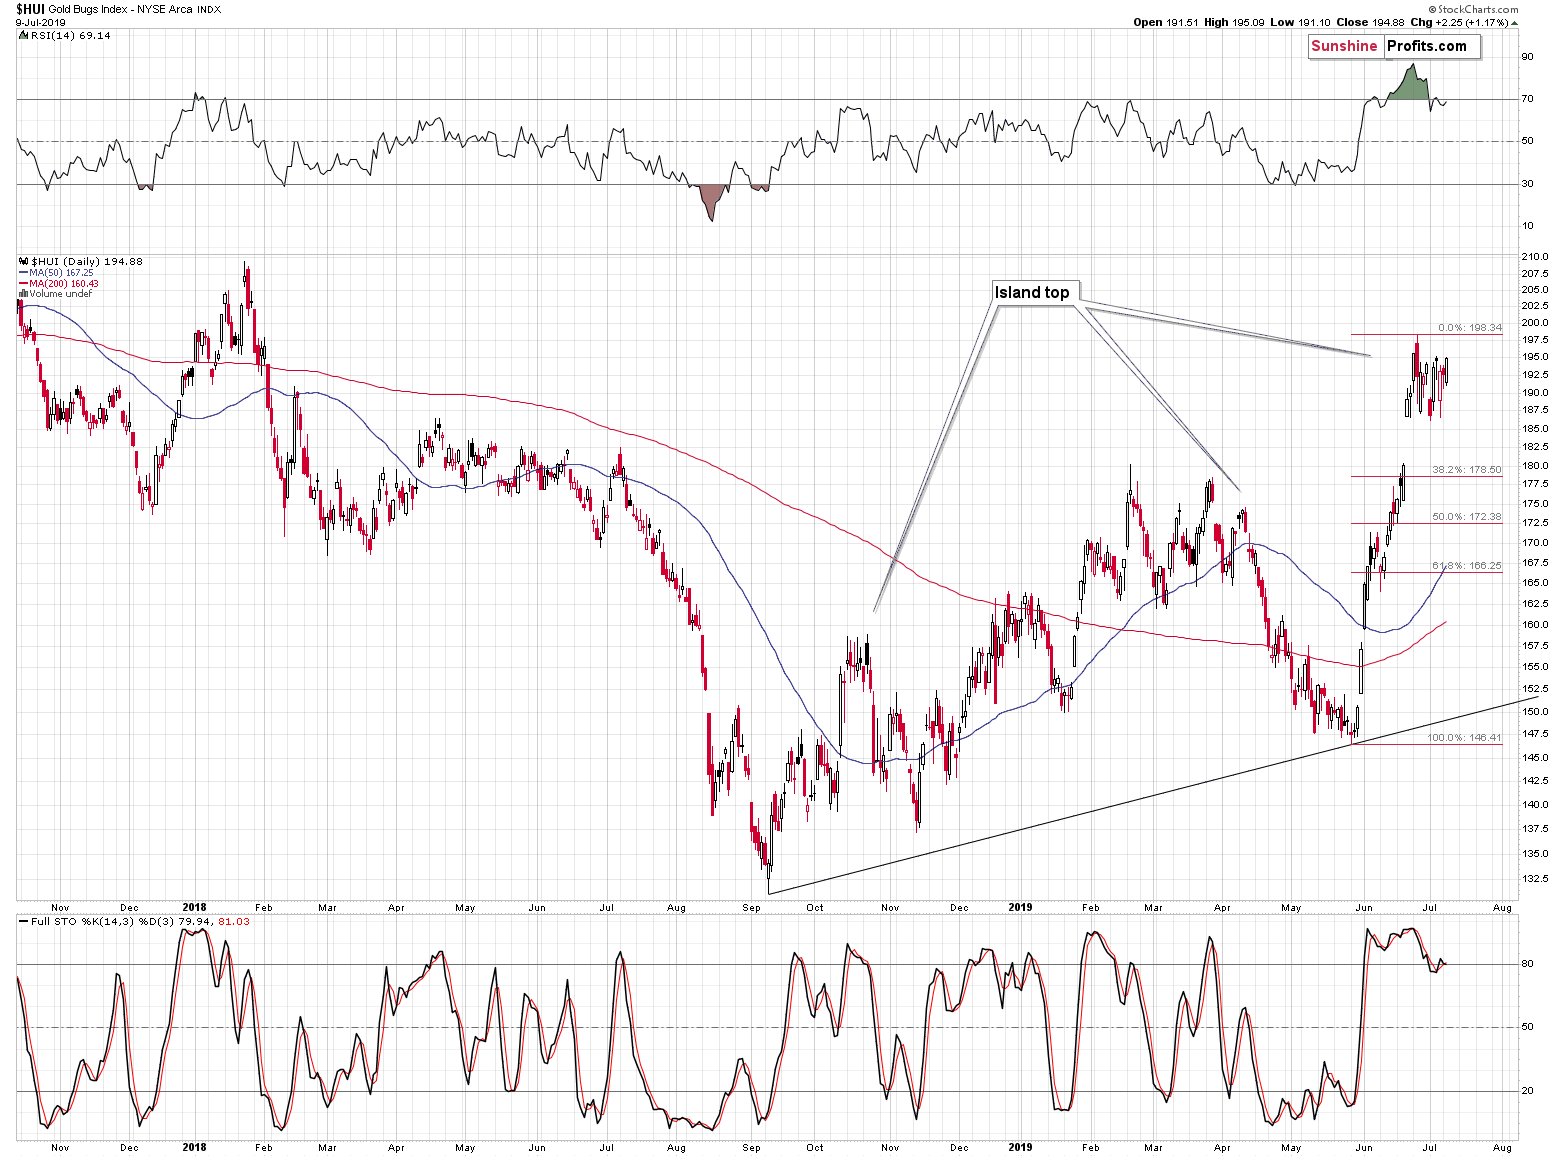
One interpretation is that the mining stocks are showing strength here. Second one is that this is the final part of the topping formation where we see fake strength (similarly to the fake weakness in miners that we saw right before the powerful 2016 rally). It's unclear which of these interpretations is the correct one at this time, so it's better not to focus on this factor until it becomes clearer. In the bullish case, the above could take the form of a breakout above the previous highs, confirming that breakout. This is unlikely. Please note that in October 2018, when miners also formed the island top, miners moved practically right to the previous high before sliding in a volatile manner. It's not uncommon for mining stocks to "act tough" until the end. But when they give up, they drop hard.
We received a question from one of our subscribers about the nature of the "ongoing strength in senior gold stocks". In particular, the question was if it was a matter of good news in individual miners, or something more fundamental.
In our view, it's neither. Gold mining stocks are moving higher as they virtually have to as the price of the product that they are selling is going up and moving above previous years' highs.
As much as we don't like to reply to a question with a question, this seems justified here. And our question is:
What strength?
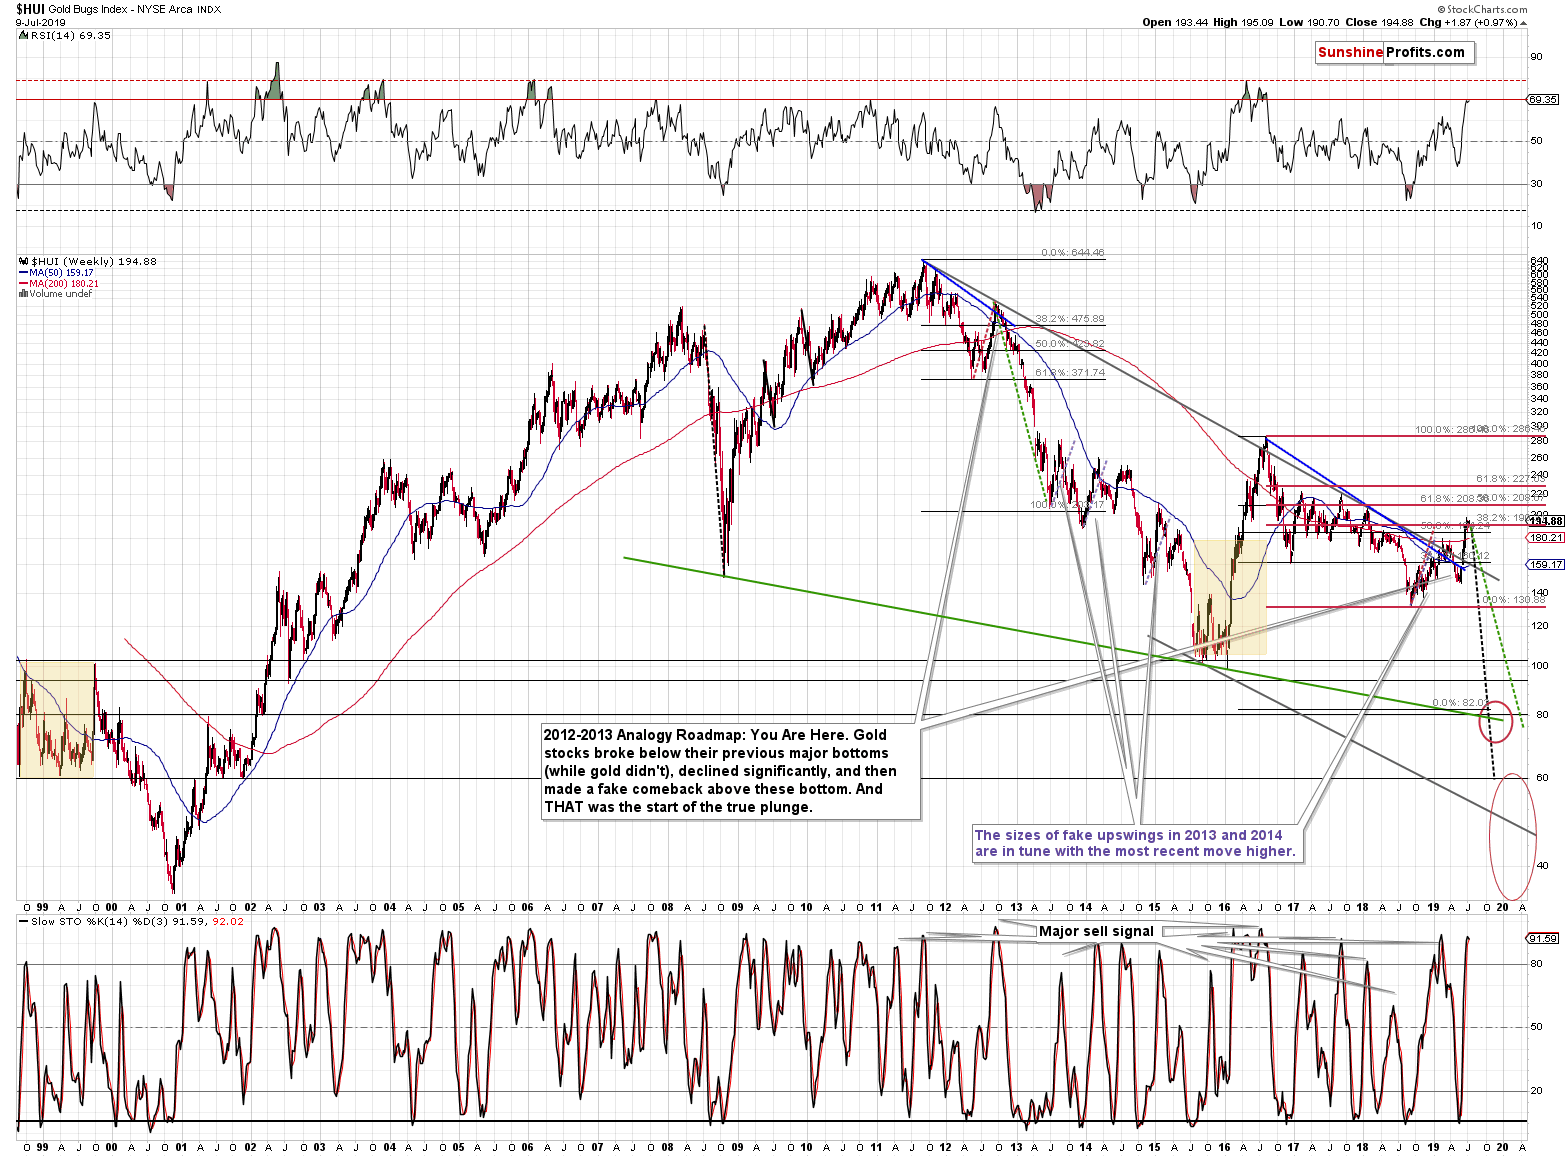
Even taken together, this and last years' rally in the gold miners is very small to compare to the 2016 upswing, let alone to the enormous 2011 - 2016 decline. It's just a relatively small correction within a much bigger downtrend. By being bearish here, we are not against the major trend - we are in tune with it.
Some may say that the HUI Index broke above the very long-term declining resistance line based on the 2011 and 2012 tops, which makes the outlook bullish. However, they forget that the same thing happened at the very top that we saw in 2016. And they forget that given where gold is right now (above its 2016 high) the size of the recent upswing in the miners is very weak.
The current move is much more similar to the 2014 or 2015 corrective upswings than it is to the 2016 rally or to the beginning of the 2000s bull market. And what followed the 2014 and 2015 corrections? Big slides during which miners didn't look back until they reached new lows.
The more fundamental thing about all this that was mentioned in the question is that the miners are suggesting that this is not the beginning of a new powerful upswing that would take gold much higher eventually. It strongly indicates that we will need to see a bigger price decline first.
Summary
Summing up, gold closed 50 cents above $1,400, but it was actually a bearish development as it means that gold just broke below its rising short-term support line based on the daily closing prices. Moreover, it did so after once again failing to break above the mid-2013 high, and shortly after silver broke below its own rising support line, which means that the overall outlook for the precious metals market deteriorated. The above happened after multiple long-term signs pointing to lower prices in the following months, i.a. the clear huge-volume-confirmed bearish shooting star candlestick in gold, huge volume topping signs from both: gold and silver, the triangle-vertex-based reversals, and epic volume from silver stocks. The next big move in the precious metals sector is most likely going to be down, not up.
Today's article is a small sample of what our subscribers enjoy regularly. To keep informed of both the market changes and our trading position changes exactly when they happen, we invite you to subscribe to our Gold & Silver Trading Alerts today.
Thank you.
Przemyslaw Radomski, CFA
Editor-in-chief, Gold & Silver Fund Manager
Sunshine Profits - Effective Investments through Diligence and Care
