
The first half of the year is behind us and, let’s be honest, it was horrible for the precious metals sector. The yellow metal dropped by 25% and it was its biggest decline since 1981. Last quarter was also gold’s worst quarter since 1968. One of the factors responsible for the decline was the strong performance of the stock market which hit record highs in May. But, the strongest declines have taken place since Ben Bernanke said last month the economy was recovering strongly enough for the central bank to begin tapering its $85 billion monthly bond purchases within the next few months.
After that we saw new 2013 lows in gold and silver. One of the most interesting things is that the U.S. dollar’s performance wasn't as strong a blow to crude oil. The “black gold” not only escaped the carnage but was also pushed to its highest levels since the June top. If you want to read something more about this surprising surge we invite you to read the oil commentary prepared by one of our contributors.
Turning back to the yellow metal once again… Gold is enjoying a corrective bounce now - at least that's how we currently view this rally. Today gold’s trading around $1,250. Should we be more optimistic? Let’s take a look at the charts and try to find some answers.
Let’s begin today’s technical part with the analysis of the long-term S&P 500 Index chart (charts courtesy by http://stockcharts.com):
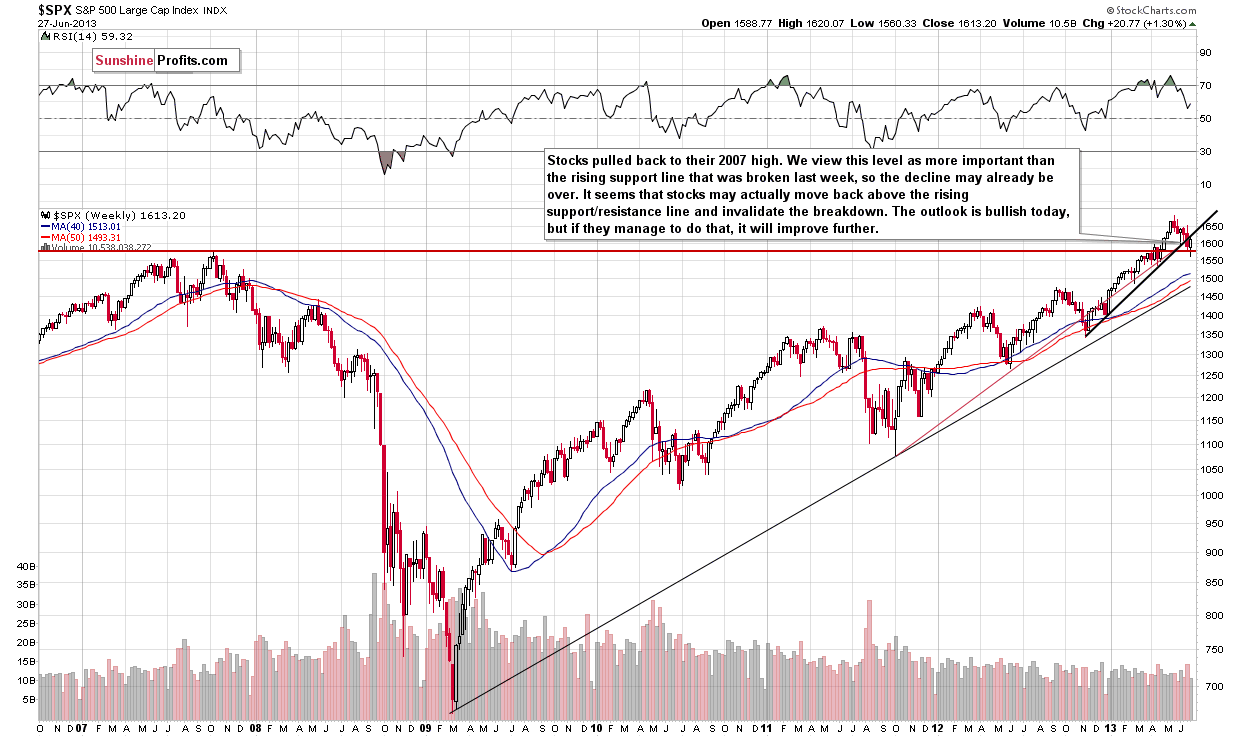
As you see on the above chart stocks broke the rising support line in June and declined below the 2007 high. Although stocks failed to hold above these two levels, we expected the recent decline was nothing more than another correction. Yes, it was deeper than the previous one but it doesn't change the overall picture of the market. The outlook here is pretty much unchanged, and the implications for gold continue to be bearish.
If you want to keep up with the current stock market situation we invite you to read the daily stock commentary prepared by one of our contributors.
Now let us have a look at two important ratios that show gold’s performance relative to other important groups of assets. The first one describes the ratio between gold and the Dow Jones Corporate Bond Index. Let’s find out if this ratio provides us with some valuable insight into the current situation in gold.
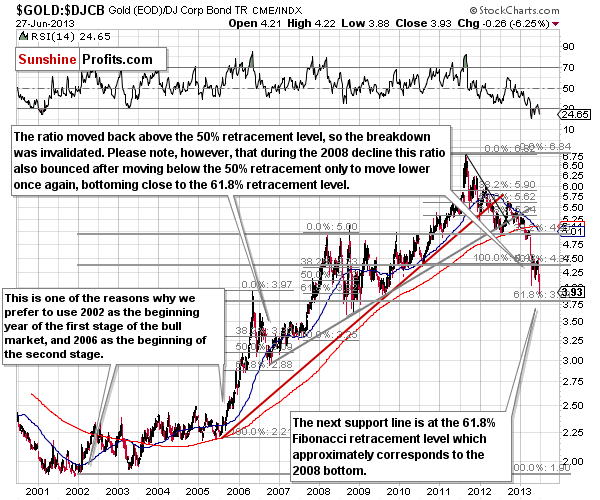
As we wrote in our essay on gold, stocks and the dollar on May 28, 2013:
The next support line is the 61.8% Fibonacci retracement level, at 3.79. (…) This is also equal to the level of the 2008 bottoms in terms of the closing prices.
The gold-to-bonds ratio moved to its 61.8% Fibonacci retracement level on Friday and the important support level was indeed reached. There is an interesting connection between current situation and 2008. In 2008 the declines in gold continued until this ratio was below or close to the final (61.8%) Fibonacci retracement level. In our opinion this is a bullish piece of information as this ratio is no longer signaling lower prices on the horizon - it's neutral for the short term and bullish for the long term.
The second important ratio that we’d like to discuss today is the Dow-to-gold ratio. Let’s have a look then.
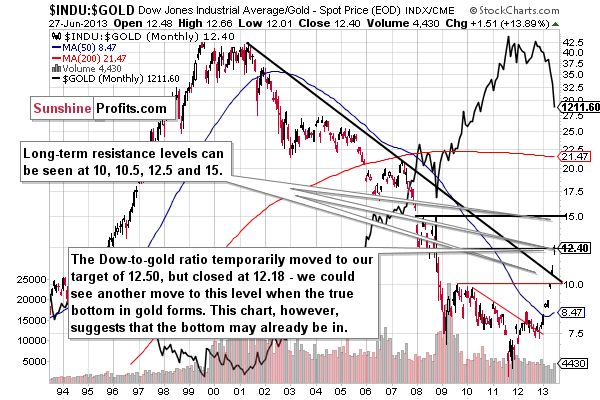
As you can see on this chart the ratio moved higher last week and it even reached one of the important resistance levels that we had featured previously. The bottom for gold may already be in based on the above chart. Still, please note that if stocks decline along with gold, then the latter can move lower without an increase in the ratio (without a breakout in it). Additionally, the above chart is a long-term one and if a small, short-term move lower in gold does indeed materialize, it may cause the ratio to move above the current resistance level temporarily and move back down in the following days – thus invalidating the breakout. Therefore, the above chart suggests that the bottom is likely quite close, not necessarily that it is surely already in.
After this interesting piece of data let's take a look at one of the most followed commodity stock indices - the Philadelphia Gold/Silver XAU Index. After all, it's been the case for years that mining stocks lead gold both higher and lower.
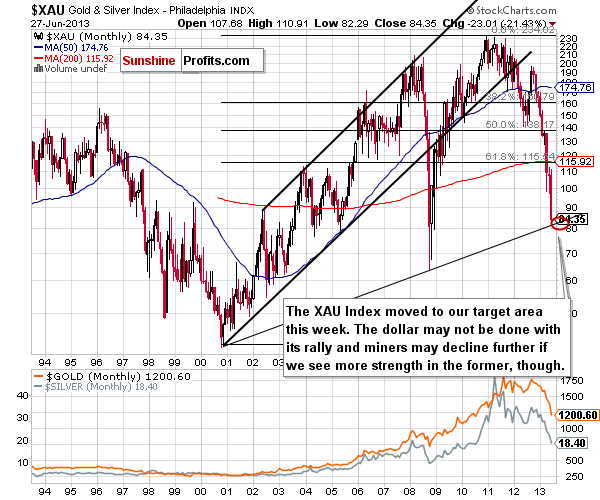
In our essay on gold, stocks and the dollar from June 26, 2013 you could read:
The XAU Index is above our initial target (84) for this decline. As you know this target level was created from the rising support line based on the late 2000 and 2008 lows. (…) This is the range that likely needs to be reached.
In this week’s XAU Index chart, we see that prices indeed moved below 84. Based on this chart, the bottom may be in. We could also see an initial downswing, which seems probable, but it’s just not that certain based on this chart alone.
Summing up, the medium-term outlook for the general stock market is still bullish and it seems that the bottom is not far away based on some charts (Dow-to-gold ratio, 61.8% Fibonacci retracement on the gold-to-bonds ratio chart and our target area in the XAU Index). Still, the short-term trend remains down and the impact that stocks and currencies have on gold confirms the bearish case. Consequently, even though the bottom seems to be close, the above-mentioned factors are not enough to convince us that it is already in.
Back