

Yesterday was just another period of back-and-forth movement for gold, silver, the USD Index and even the general stock market – but not for precious metals mining stocks. Gold stocks and silver stocks plunged very visibly - there are very important implications of this move and they are not bullish.
Let’s take a closer look at the charts (charts courtesy of http://stockcharts.com), starting with the GDX ETF (proxy for both gold and silver stocks).
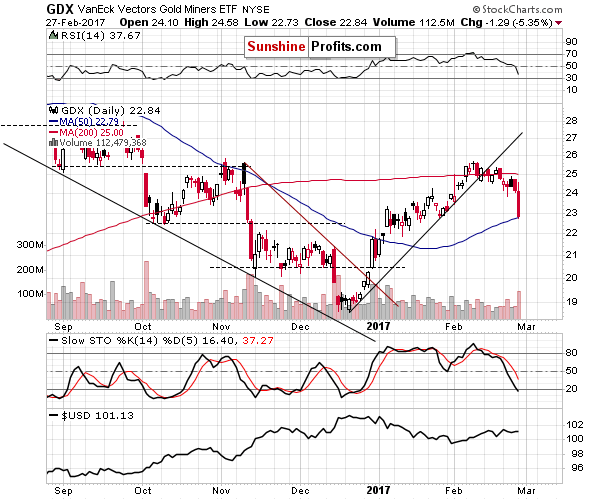
Precious metals mining stocks declined on huge volume and the fact that this happened without the metals’ lead is profound. Miners were a leading indicator in the recent past as well as in the previous years – including the time before THE plunge of 2013. We discussed that in greater detail in yesterday’s gold trading alert, while describing the situation in gold stocks (using the HUI Index as a proxy):
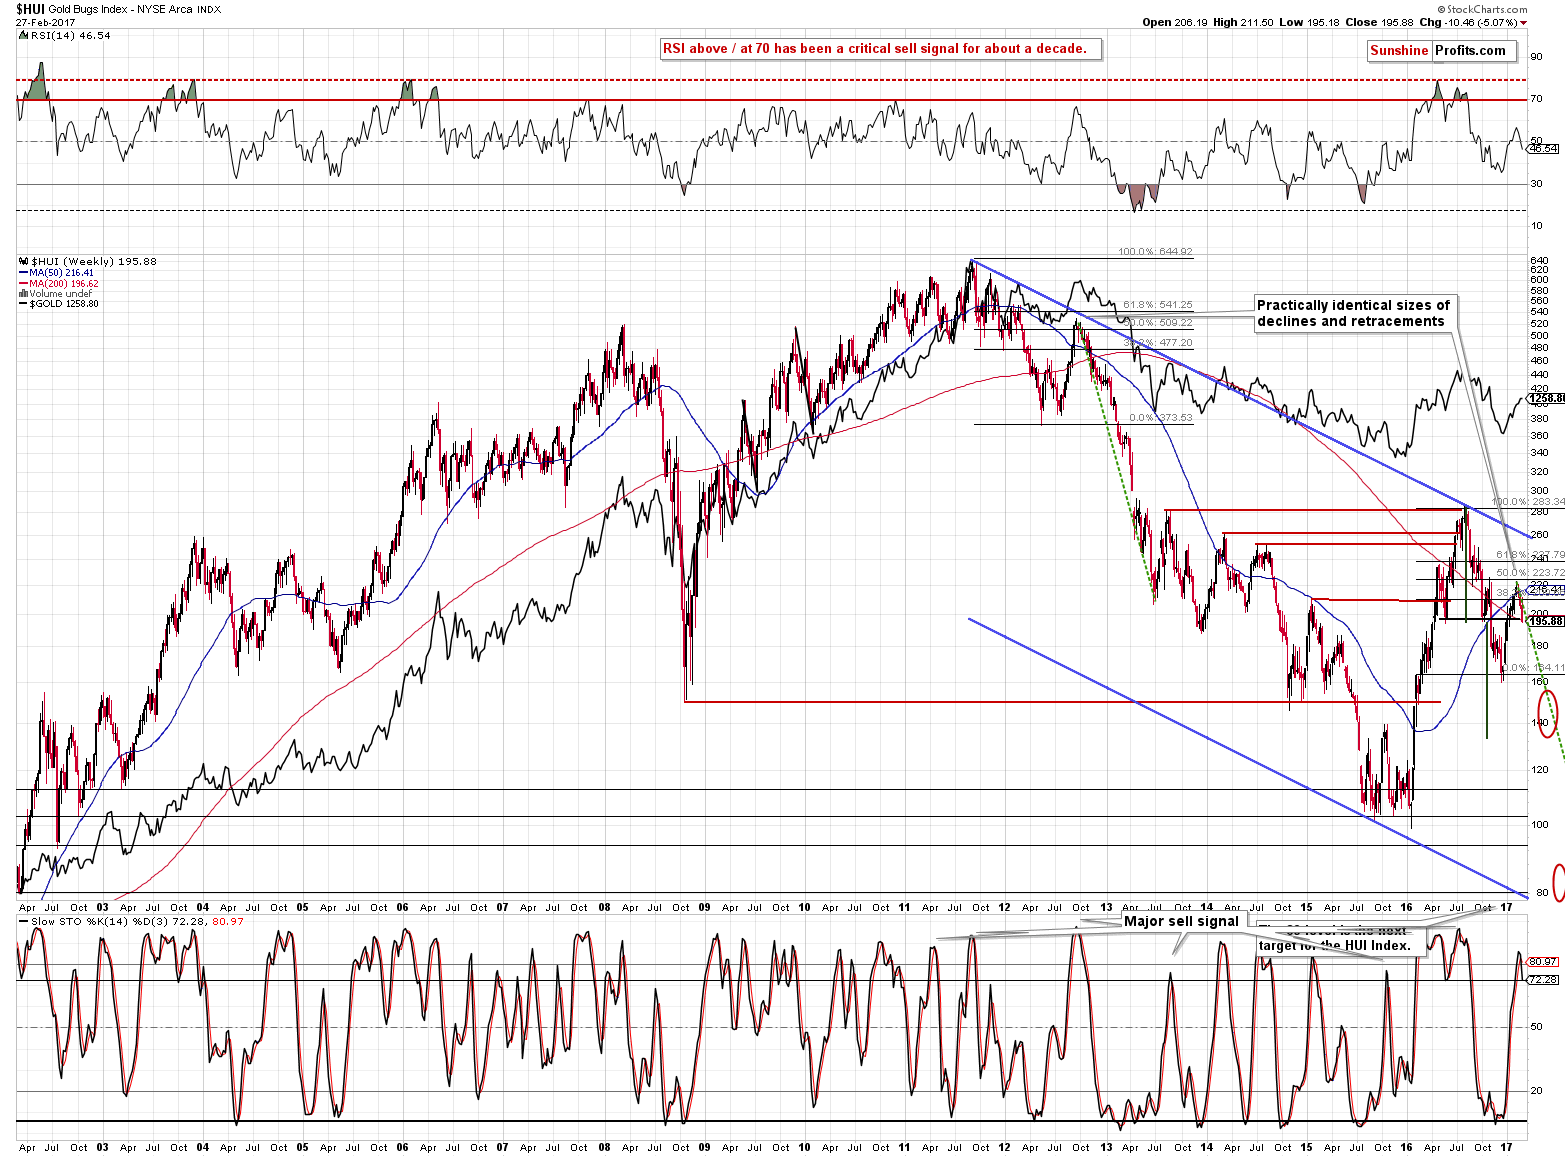
The HUI Index declined by 8 index points (almost 4%) [last week] despite having very strong reasons to move higher. Not only gold rallied, but we also saw higher prices of stocks in general (highest weekly close ever in case of S&P and DJIA) – miners should have rallied strongly and they weren’t just responding weakly – they declined, which is rather extreme. We saw something similar in 2012 and 2013, before the huge plunge in gold.
The above chart features something less visible but still very important. The size of the decline that followed the 2011 top and the size of the subsequent rebound (in the second half of 2012) is practically identical to the decline that we saw in the second half of 2016 and the current rebound. Back in 2012 gold stocks formed a local top after retracing about 50% of the previous decline and it appears that exactly the same thing happened also this time.
But the question remains if the top in metals was just formed or not. The upswing in gold and volume in GLD makes it quite likely.
Interestingly, while the HUI declined by almost 4% last week, it’s already down by more than 5% this week, even though gold is flat. The bearish implications described above clearly remain in place.
We already featured the GDX ETF chart that includes silver stocks, but let’s take a look specifically at them, to make sure that they confirm the observations made while analyzing gold stocks.
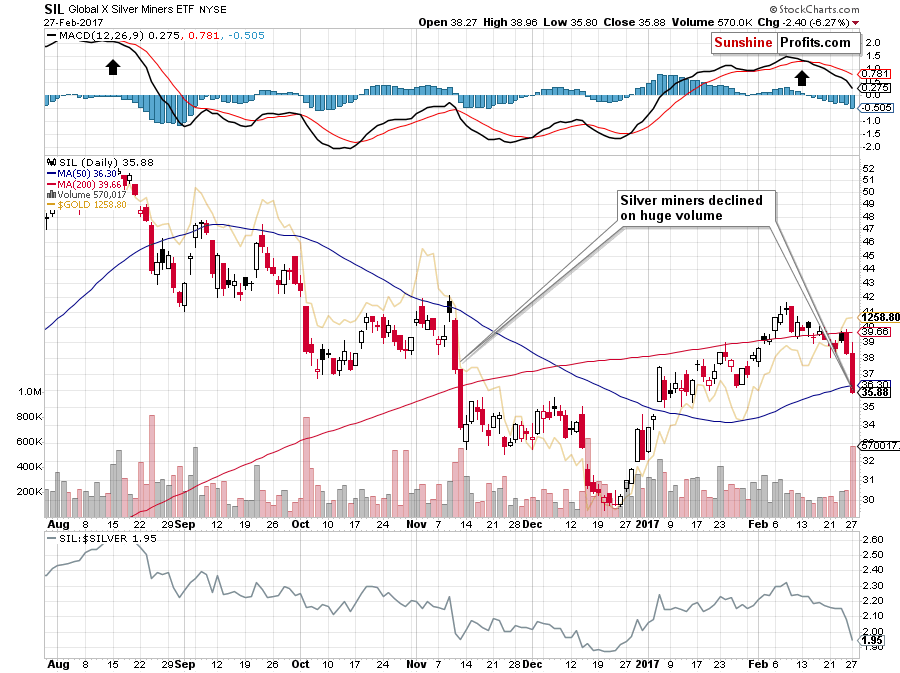
During yesterday’s session alone silver stocks declined about as much as they did from the February top to Friday – the size of the decline just doubled. The volume was huge. Both factors (size and volume) serve as good confirmations of the bearish signals that we discussed earlier.
Summing up, the bearish outlook for the precious metals sector remains in place. While the daily price changes are not particularly meaningful (except the miners’ underperformance – its implications are meaningful and bearish), the long- and medium-term signals that are very important (being highly effective in the past) continue to paint a very bearish picture for the precious metals sector for the upcoming weeks and months. It seems that the following weeks will be more than exciting and we encourage you to stay up-to-date with developments in gold and silver. Good way to proceed is to subscribe to our daily Gold & Silver Trading Alerts (there's 30-day money back guarantee if you're not happy with the service) - given the huge underperformance of mining stocks and the similarity to the situation before THE 2013 plunge, we encourage you to subscribe today.
Thank you.
Sincerely,
Przemyslaw Radomski, CFA
Founder, Editor-in-chief, Gold & Silver Fund Manager
Gold & Silver Trading Alerts
Forex Trading Alerts
Oil Investment Updates
Oil Trading Alerts
