

Earth has been such a fascinating place in the first half of the current year. Much better than Mars or others planets! You can trust us, we traveled a lot. Only on our globe, we had trade wars. Powell became Fed Chair. There was a sell-off in the stock markets. Populists won elections in Italy. Trump met with Kim Jong-un. The U.S. bond yields surged. Inflation reached 2-percent target. The Fed hiked the federal funds rate twice. The ECB started its tightening cycle. Uff, I hope I did not forget about anything! How did gold perform in that interesting period?
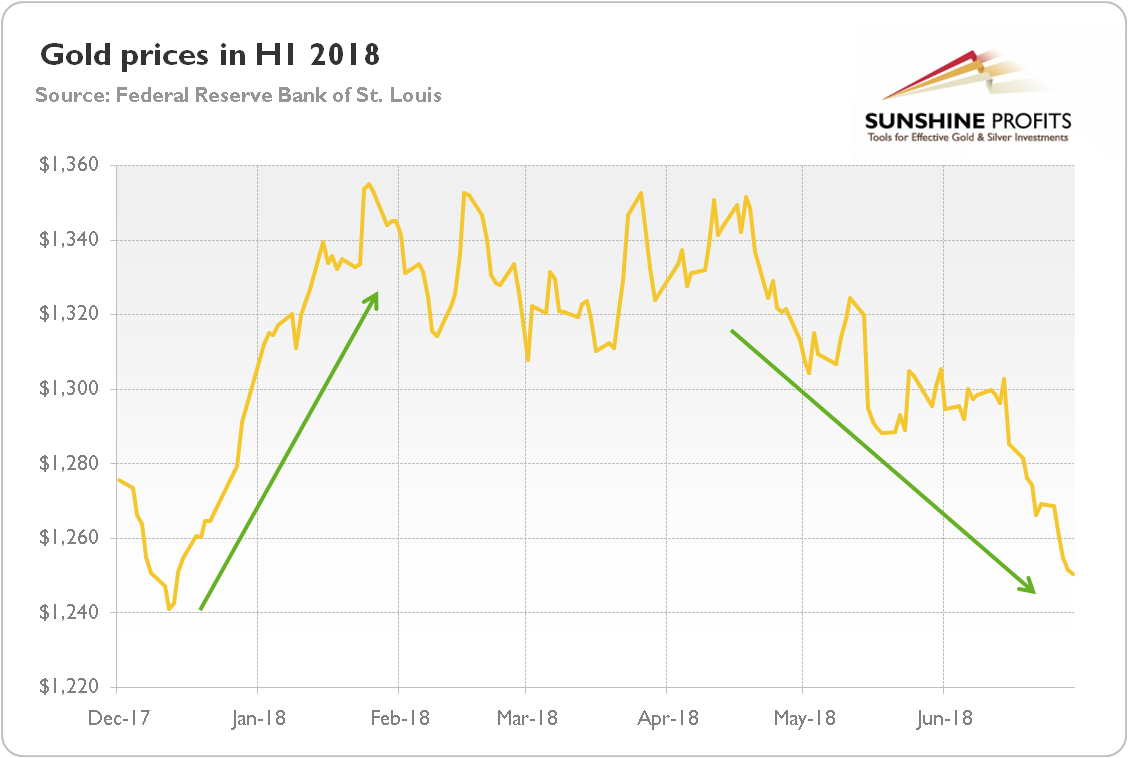
As one can see in the chart below, the history of gold prices in H1 2018 was quite turbulent. In January, in line with the pattern of recent years, it rallied like crazy, soaring in the aftermath of the December FOMC meeting from $1,241 to $1,355. From February until mid-April, the yellow metal remained in a sideways trend, staying in a trading range of about $1,300-1,350. Then, gold entered a bear market, plunging from $1,351 to $1,250 at the end of June. Overall, the price of the yellow metal dropped about 3 percent in H1 2018, with losses concentrated in the second quarter of the year. It looks like previous years, when gold also soared at the beginning of the year, only to run out of steam a few months later.
Chart 1: The price of gold in U.S. dollars in H1 2018 (London P.M. Fix).
What were the main drivers of gold prices in H1 2018? Well, our long-term Readers will not be surprised, but they should look at the U.S. dollar and the real interest rates. As the chart below shows, the real yields rallied in January, but gold managed to soar thanks to a plunging greenback. Then, both: rates and the U.S. dollar stabilized for a few months, keeping the gold prices in a narrow trading range. But when the greenback started to appreciate abruptly in mid-April, gold had no way out and fell like a stone, despite even the real interest rates peaking in mid-May.
Chart 2: The U.S. real interest rates (red line, right axis, yields on 10-year Treasury Inflation-Indexed Security) and the U.S. dollar index (green line, left axis, Trade Weighted Broad U.S. Dollar Index) in H1 2018.
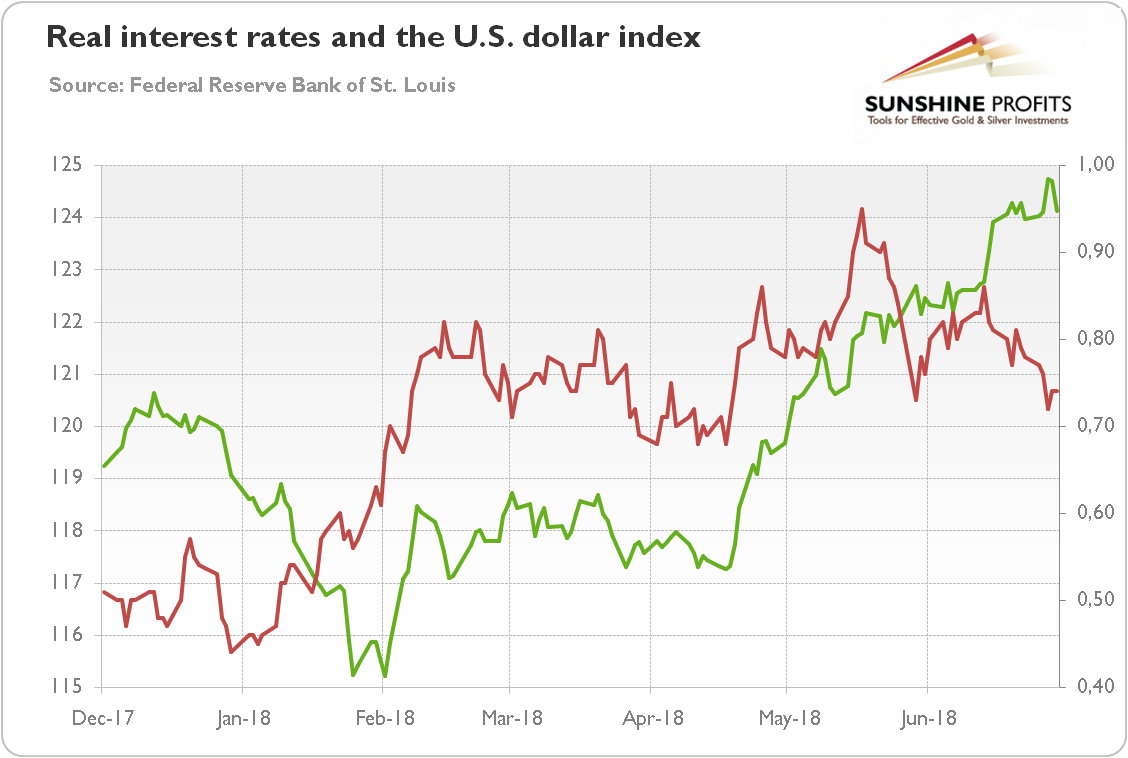
The recent developments show that the U.S. dollar has been somewhat a stronger driver of the gold prices. But what is perhaps the most striking is that the real interest rates declined amid the Fed’s tightening cycle. It implies that either investors expected even more hawkish central bank or they bought the rumor and sold the fact.
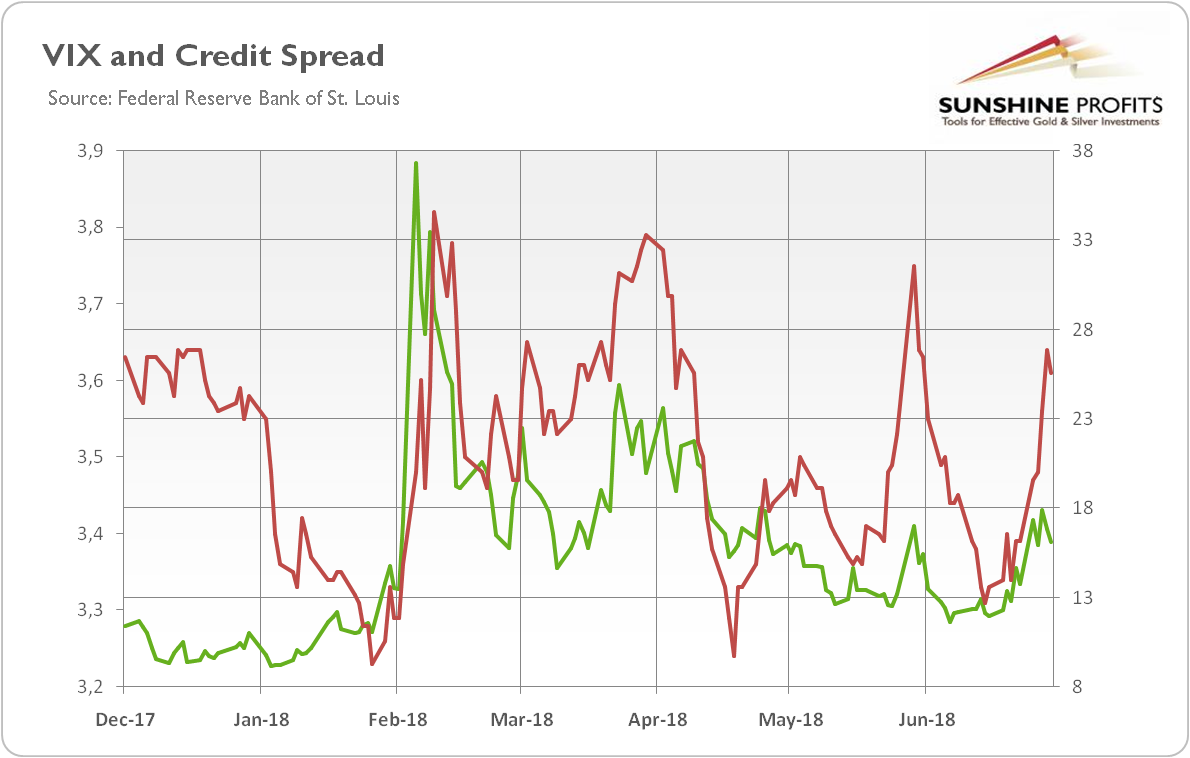
Moreover, the risk premium, measured both by the VIX and credit spreads, also has declined since mid-April, as the chart below shows. It did not help the gold prices. However, both indicators have risen somewhat in June.
Chart 3: The market volatility reflected by the CBOE Volatility Index (green line, right axis) and the credit spread reflected by the BofA Merrill Lynch US High Yield-Option Adjusted Spread (red line, left axis) in H1 2018.
OK, we know what happened – but what’s next for the yellow metal? As always, it’s not an easy question, but our stance is rather bearish, as the U.S. economy expands nicely, while the labor market tightens further. Moreover, there are no signs of recession on the horizon. Actually, the GDP should increase at a solid rate in the second half of this year. The accommodative fiscal policy should also support the economy in the near future. The tensions about the Korean Peninsula eased. Against this background, the Fed should continue to normalize its monetary policy, hiking interest rates two more times this year. In such a macroeconomic environment, the U.S. dollar could appreciate further, exerting downward pressure on the gold prices.
On the other hand, the escalation of trade wars could help the yellow metal. That is if we indeed see a trade war, because, the US-rest of world friction has been mostly a theater so far. Did Trump pull the US out of NATO, the WTO, or NAFTA? No – and he even approved the IMF's aid to Argentina. As we repeatedly say, investors should not follow the press, which always exaggerates. The truth is that liberal multilateral order is more resilient than many pundits believe.
Another source of hope is the fact that gold often bottoms in July and rallies for a while. Now, after the July/August Fed hike gold may catch its breath, especially if the ECB tightens its monetary stance more decisively. It should hit the dollar and support the euro and gold. We mean here the case when the ECB tightens more than expected, as the information about tightening is already included in the price and may not impact the price moves in the future.
If you enjoyed the above analysis and would you like to know more about the fundamentals of the gold market, we invite you to read the August Market Overview report. If you’re interested in the detailed price analysis and price projections with targets, we invite you to sign up for our Gold & Silver Trading Alerts. If you’re not ready to subscribe yet and are not on our gold mailing list yet, we urge you to sign up. It’s free and if you don’t like it, you can easily unsubscribe. Sign up today!!
Thank you.
Arkadiusz Sieron, Ph.D.
Sunshine Profits‘ Gold News Monitor and Market Overview Editor
Gold News Monitor
Gold Trading Alerts
Gold Market Overview
