Gold, silver and mining stocks declined in a quite visible way yesterday, which is in tune with our previous expectations. In the previous days it was only silver and miners that declined in a meaningful manner, but yesterday gold joined them, making this a sector-wide decline. Is this the groundbreaking decline that we have been writing about for so long? Time will tell, but the earth is already shaking.
Precious Metals’ Decline
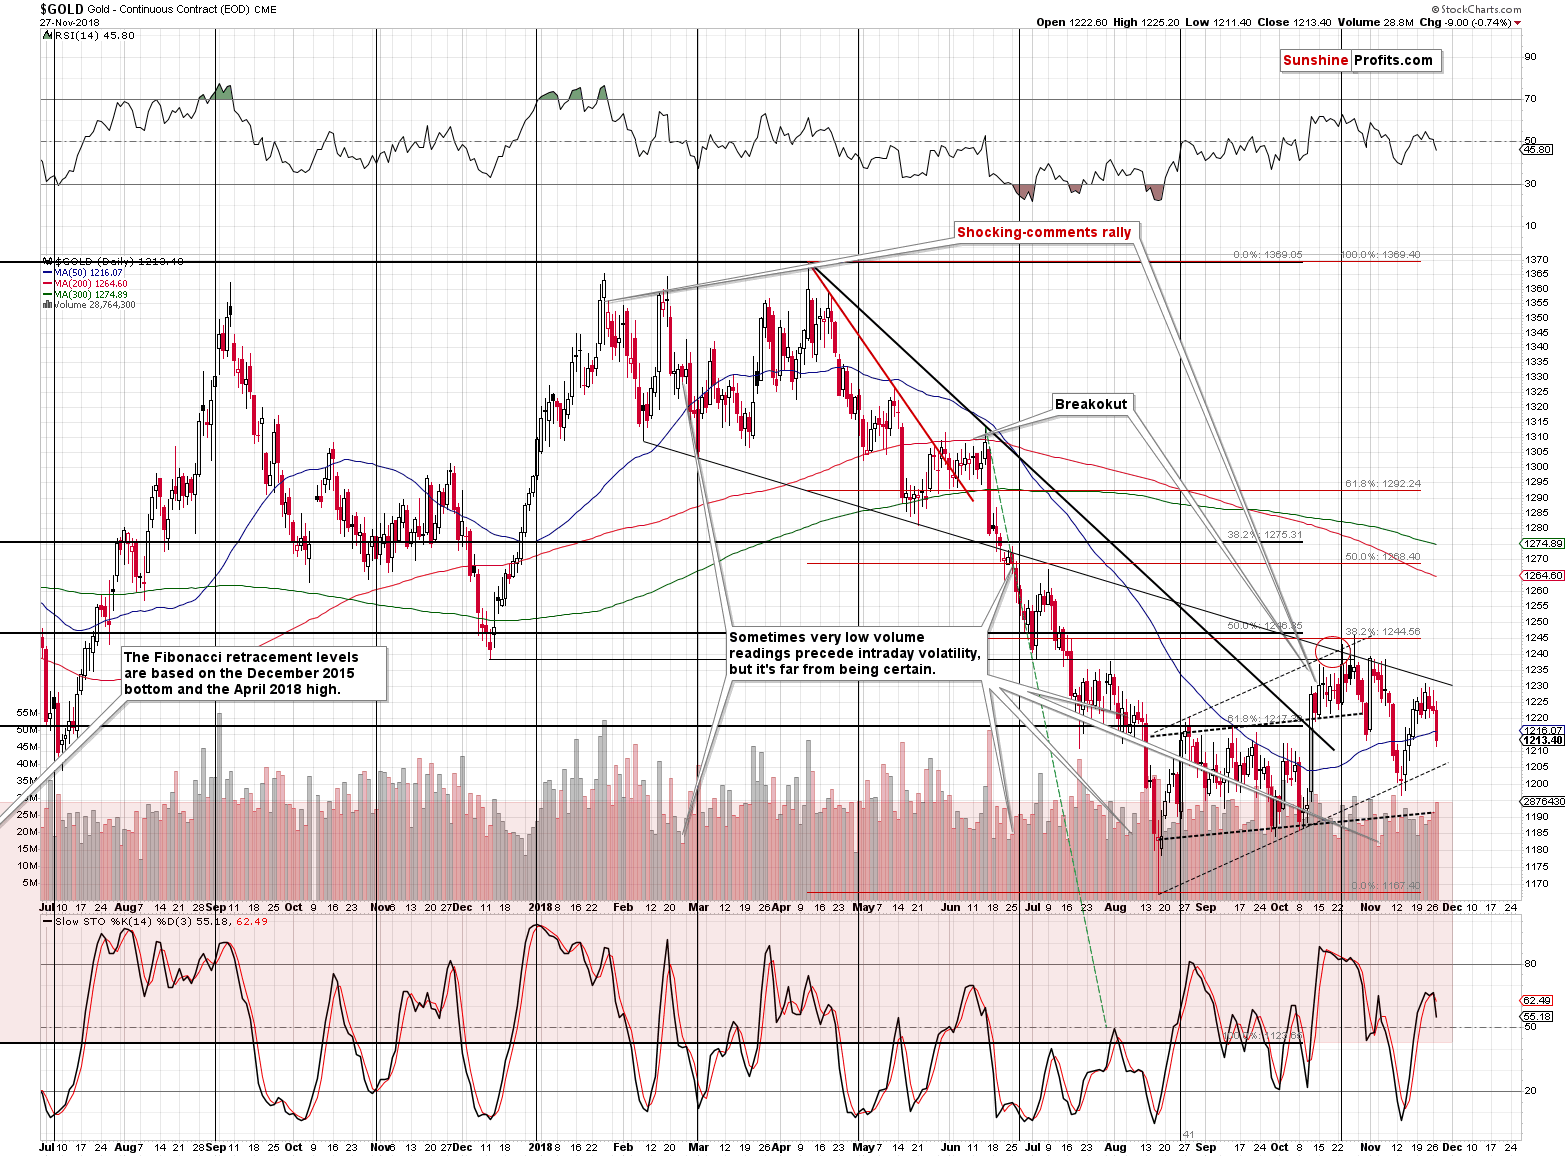
Gold declined on a significant volume and closed yesterday’ session below the 50-day moving average. The Stochastic indicator flashed a sell signal. We previously saw something similar earlier this month, which was followed by a short-term decline. This is a short-term sell signal also this time, but…
It really doesn’t matter. What matters is the combination of the powerful long-term signals that have been in place for a long time and that have been pointing to much lower gold prices. It’s not a $10 decline in gold that is important here. It’s the $150 slide that’s likely to follow shortly… And that will likely be followed by even lower prices (to about $890) after a temporary corrective upswing.

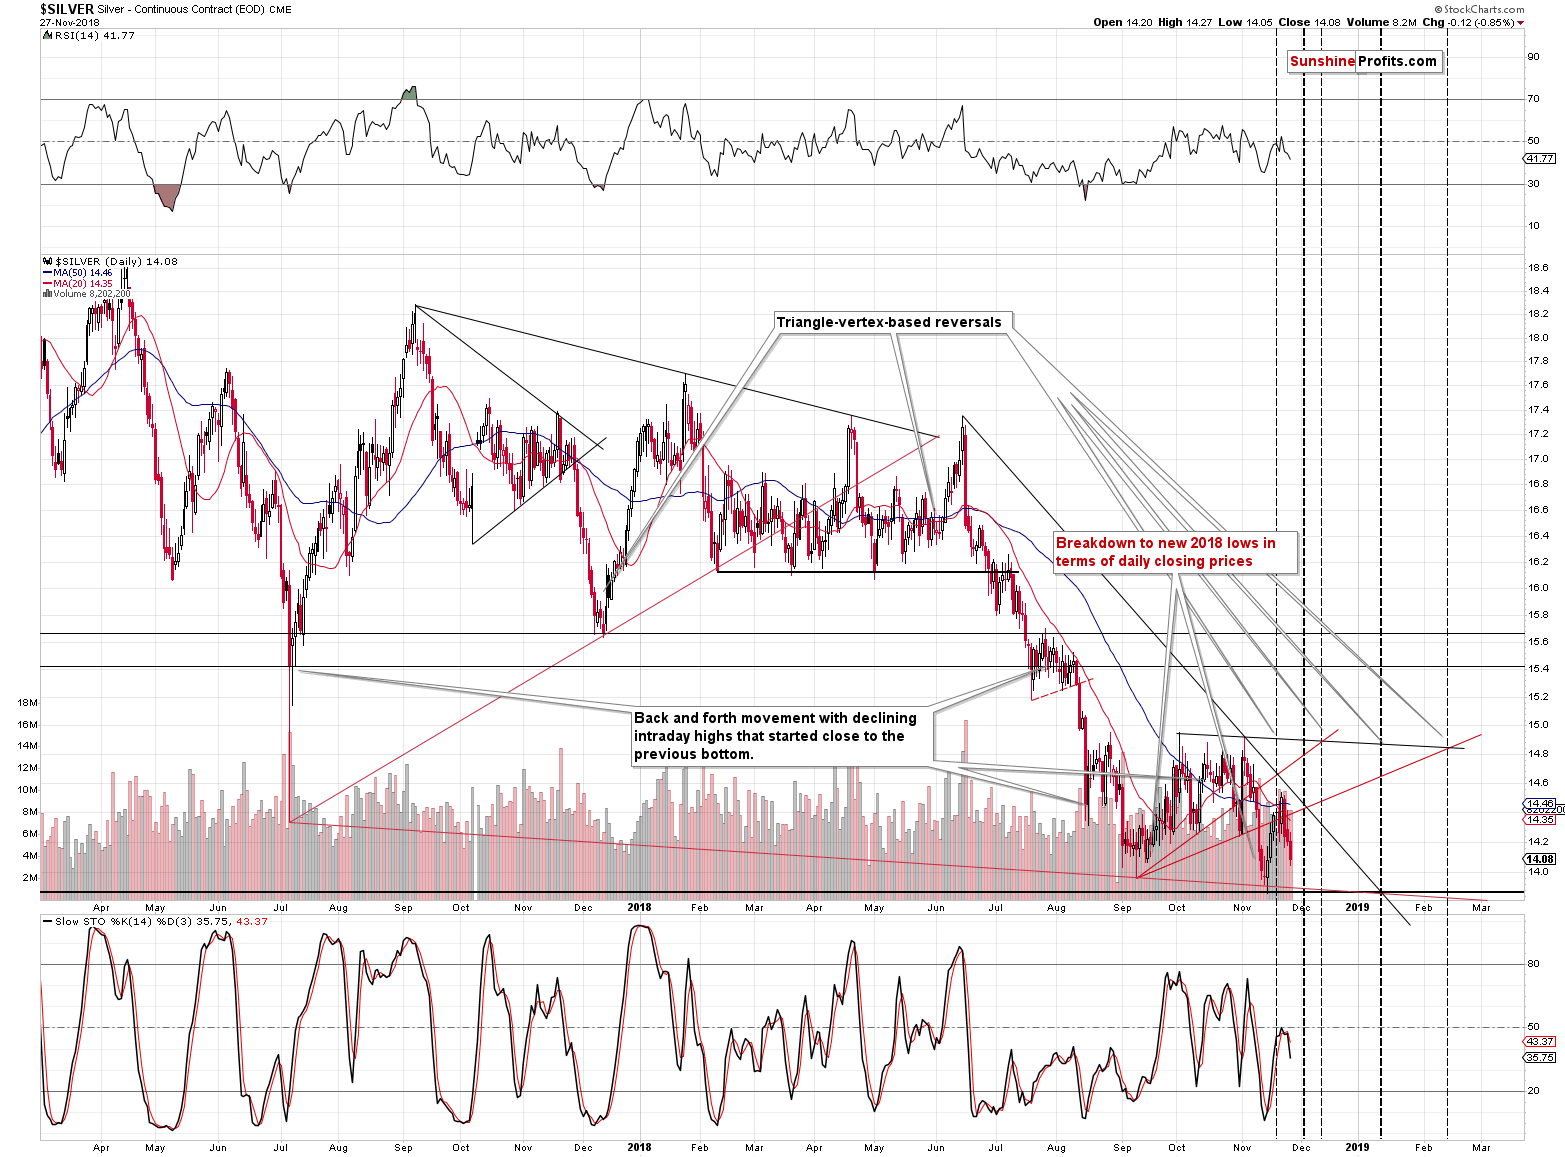
Silver moved lower once again after topping out practically exactly as the triangle-vertex-based reversal had suggested and as we had described it earlier. Silver invalidated the previous breakdown below the $14 level, but will it manage to invalidate the upcoming breakdown as well? It may not be strong enough to do so, since it didn’t even manage to get back to its previous high earlier this month.
Miners’ Breakdown
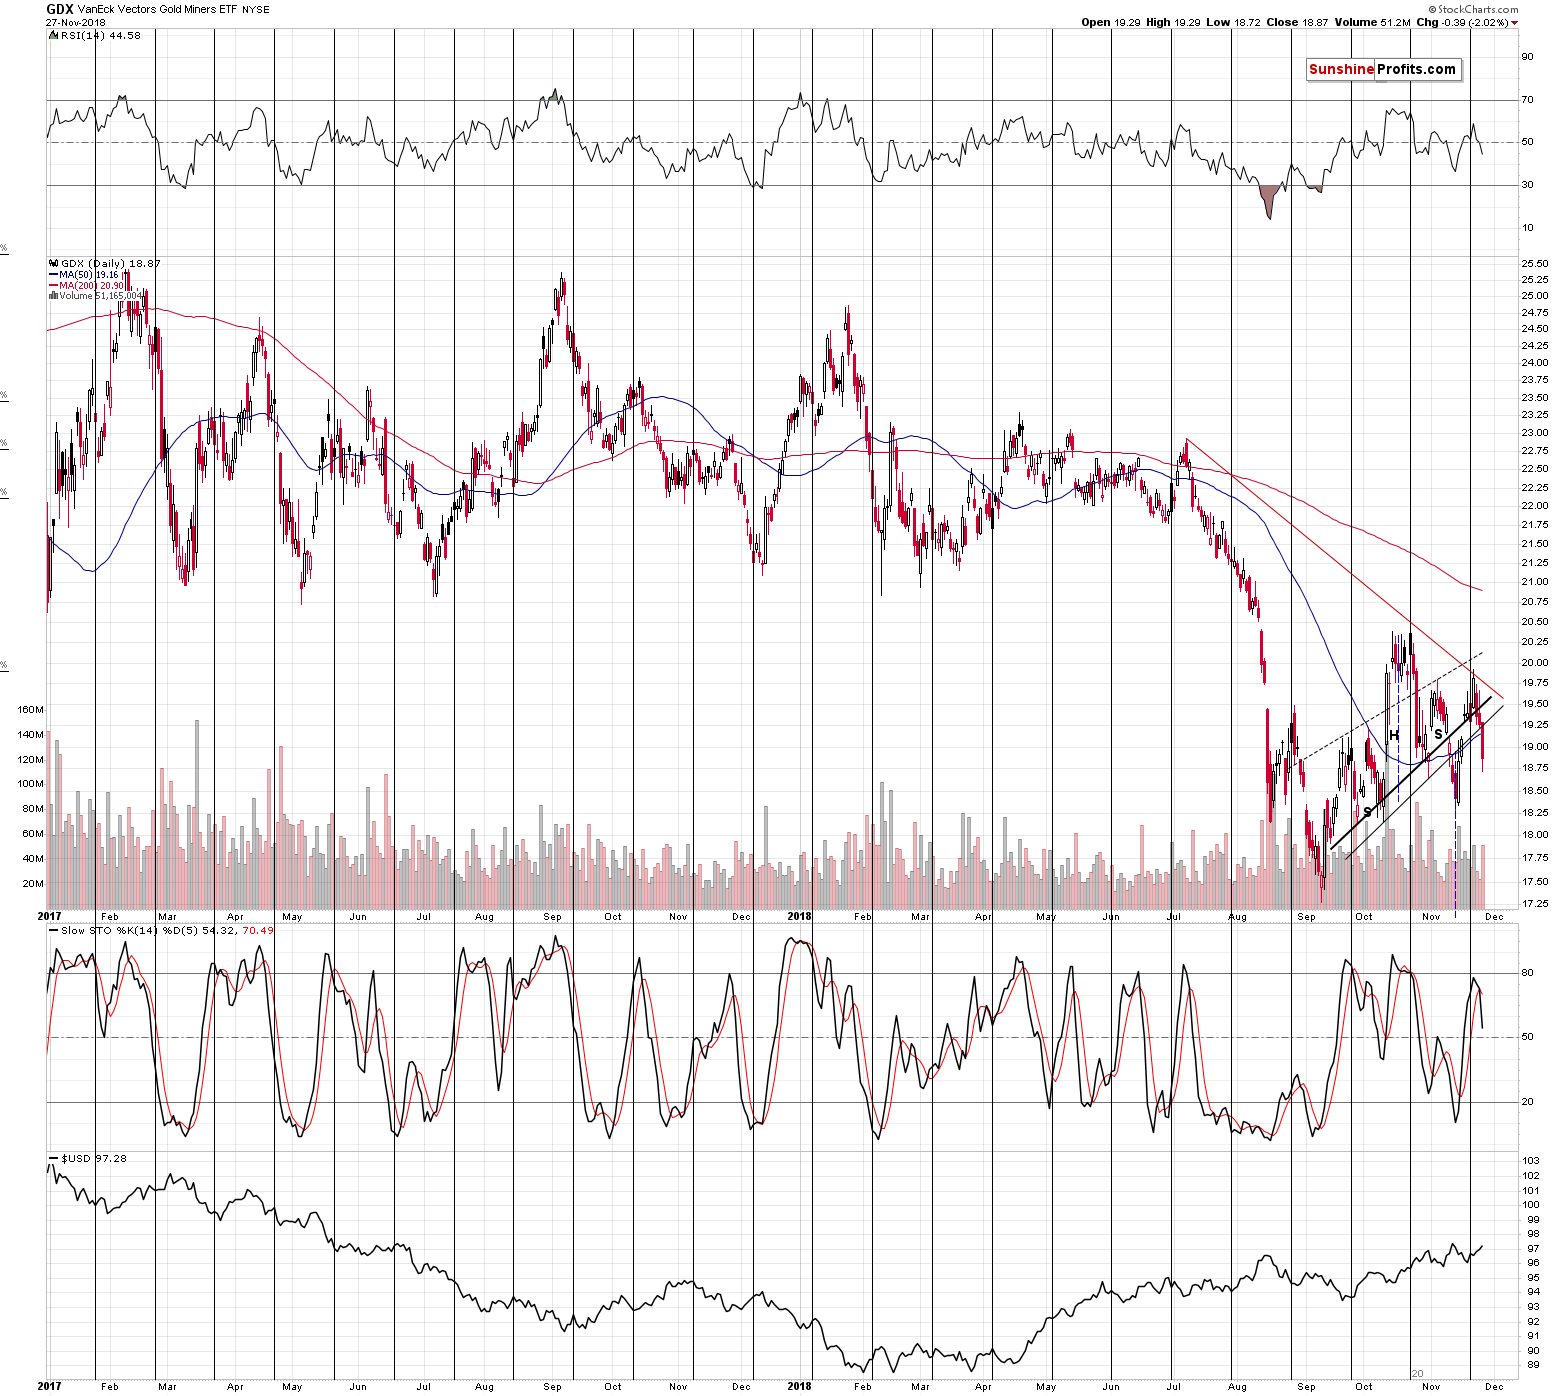
The gold and silver mining stocks declined on strong volume and once again closed the session below the rising neck levels of the bearish head-and-shoulders pattern. The current pattern is a bit different than what we usually see as a head and shoulders pattern. It usually has one head and two shoulders. In this case, we have a pattern that had two left shoulders and two right shoulders. It seems odd, but it’s within the definition of what could be viewed as the H&S pattern. The implications are just as bearish as they would be if the pattern had a regular shape.
But, to be 100% objective, this pattern is not fully completed. The two neck lines that we have on the above chart are not the only way that such line can be created. Another way would be to create it based on the mid-October and mid-November bottoms. Such line would have not been reached, let alone broken. The decline is still likely based on multiple other reasons, but let’s keep in mind that the final bearish confirmation will be when the GDX ETF confirms the breakdown below approximately $18.30 – the above-mentioned hypothetical neck level.
This breakdown is likely to happen shortly and lead to a move to new 2018 lows. Confirmed breakdown below the September bottom will open the way to much lower mining stock prices and volatile declines.
The Direct Trigger
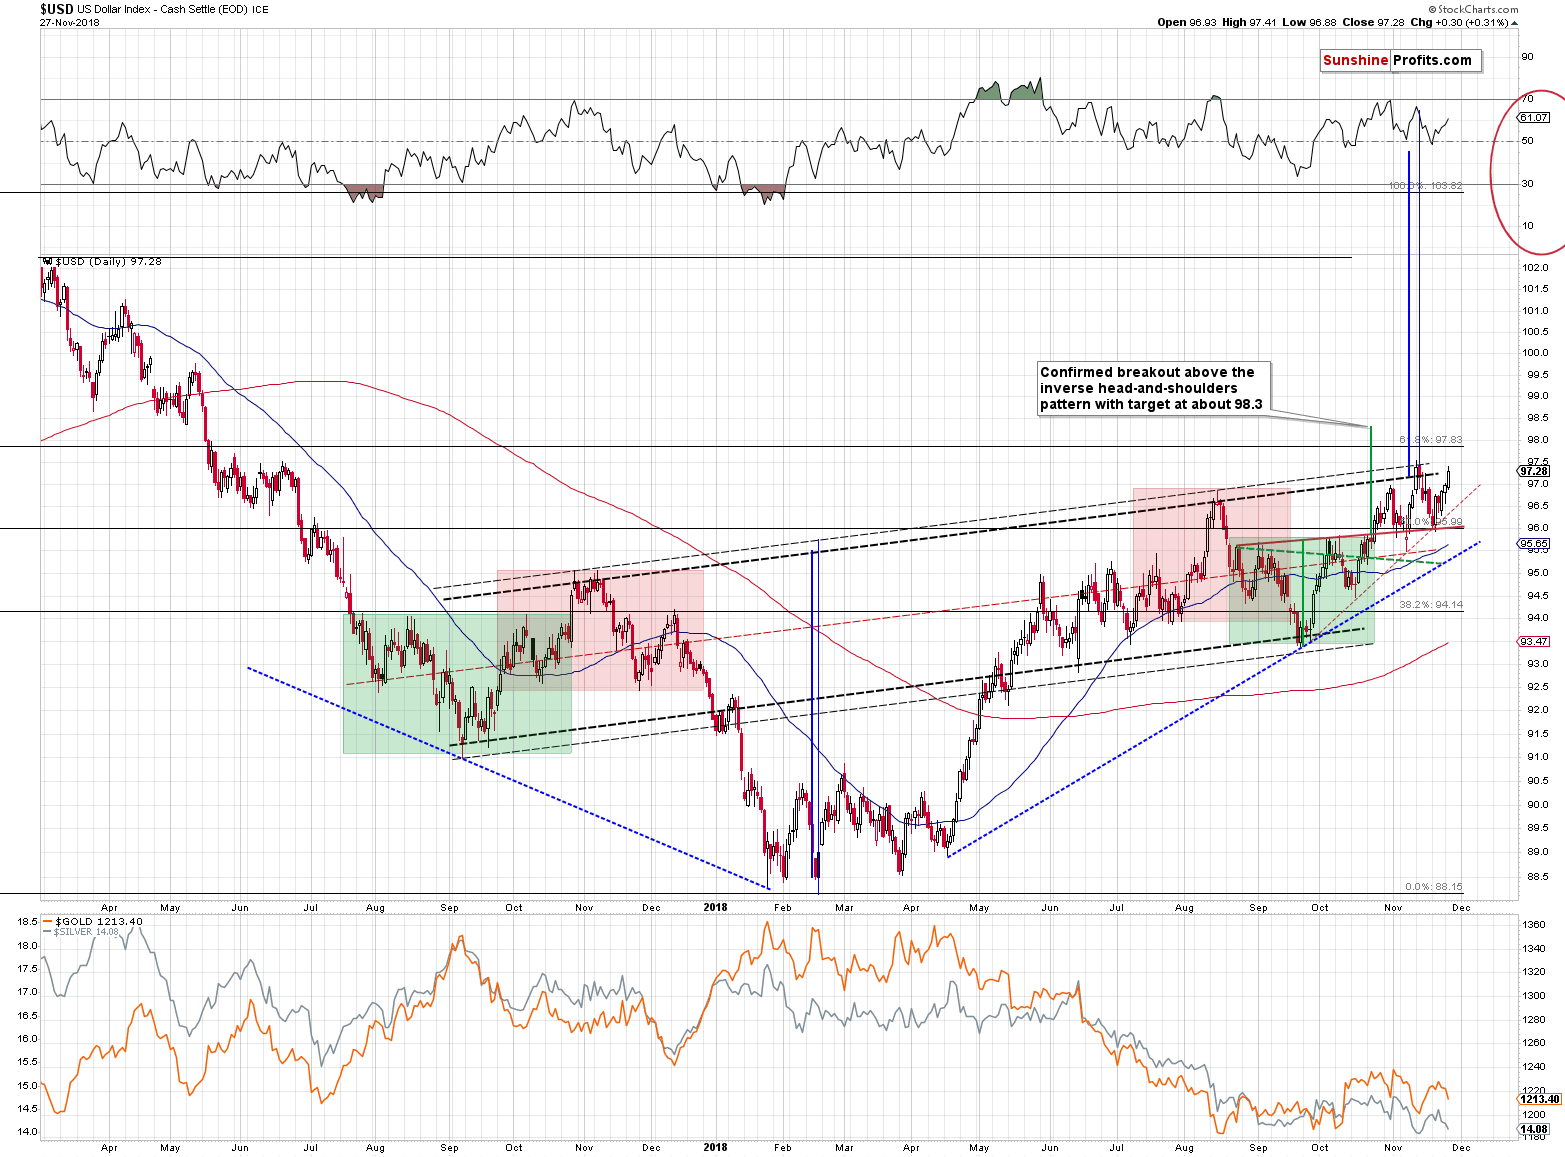
The ultimate direct trigger for the huge decline in the precious metals market will likely come from the breakout above the neck level of the inverse head-and-shoulders pattern in the USD index. This will only be a “direct” reason, because there are many other technical reasons for the big slide in the PMs that we outlined in our previous analyses, and because the foremost reason for the entire decline is that gold and silver simply haven’t fallen enough in 2015. Back in 2015, the sentiment wasn’t bad enough to confirm the final bottom and thus lower prices were likely to be seen eventually even despite the early 2016 rally.
The USD Index is not yet above the upper neckline that’s based on the intraday highs and once it gets there it will be very close to the 61.8% Fibonacci retracement (approximately 97.8) based on the entire 2017 – 2018 decline. Consequently, we may see a pause close to this level, but once the above is taken out and the USD confirms a breakout above 98, the following rally would likely be big and sharp. The corresponding decline in the PMs is likely to be big and sharp as well.
Summing up, the outlook for the precious metals market remains very bearish for the following weeks and months and short position remains justified from the risk to reward point of view, even if we see a few extra days of back and forth trading or even a small brief upswing. It is a very high probability of a huge downswing that makes the short position justified, not the outlook for the next few days. It seems that our big profits on this short position will become enormous in the future and that we will not have to wait much longer. Gold’s inability to rally on the increased geopolitical tensions regarding Ukraine confirm this scenario. In other words, being fully in the market doesn’t seem to be a good gold investment idea.
Naturally, the above is up-to-date at the moment of publishing it and the situation may – and is likely to – change in the future. If you’d like to receive follow-ups to the above analysis (including the intraday ones, when things get hot), we invite you subscribe to our Gold & Silver Trading Alerts today.
Thank you.
Przemyslaw Radomski, CFA
Editor-in-chief, Gold & Silver Fund Manager
Sunshine Profits - Effective Investments through Diligence and Care
Gold & Silver Trading Alerts
Forex Trading Alerts
Oil Investment Updates
Oil Trading Alerts


