

Last week was full of interesting economic data. We analyze them to show that gold bulls have to be patient. The data suggest that the US economy remains healthy. So far.
Inflationary Pressure Eases
On August the 24th, 2018, we published Gold News Monitor in which we wondered whether inflation has peaked. Now, we know the answer: it indeed peaked in July. The CPI has reached 2.7 percent in August over the last 12 months, a slowdown from 2.9 percent in the previous month, as one can see in the chart below. It was the first decline in annual rate in almost a year. The yearly change in the core CPI, which excludes food and energy, also decelerated from 2.4 to 2.2 percent.
Chart 1: U.S. CPI (green line, annual % change) and core CPI (red line, annual % change) from August 2013 to August 2018.
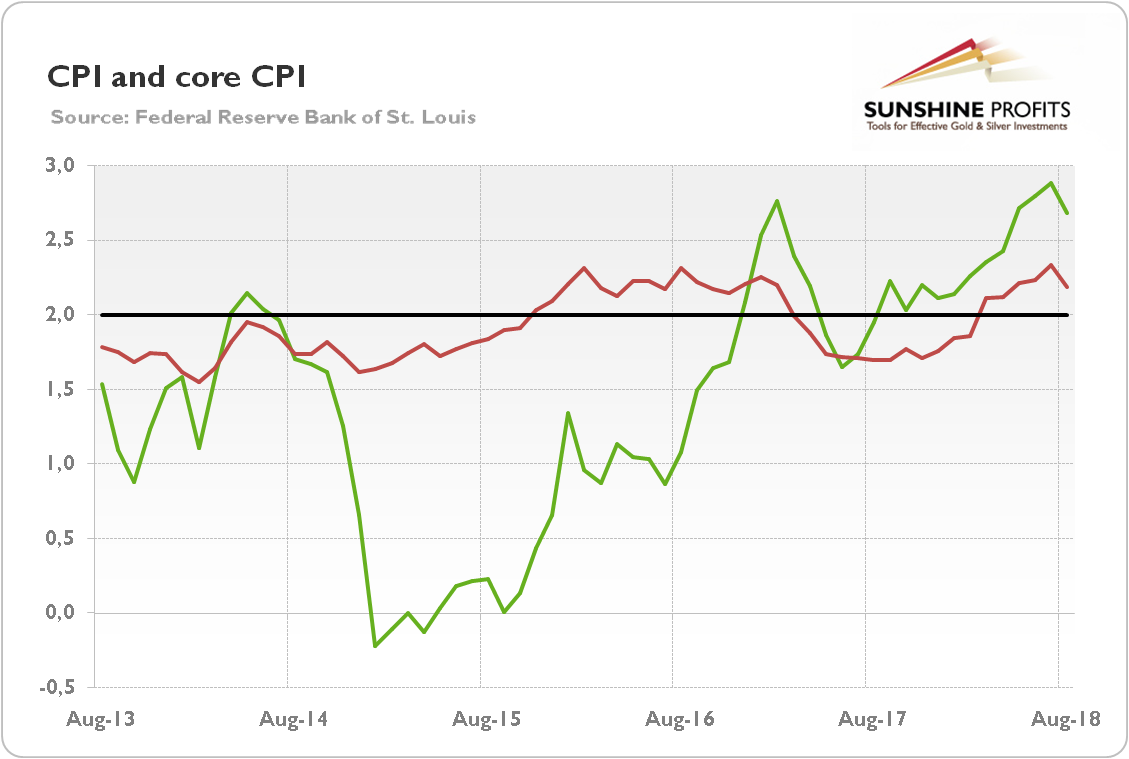
On a monthly basis, the CPI rose 0.2 percent, the fifth straight increase. It was the same change as in July. The core index increased 0.1 percent, following 0.2-percent rise in the previous month. Overall, the inflationary pressure eased somewhat in August. However, inflation remains slightly above the Fed’s target.
Retail Sales Rise Modestly
Retail sales rose only by 0.1 percent in August. However, a scant increase followed 0.7 percent jump in July, so it is understandable. Moreover, the retail sales have surged 6.6 percent over the last 12 months. The advance retail sales excluding food services jumped 6.2 percent, as the chart below shows.
Chart 2: Retail sales (advance numbers; excluding food services, annual % change) from August 2008 to August 2018.
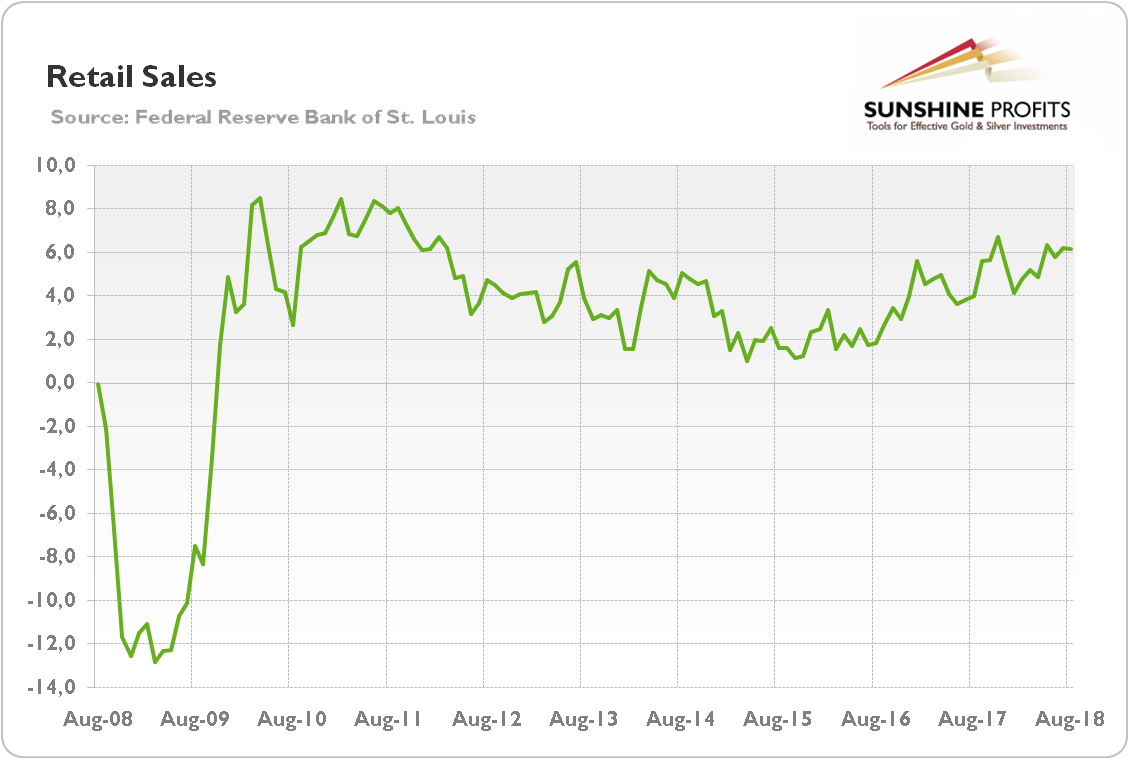
The chart suggests that the US retail sector remains generally solid. It should not be surprising as fundamentals behind the consumer spending are positive: strong job gains, accelerating wage growth (we covered this issue last week), improving household balance sheets, and increasing wealth due to the rising asset prices.
Industrial Production Positively Surprises
Industrial production rose 0.4 percent in August, the same as in July. It was the third straight gain, which was above the Wall Street’s expectations of 0.3-percent increase. On the annual basis, industrial production jumped 4.9 percent, the fastest change since the end of 2010, as one can see in the chart below.
Chart 3: Industrial production (annual % change) from August 2008 to August 2018.
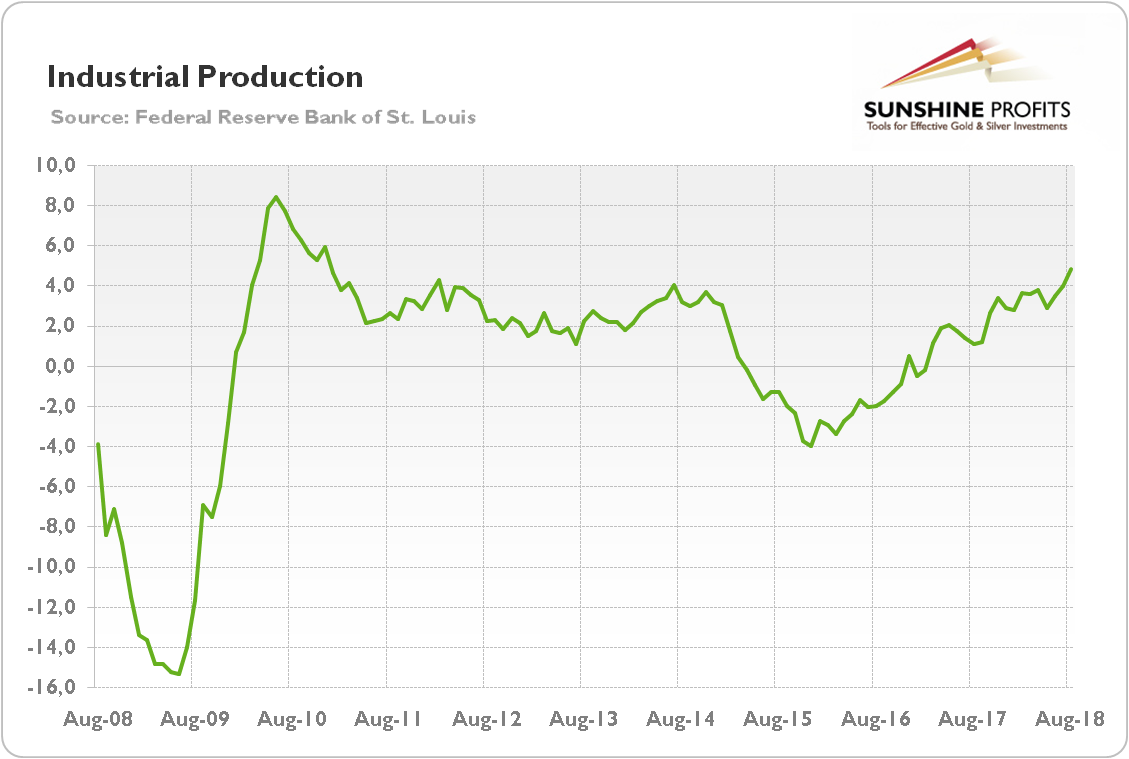
The acceleration in industrial production suggests that – unfortunately for the gold bulls – the risk of immediate recession in the US is rather limited. What is important is that the rise in industrial production was driven by production of motor vehicles and parts, which is sensitive to the business cycle.
Implications for Gold
What does it all mean for the gold market? Well, we do not have good news. Inflation is limited and it eased somewhat in August. However, the change was not big and was generally expected. It should not alter the Fed’s policy of gradual tightening. Moreover, both the retail sales and industrial production look solid on the annual basis. As a reminder, both indices are taken into account by the NBER to determine the recession. Hence, it seems that the US economy remains healthy. As Charles Evans, Chicago Fed President, has recently said, it “is firing on all cylinders”. Gold has to still wait for its moment of glory.
How long? Well, nobody knows it for sure. For example, Roubini and Rosa forecast that by 2020 the economic stimulus will run out and the stage will be set for another downturn. If they are right, which might be the case, the gold will shine. But the current US economic data and general macroeconomic conditions are not supportive for the yellow metal.
If you enjoyed the above analysis, we invite you to check out our other services. We provide detailed fundamental analyses of the gold market in our monthly Market Overview reports and we provide daily Gold & Silver Trading Alerts with clear buy and sell signals. If you’re not ready to subscribe yet and are not on our gold mailing list yet, we urge you to sign up. It’s free and if you don’t like it, you can easily unsubscribe. Sign up today!
Disclaimer: Please note that the aim of the above analysis is to discuss the likely long-term impact of the featured phenomenon on the price of gold and this analysis does not indicate (nor does it aim to do so) whether gold is likely to move higher or lower in the short- or medium term. In order to determine the latter, many additional factors need to be considered (i.e. sentiment, chart patterns, cycles, indicators, ratios, self-similar patterns and more) and we are taking them into account (and discussing the short- and medium-term outlook) in our trading alerts.
Thank you.
Arkadiusz Sieron, Ph.D.
Sunshine Profits‘ Gold News Monitor and Market Overview Editor
Gold News Monitor
Gold Trading Alerts
Gold Market Overview
