

Silver was just breaking to new highs, gold stocks (HUI) were above the 205 level and gold was at levels not seen since August 2016. Gold and silver bulls were cheering. They are not cheering anymore. Even though the above was the case just several days ago, it was all invalidated, just like we expected it to be. Based on what happened on Friday, silver and mining stocks are at their new 2018 lows and their entire 2018 performance is a one huge bearish reversal. Where do precious metals go from here?
Lower. Likely much lower.
Why? Let’s see, starting with the short-term charts (charts courtesy of http://stockcharts.com).
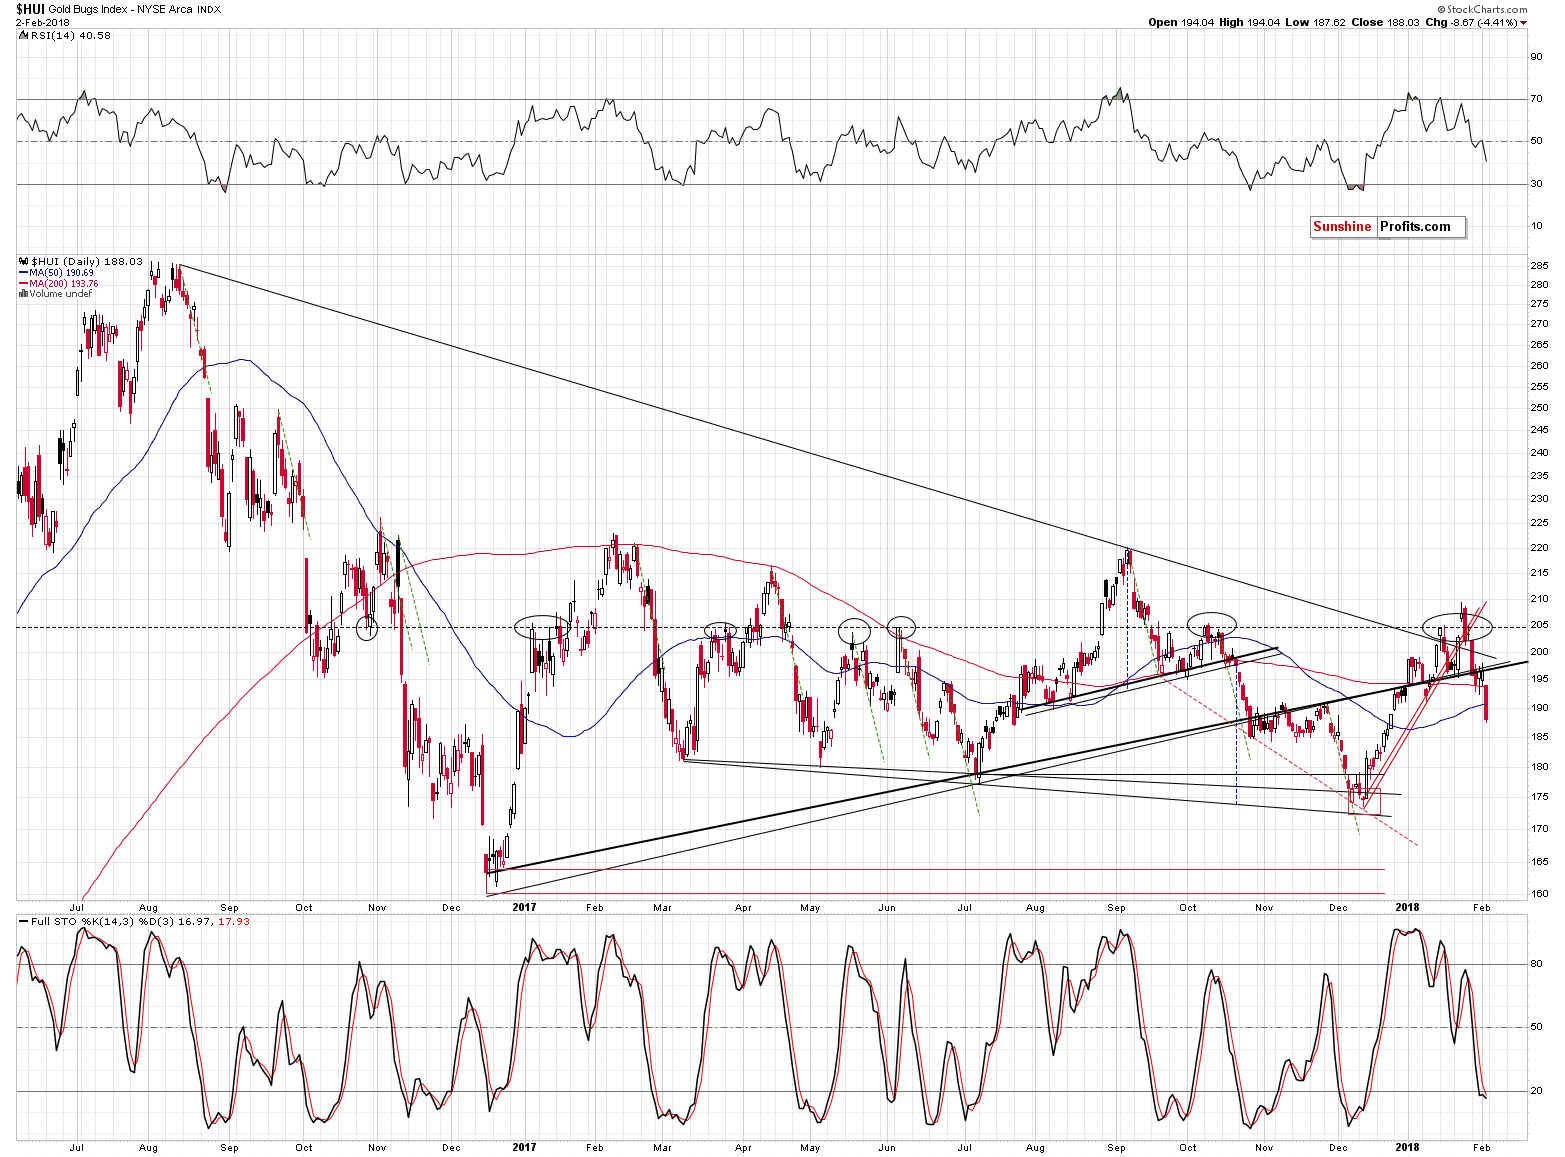
In our previous analyses we emphasized that the small 2-day consolidation didn’t change anything because gold miners have recently broken below all important nearby support levels that could be broken and none of these breakdowns was invalidated:
- The mid-January high.
- The early January high.
- The late January low.
- The 205 level (invalidating the breakout).
- The declining, medium-term resistance line (invalidating the breakout).
- The rising, medium-term resistance / support line.
- The rising short-term (red) resistance / support line.
Consequently, the bearish implications remained in place and during Friday’s session, we saw their result. Gold stocks took a dive and closed at levels not seen since December 22, 2017. The HUI Index also close below the 50-day and 200-day moving averages. Both MAs served as important support and resistance lines (especially the latter), so this move is significant.
The very high reading of volume during the decline seems to confirm that this is really the direction in which the market wants to go.
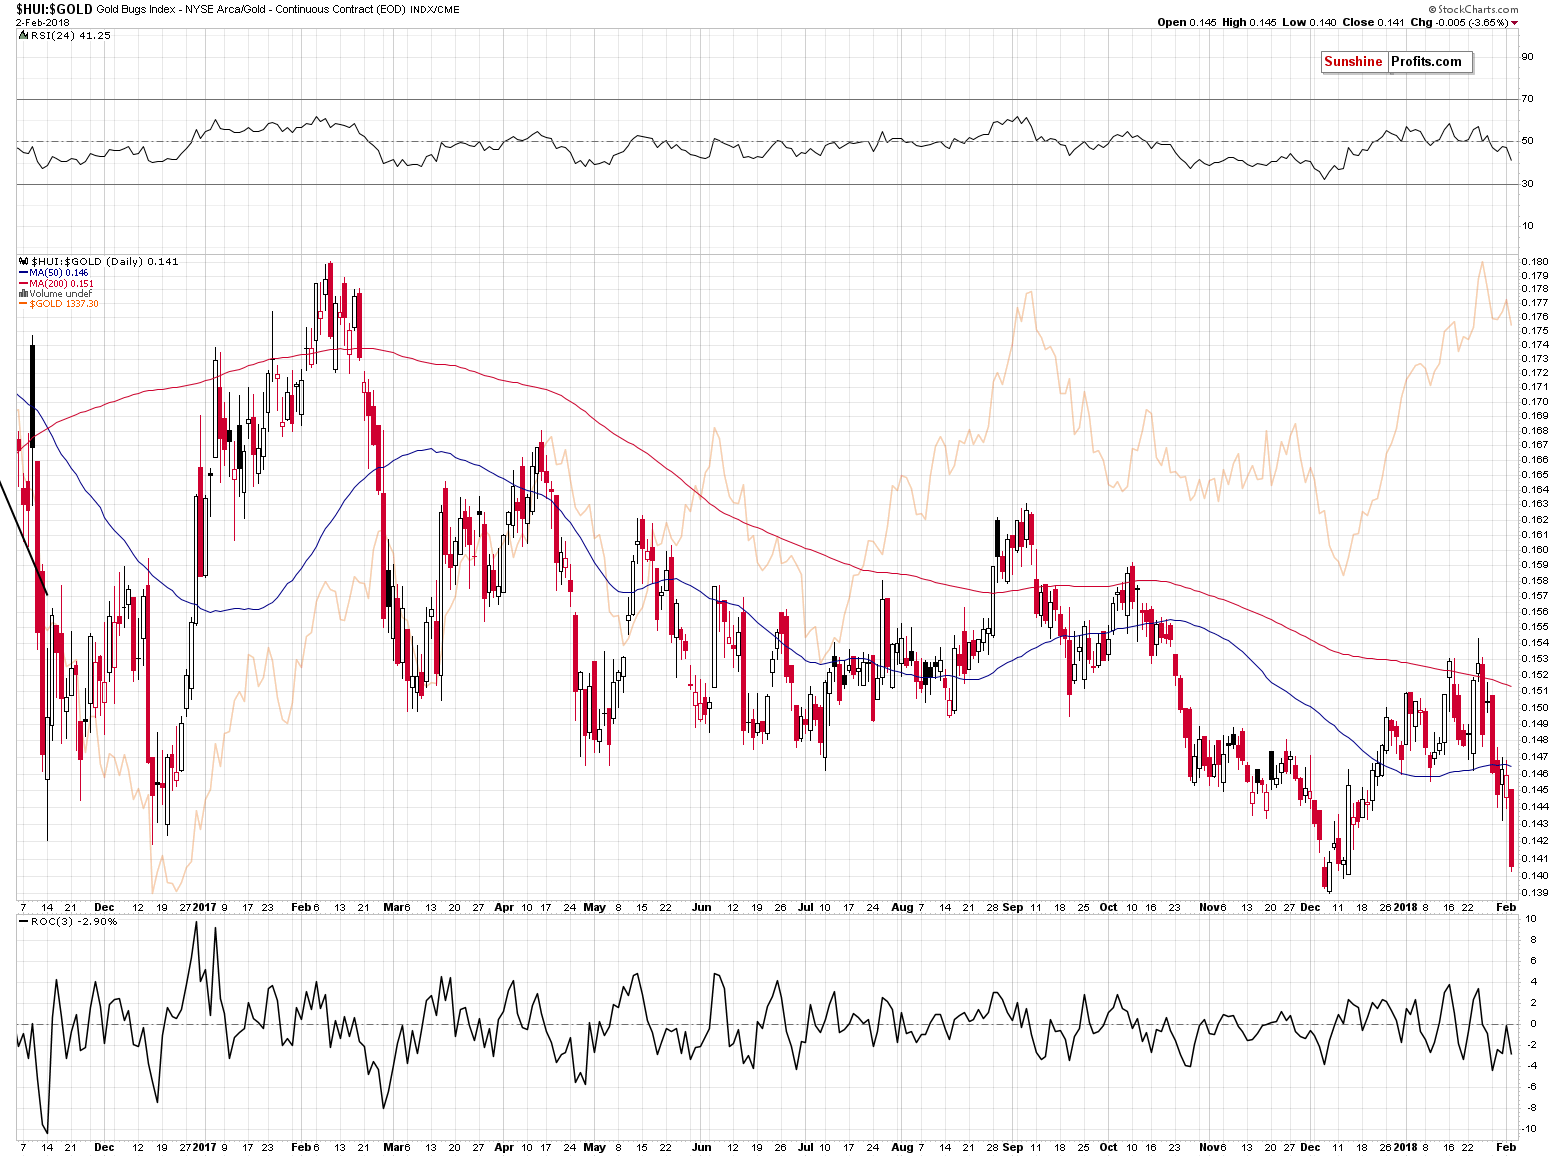
The gold stocks to gold ratio is indicating the same thing. The miners underperformed gold to a great extent and are on the verge of breaking below the 2017 lows. They are already below the 2016 lows at this moment, which is yet another bearish sign.
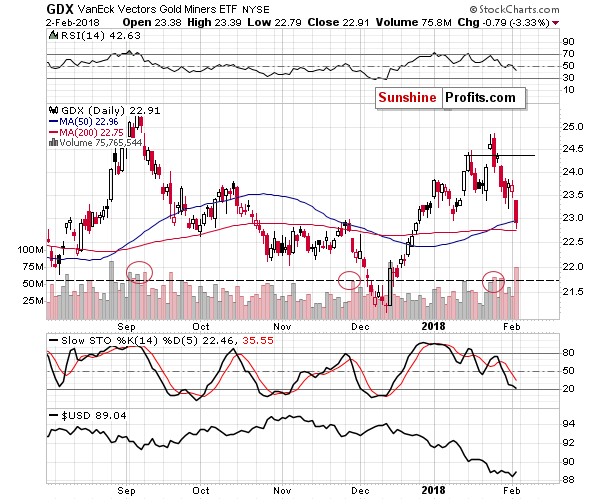
Meanwhile, since we posted our bearish comments on the above chart, silver stocks declined sharply and moved quite close to the late 2016 and 2017 lows. If this momentum continues for a few more days, we’ll see another major breakdown that will open the door to even bigger – and more volatile – declines.
Overall, the outlook for the mining stocks is bearish for the short and medium term. Having discussed the above, let’s check the situation in the white metal.
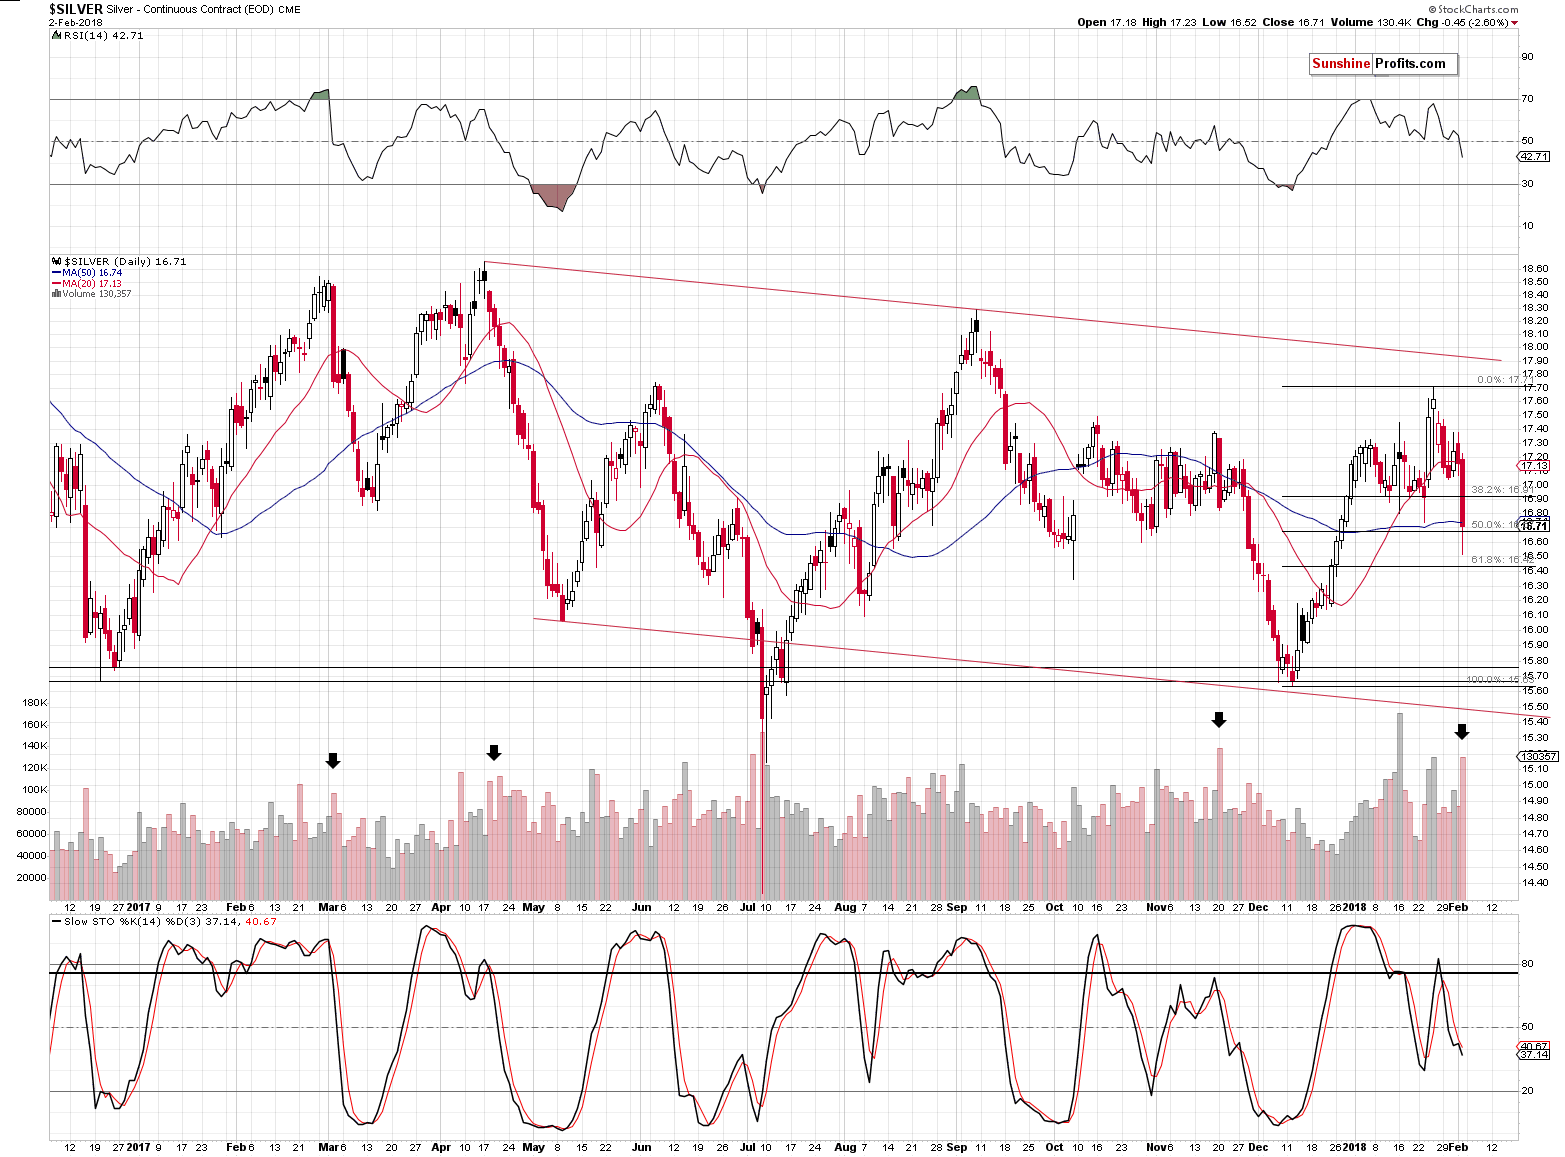
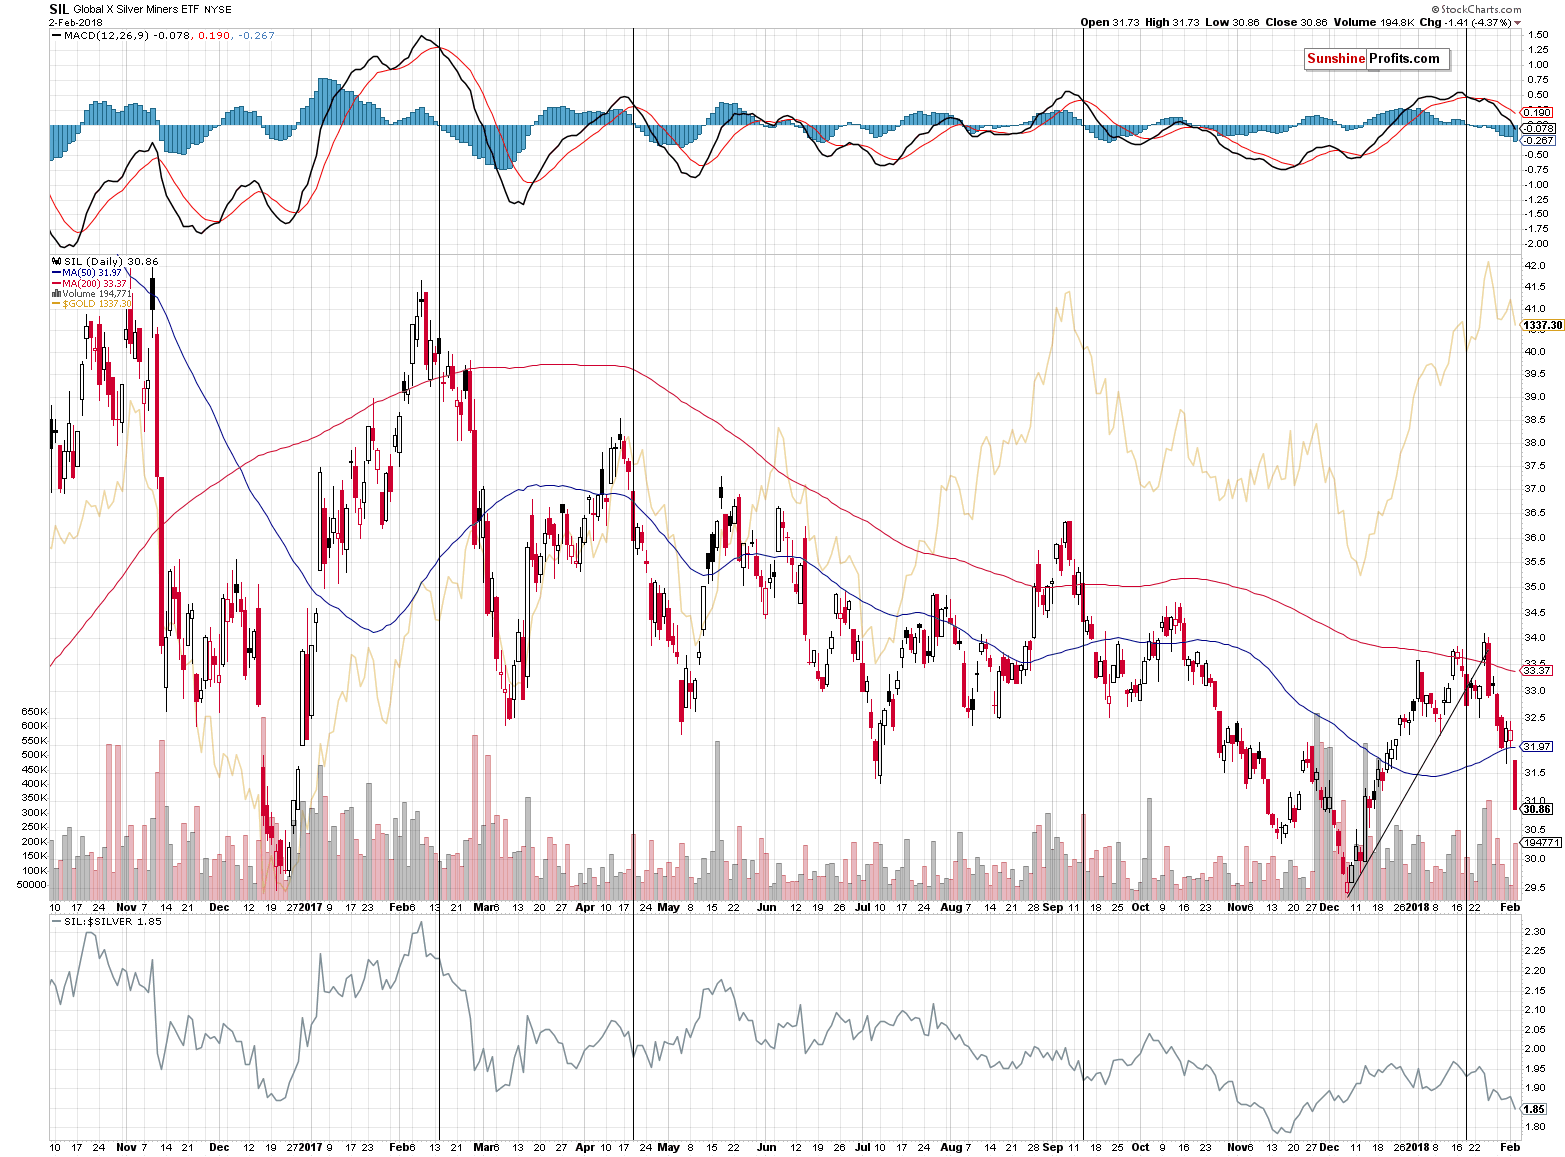
Silver declined profoundly during Friday’s trading on huge volume. This serves as a good indication that the main part of the decline is beginning. We marked similar situations (with regard to volume) with black arrows. The previous cases were followed by additional $1-$2 declines, so the analogy to them is definitely bearish.
The volume analogy is particularly bearish not only because of the above, but also because of what preceded it: epic volume that was as big as the one seen in April 2013.
Silver moved higher in today’s pre-market trading, but it remains well below the $17 level and below the previous low of this year in terms of the closing prices, so the bearish outlook remains in place.
To be clear, we don’t think that silver is going to decline by only $1-$2, but by much more, but a decline of this magnitude will be a good start.
In fact, we expect silver to move lower very substantially before bottoming. The white metal’s decline should scare precious metals investors away from the market and the investors’ sentiment should be extremely unfavorable before the huge bull market in silver can resume. That’s the factor that was missing in late 2015 – people were not scared or very bearish – as they should have been at a key bottom. Consequently, it doesn’t seem that late 2015 was indeed the final bottom.
If the 2015 bottom was not the final one, then silver is going below it. Let’s check how much below the $14 level the silver price could go.
In order to do this, we’ll apply two techniques that we’re using in the case of other charts and we’ll remind you about something that we discovered a long time ago, but that remains to be very up-to-date also today. We get the feeling that you are most interested in the latter, so let’s start with it.
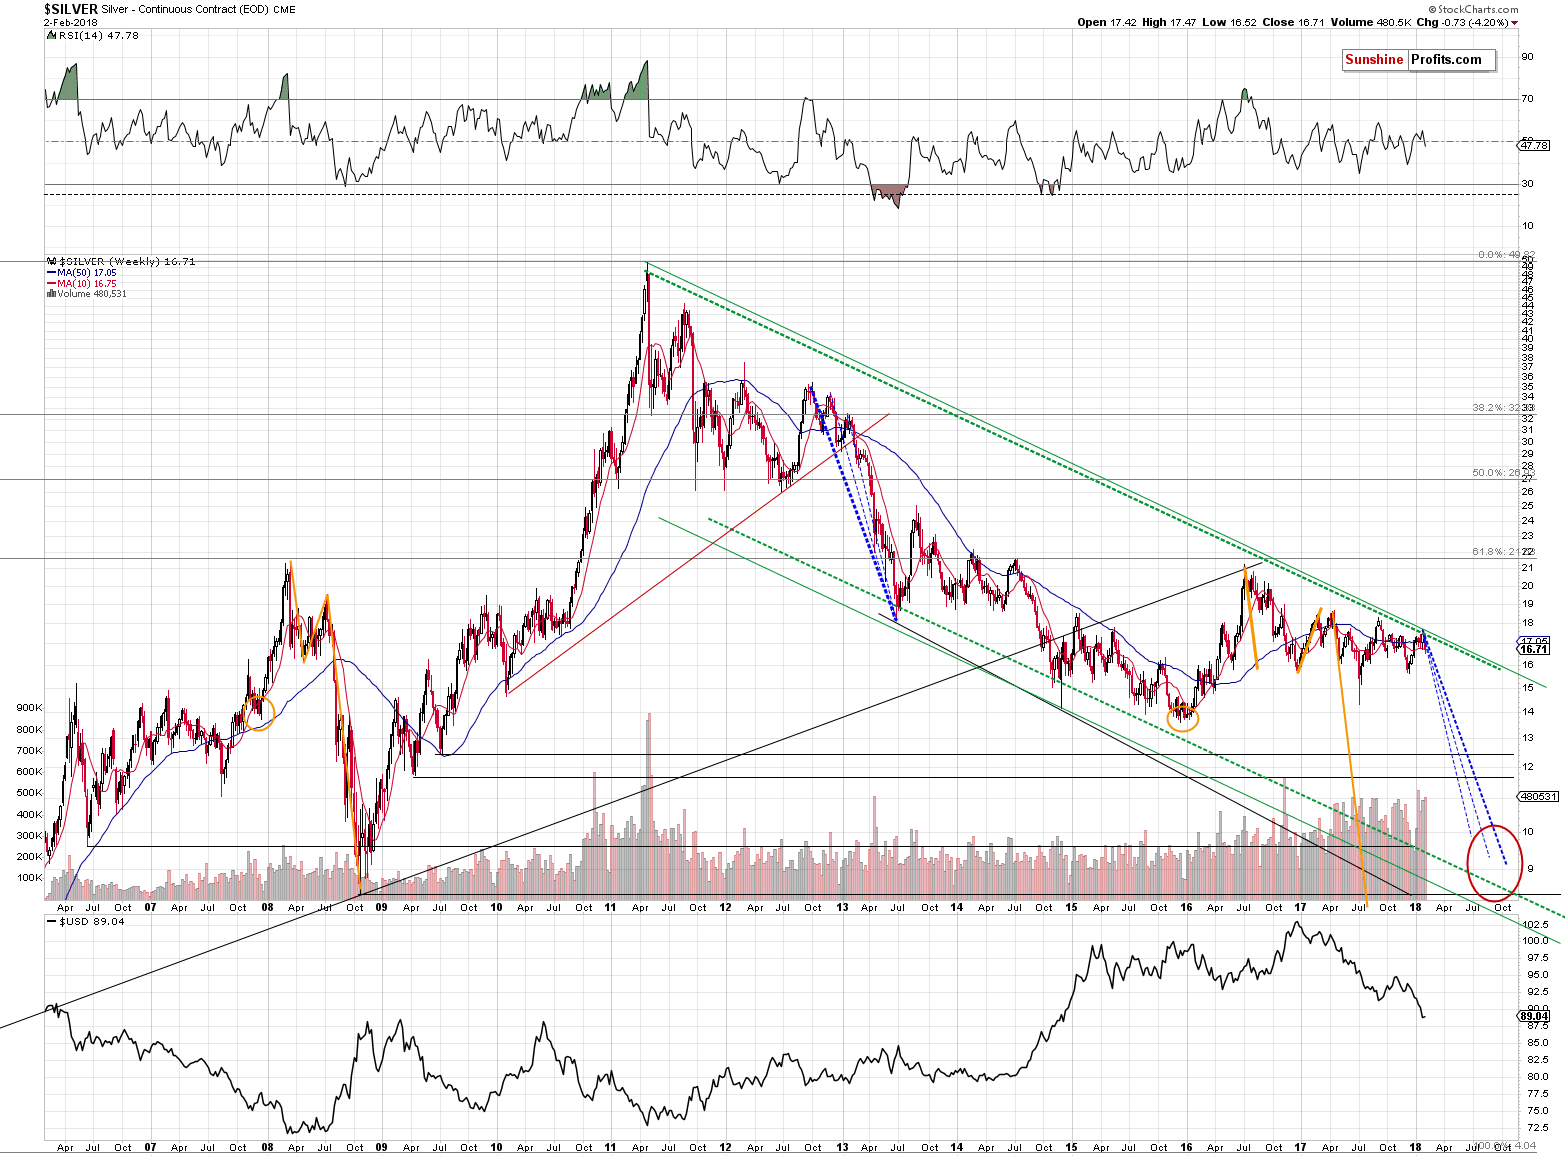
Please note the orange ellipses and lines on the above chart. You can see them in late 2007, in 2008, 2015, 2016 and 2017. You see, starting from the bottoms marked with orange ellipses, the price moves that are marked with the lines are practically identical – at least so far. The price moves are not identical only in the case of their range. The starting and ending points are extremely similar as well.
In both cases, silver bottomed a bit below $14 and quickly soared above $21. Then it declined to about $16 (in both cases). Then it rallied to about $19 (again, in both cases). Then it moved lower once again and declined very far dramatically before moving above the previous highs. Back in 2008, the decline was seen quickly. In this case, silver is taking its time. Does this invalidate the analogy or does it make it any less valid?
No. Back in 2008 silver’s decline got help from a strong rally in the USD and now, silver gets a boost from a huge decline in the USD. A decline that seems to be ending, but let’s stay with silver for a while. The important observation is that silver should have rallied given the decline in the USD from about 100 to below 90 over the last year. It didn’t. It’s actually even lower than it was during the 2017 top.
The analogy to 2008 wasn’t invalidated – it was just significantly delayed. When the circumstances are analogous, and the USD starts a rally, the silver market is likely to perform just as it did in 2008 or at least similarly. This means that we can expect silver to move to $10 or perhaps even temporarily below it before the final bottom is reached.
As we wrote above, that’s only one technique that points to these levels. The other two ones are the analogy to the 2013 decline and the lower border of the declining trend channel.
We marked the former with the declining dashed lines. The boldest of them marks the most likely analogy – if the top that we are – most likely – currently seeing is indeed the start of the final decline, then it is precisely this analogy that we should be focusing on.
The lower border of the trend channel is parallel to the line based on the key tops of the 2011 – today decline. That’s a classic way to create a support line, so it doesn’t seem to require a lot of commentary. Trend channels work in most markets and silver is one of them, so adding this kind of support is useful.
What does it all leave us with? Silver is likely to slide much lower before the decline is completely over. In fact, it could go to levels that appear shocking or unbelievable at this time. Before dismissing the above, please note that a move from the current levels to single-digit prices already took place less than ten years ago. Why wouldn’t it be possible for history to repeat itself? After all, that’s the thing that it tends to do.
On a side note, please note that our bearish comments on the precious metals sector doesn’t make us an enemy of gold and silver investors – it makes us a true (!) friend. If you ask your friends how you look before going to an important meeting, everyone will tell you that you look great regardless of the truth as they will prefer not to be the ones that ruin your mood by saying something unpleasant. But, a true friend will tell you how things really are, so that you can fix something before your leave. This may be unpleasant, but ultimately, it’s the second approach that benefits you. Most gold promoters will want you to think that gold is going to go higher no matter what happens and all you should do is buy, buy, buy. And then buy some more. They don’t want to risk upsetting you. But not us. We’re that true friend that tells you what they think and why regardless of the possibility of being unpleasant – so that you can benefit more. In this case, if we’re correct about the bearish outlook for the precious metals, it will be much more profitable to be buying at lower prices than at the current ones.
So, in our view, the outlook for the precious metals market is friendly bearish. The precious metals market is likely to move much higher in the coming years, but if we’re correct about the medium-term decline first, then the best buying opportunity is still ahead of us.
Naturally, the above is up-to-date at the moment of publishing it and the situation may – and is likely to – change in the future. If you’d like to receive follow-ups to the above analysis (including the intraday ones, when things get hot), we invite you to subscribe to our Gold & Silver Trading Alerts.
Thank you.
Sincerely,
Przemyslaw Radomski, CFA
Founder, Editor-in-chief, Gold & Silver Fund Manager
Gold & Silver Trading Alerts
Forex Trading Alerts
Oil Investment Updates
Oil Trading Alerts
