
Forex Trading Alert originally sent to subscribers on December 30, 2014, 9:35 AM.
Yesterday, the combination of a stronger greenback and Greek Prime Minister’s commentary (Antonis Samaras said that he will recommend parliamentary elections are held on January 25) pushed EUR/USD lower. Because of these circumstances, the exchange rate broke below the support line and dropped to its lowest level since Jul 2012. Earlier today, the pair extended losses and hit a fresh 2014 low. Will we see a test of the barrier of 1.2100 in the coming days?
In our opinion the following forex trading positions are justified - summary:
EUR/USD
Quoting our Forex Trading Alert posted on Monday:
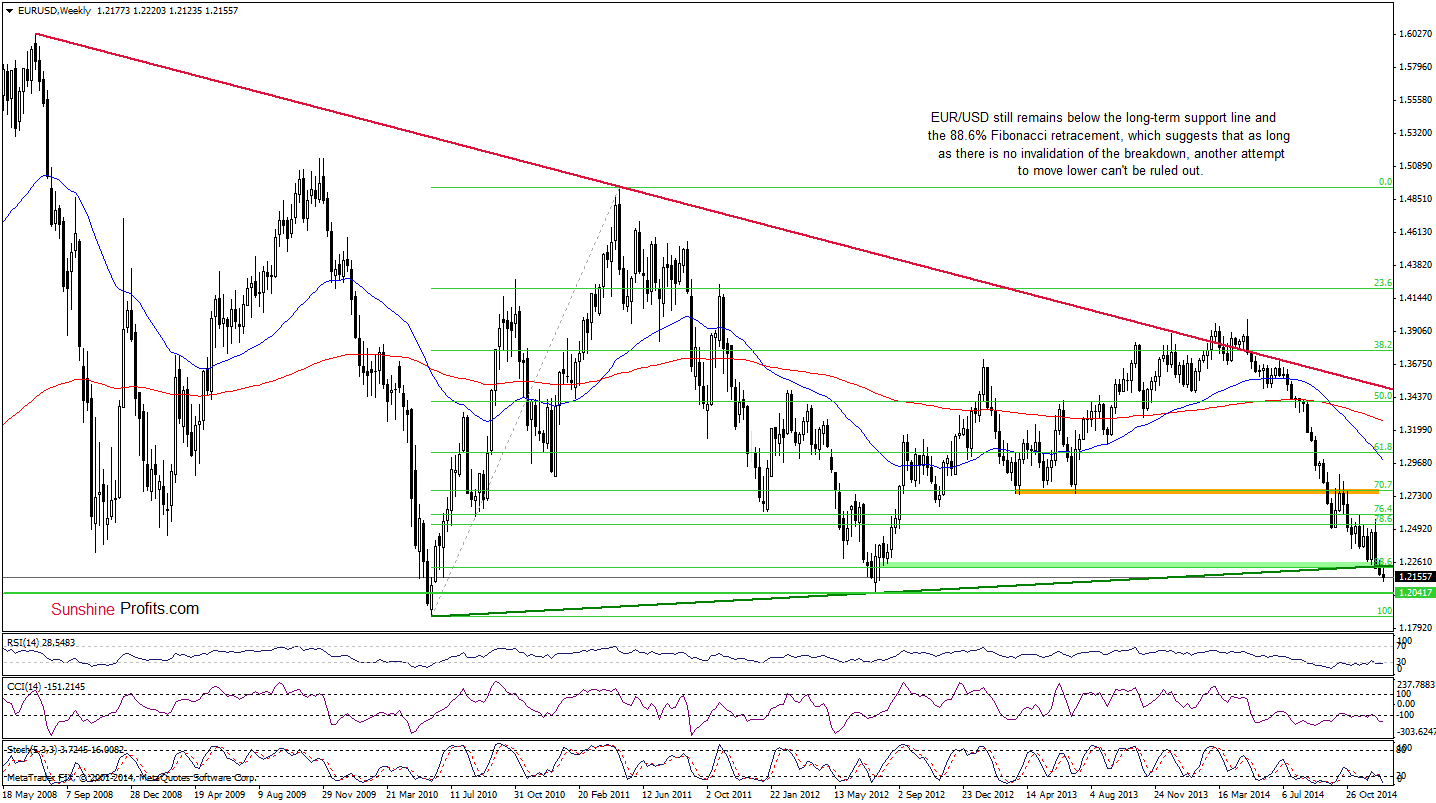
(…) the pair is still trading in a consolidation below the previously-broken long-term support/resistance line and the 88.6% Fibonacci retracement. In our opinion, as long as there is no invalidation of the breakdown under this important area, further improvement is not likely to be seen and another attempt to move lower can’t be ruled out.
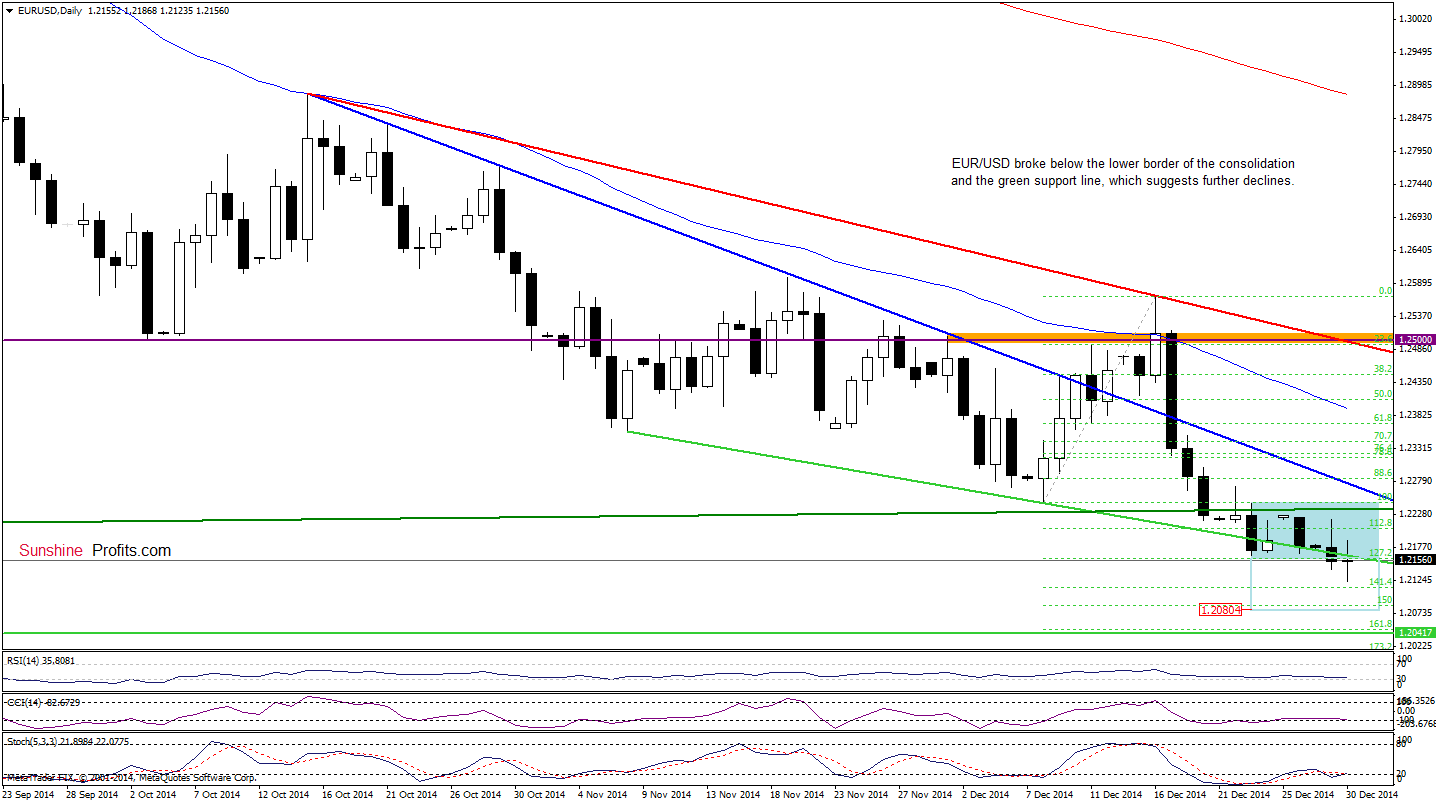
As you see on the daily chart, the situation has deteriorated as EUR/USD extended declines and dropped below the lower border of the consolidation and the green support line (based on the Nov 7 and Dec 8 lows). This is a bearish signal, which suggests further deterioration and a pullback to around 1.2080, where the size of the downswing will correspond to the height of the consolidation (this area is also supported by the 150% Fibonacci extension based on the Dec 8-Dec 16 rally).
Very short-term outlook: bearish
Short-term outlook: mixed
MT outlook: mixed
LT outlook: bearish
Trading position (short-term): In our opinion, no positions are justified from the risk/reward perspective at the moment. We will keep you informed should anything change, or should we see a confirmation/invalidation of the above.
GBP/USD
The medium-term outlook hasn’t changed much, therefore, what we wrote in our last commentary on this currency pair is up-to-date:
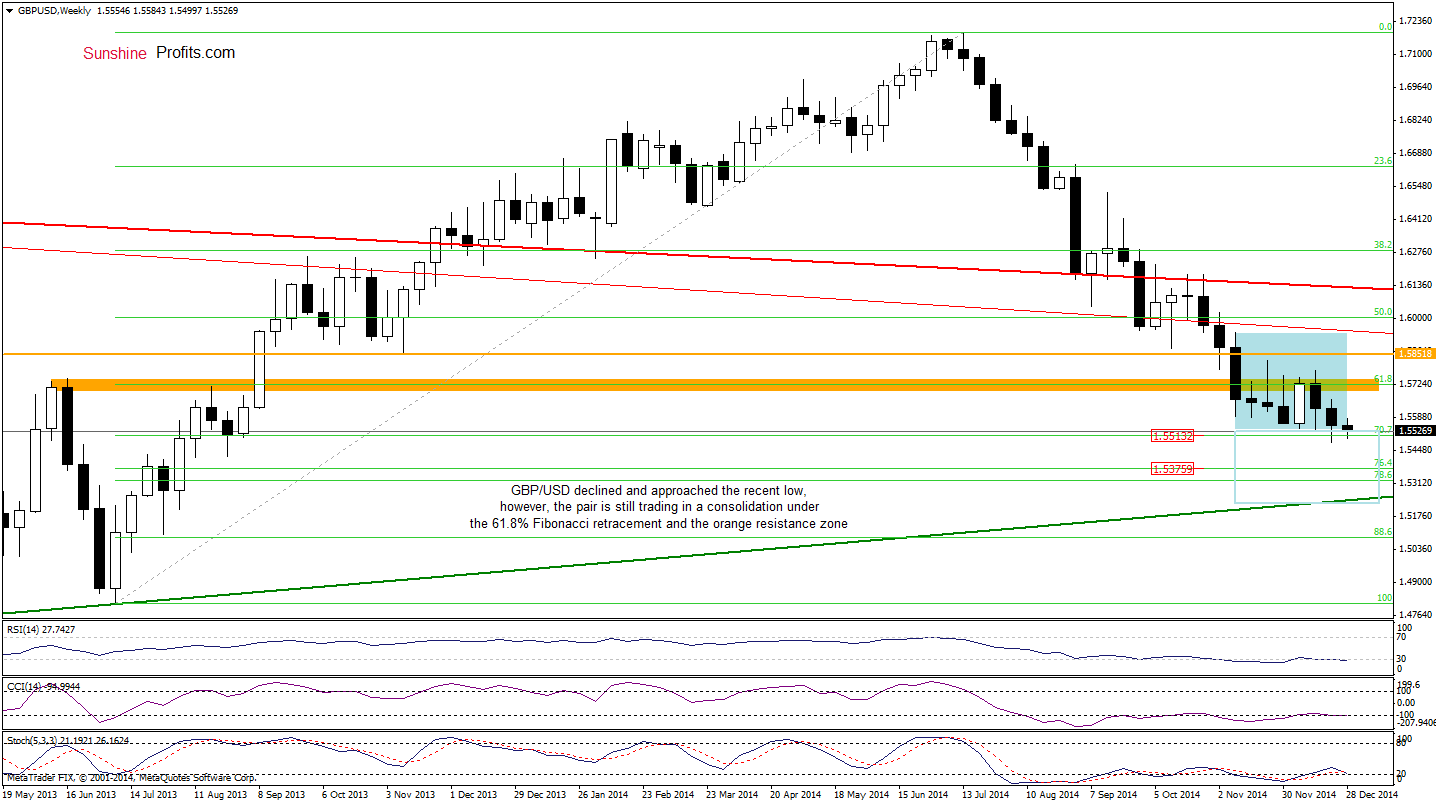
(…) GBP/USD is still trading in the consolidation under the previously-broken 61.8% Fibonacci retracement and the orange resistance zone. Taking this fact into account, we believe that a breakout above the upper line of the formation (or a breakdown below the 70.7% Fibonacci retracement) will show us the direction of future moves.
Can we infer something more from the daily chart? Let’s check.
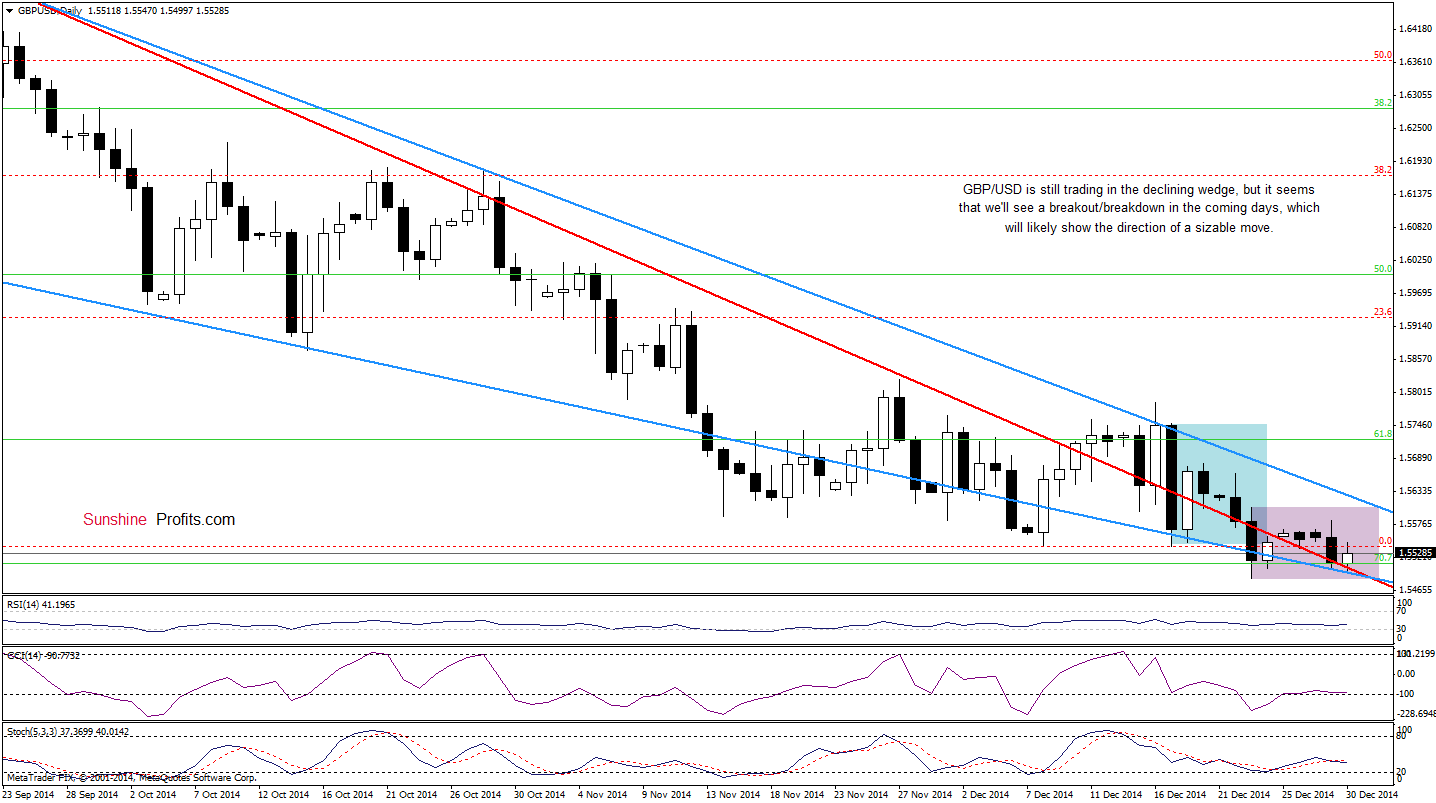
From this perspective, we see that although GBP/USD declined and broke below the lower border of the declining wedge in the previous week, this deterioration was only temporary. As you see, currency bulls pushed the pair higher on the following trading day, which resulted in an invalidation of the breakdown. This is a positive signal, which suggests further improvement, but we think that as long as the exchange rate is trading in a consolidation (marked with purple) inside of the declining wedge a sizable upward/downward move is not likely to be seen. In our opinion, if currency bulls win, we could see an upward move to (at least) 1.5748, where the Dec 17 high (the upper line of the previous consolidation) is. On the other hand, if they fail, and the pair drops lower, GBP/USD could decline to around 1.5326-1.5376, where the support zone created by the 76.4% and 78.6% Fibonacci retracement levels (based on the entire Jul 2013-Jul 2014 rally) is. Which scenario is more likely? Looking only on the current position of the indicators (not only daily, but also weekly), it seems to us that a trend reversal and higher values of GBP/USD are just around the corner.
Very short-term outlook: mixed
Short-term outlook: mixed
MT outlook: mixed
LT outlook: mixed
Trading position (short-term): In our opinion, no positions are justified from the risk/reward perspective at the moment. We will keep you informed should anything change, or should we see a confirmation/invalidation of the above.
USD/JPY
In our last commentary on this currency pair, w wrote the following:
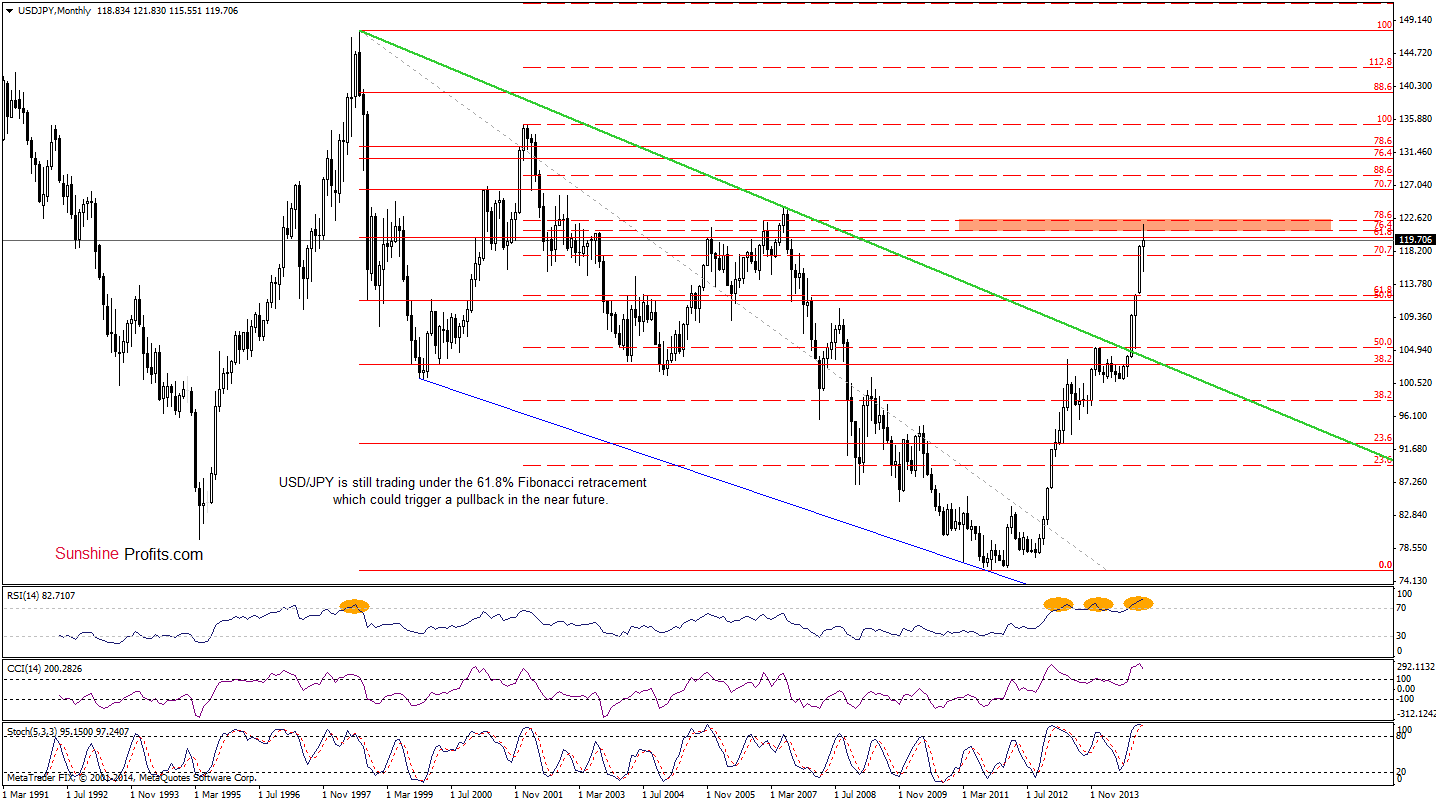
(…) USD/JPY is on its track to our upside target. Nevertheless, when we take a closer look at the current position of the indicators, we see that the Stochastic Oscillator is extremely overbought, which suggests that we could see a pullback from here in the coming days. Additionally, this scenario is also reinforced by the long-term picture (…) with the recent very short-term upward move USD/JPY came back to the previously-broken 61.8% Fibonacci retracement, which could pause further improvement in the near future.
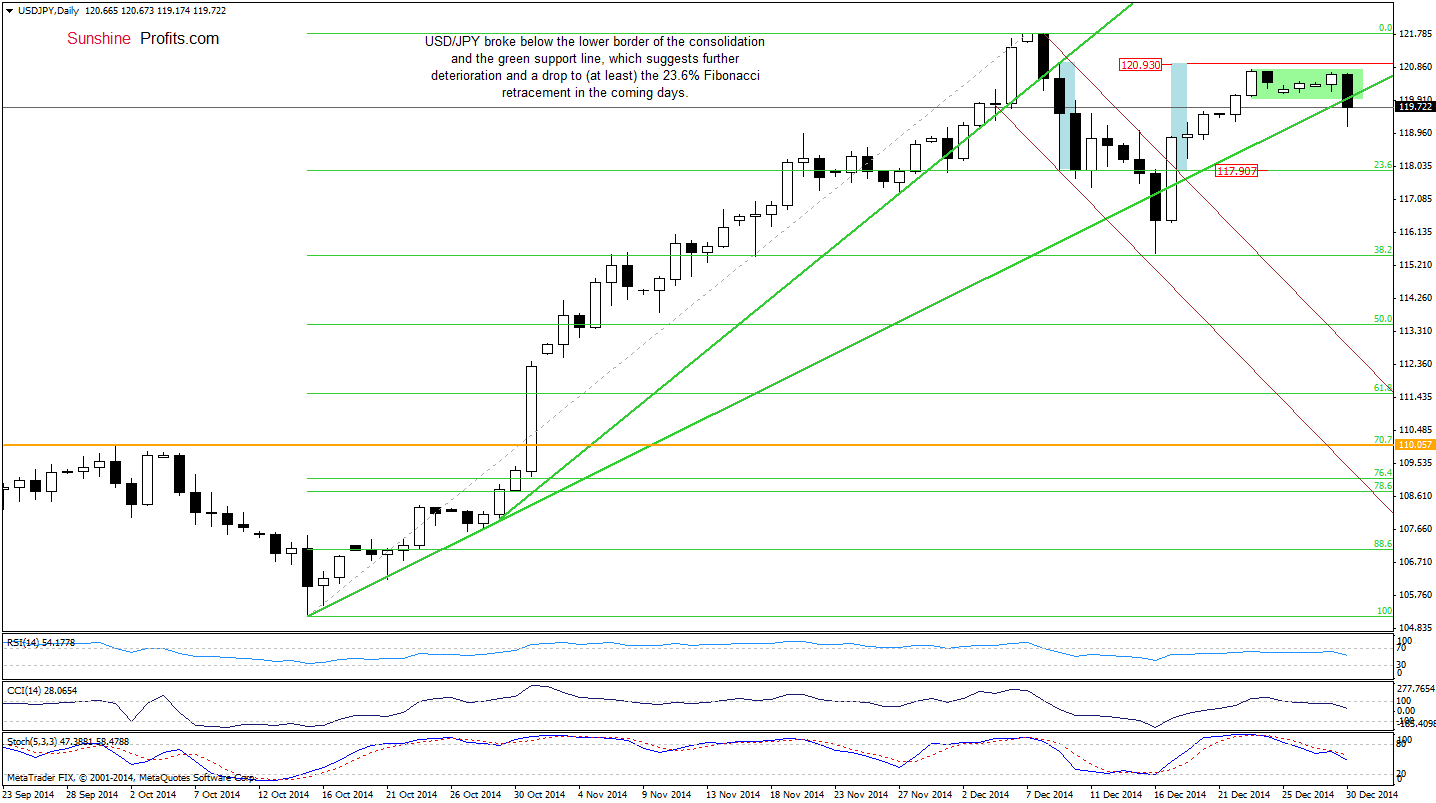
Looking at the above charts, we see that the situation developed in line with the above-mentioned scenario and USD/JPY moved sharply lower earlier today. With this drop, the pair also broke below the lower border of the consolidation and the green support line, which suggests further deterioration in the coming days. If this is the case, and the exchange rate closes the day under these levels, we’ll see a decline to (at least) 117.90, where the 23.6% Fibonacci retracement (based on the entire Oct-Dec rally) is. Please note that the current position of the indicators supports the bearish case.
Very short-term outlook: mixed with bearish bias
Short-term outlook: mixed with bearish bias
MT outlook: mixed
LT outlook: bullish
Trading position (short-term; our opinion): No positions are justified from the risk/reward perspective at the moment. We will keep you informed should anything change, or should we see a confirmation/invalidation of the above.
Thank you.
Nadia Simmons
Forex & Oil Trading Strategist
Przemyslaw Radomski, CFA
Founder, Editor-in-chief
Gold & Silver Trading Alerts
Forex Trading Alerts
Oil Investment Updates
Oil Trading Alerts
