
Earlier today, official data showed that although U.K. gross domestic product rose 0.7% in the third quarter, it was down from a 0.8% growth rate in the three months to June. Additionally, year-on-year, the U.K. economy didn’t change from the second quarter's revised rate, which pushed GBP/USD to a fresh 2014 low against the greenback. Did this drop change anything in the short-term picture?
In our opinion the following forex trading positions are justified - summary:
EUR/USD
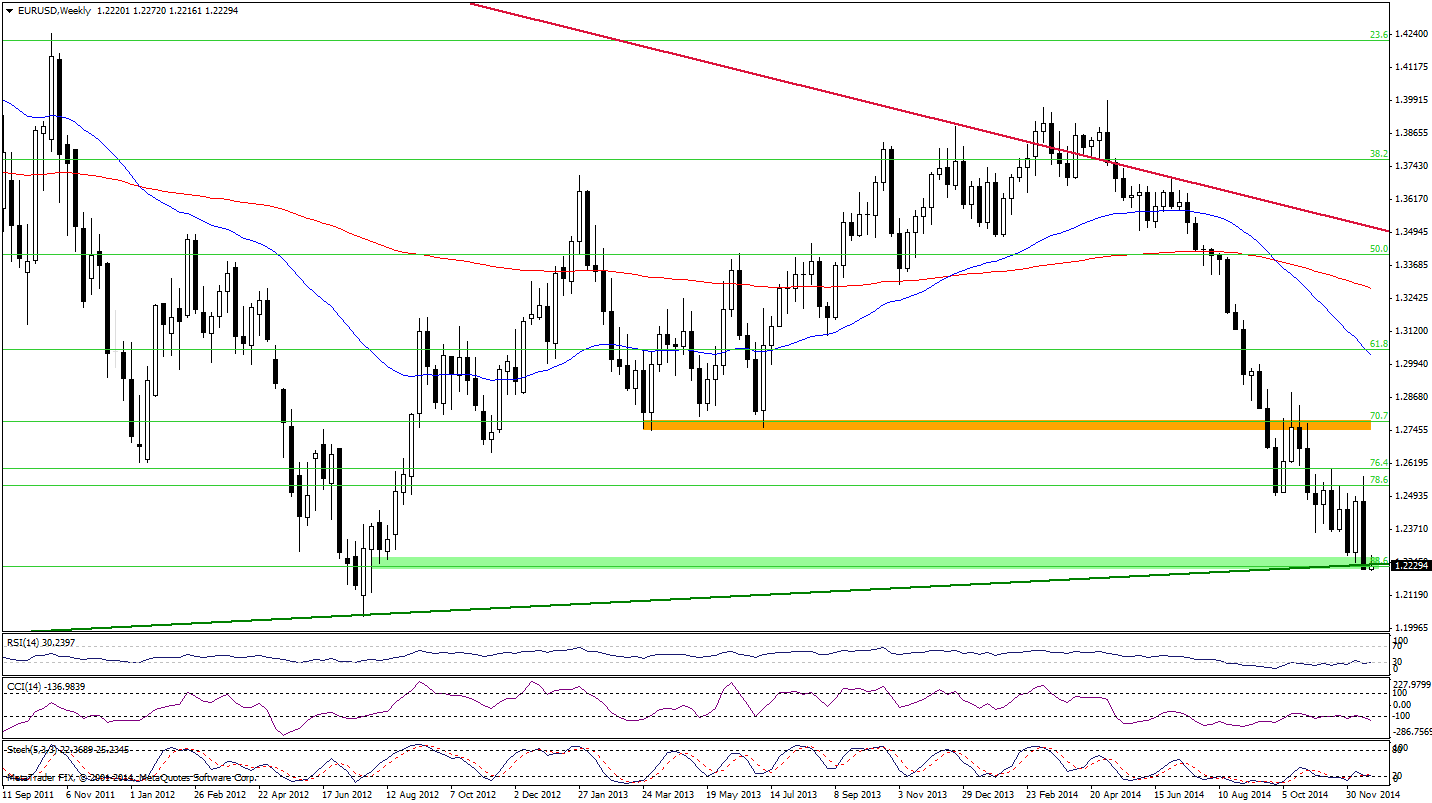
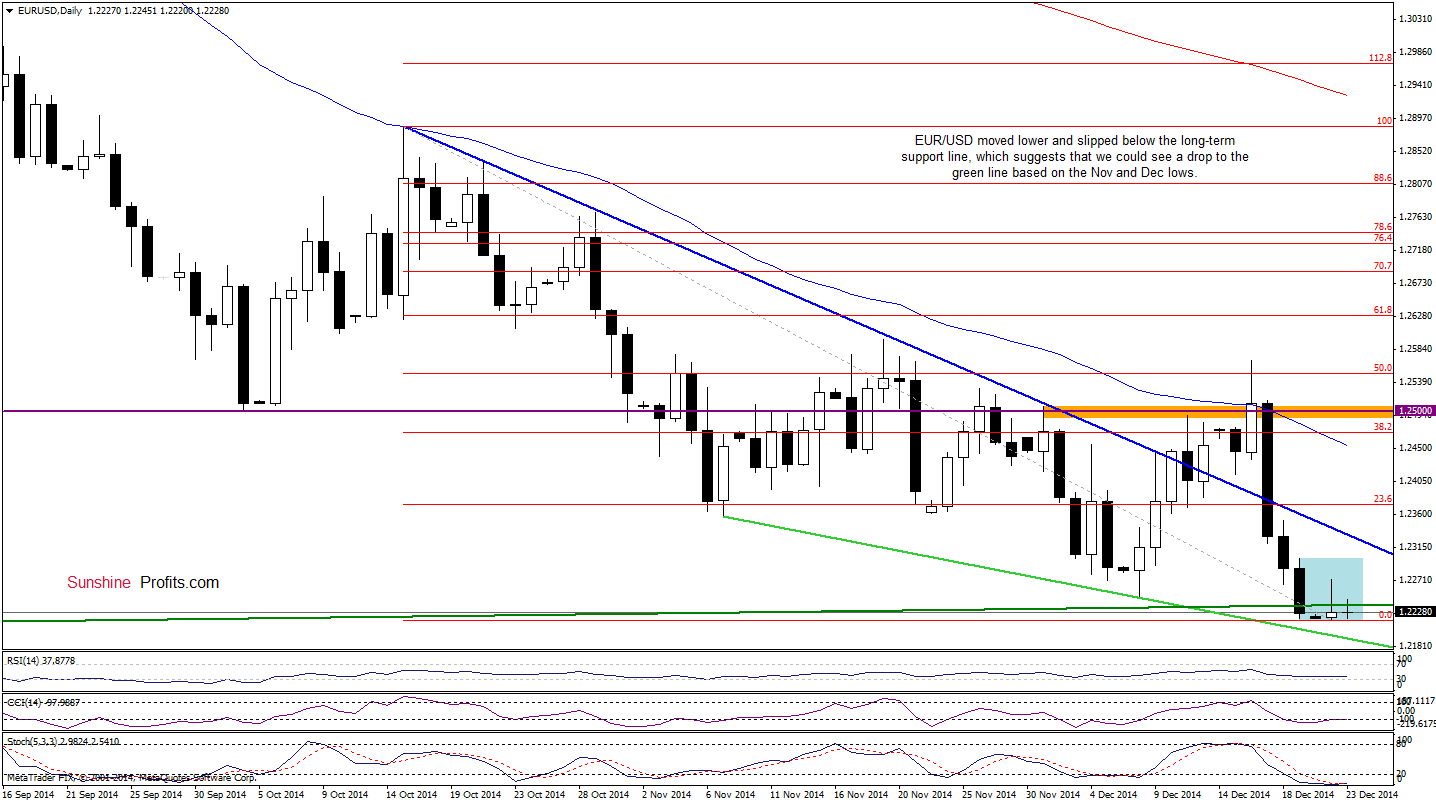
Looking at the above charts, we see that although EUR/USD rebounded yesterday, this improvement was only temporarily and the pair rversed, slipping below the long-term support line and the 88.6% Fibonacci retracement. Earlier today, this negative signal triggered another drop, which approached the pair to the recent low. All the above provides us with bearish implications and suggests that we could see a pullback to the green support line based on the Nov and Dec lows in the coming day.
Very short-term outlook: mixed with bearish bias
Short-term outlook: mixed with bullish bias
MT outlook: mixed
LT outlook: bearish
Trading position (short-term): In our opinion, no positions are justified from the risk/reward perspective at the moment. We will keep you informed should anything change, or should we see a confirmation/invalidation of the above.
GBP/USD
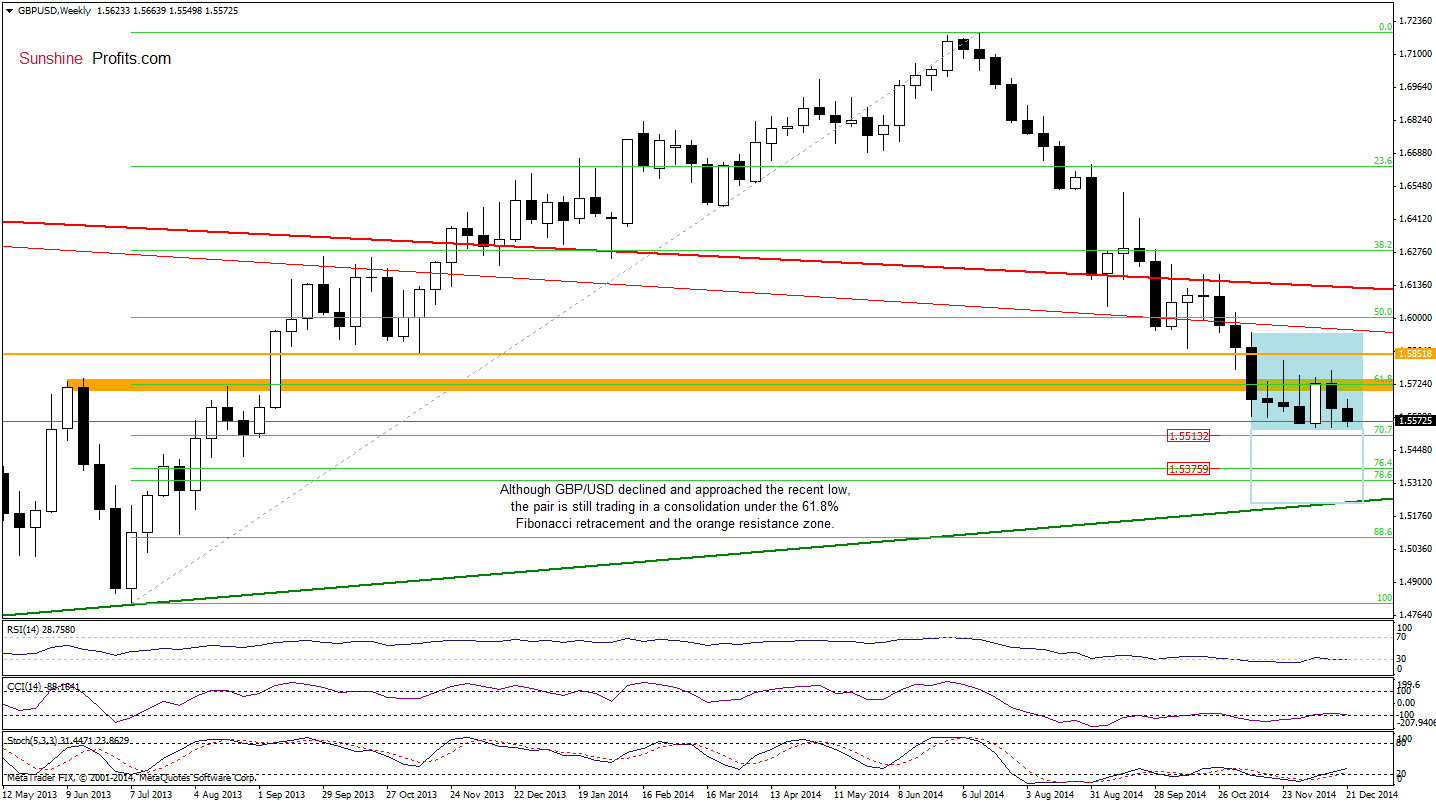
The medium-term outlook hasn’t changed much since our last commentary on this currency pair was posted. As you see GBP/USD is still trading in the consolidation under the previously-broken 61.8% Fibonacci retracement and the orange resistance zone. Taking this fact into account, we believe that a breakout above the upper line of the formation (or a breakdown below the 70.7% Fibonacci retracement) will show us the direction of future moves.
What can we infer from the daily chart? Let’s check.
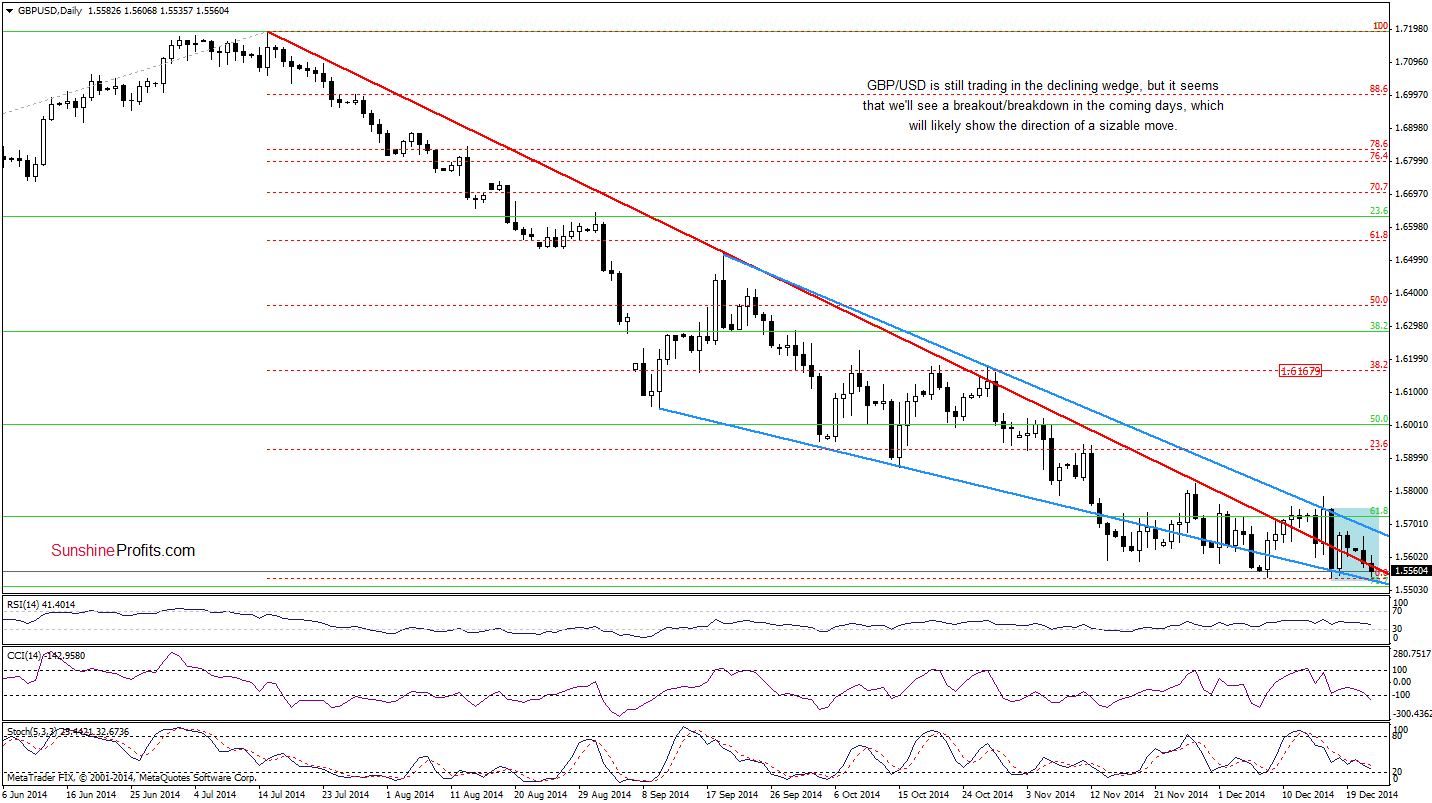
From this perspective, we see that although GBP/USD moved lower earlier today, hitting a fresh multi-month low, the pair is still trading in a consolidation between the upper and lower border of the declining wedge. Therefore, what we wrote on Friday is up-to-date:
(...) we believe that a breakout/breakdown will be a strong buy/sell signal, which will trigger a sizable upward/downward move. If currency bulls win, we could see an upward move to (at least) the 38.2% Fibonacci retracement based on the entire Jul-Dec decline (around 1.6167). If they fail, and the pair drops below the 70.7% Fibonacci retracement, GBP/USD could decline to around 1.5235, where the green long-term support line (marked on the weekly chart) is.
Very short-term outlook: mixed
Short-term outlook: mixed
MT outlook: mixed
LT outlook: mixed
Trading position (short-term): In our opinion, no positions are justified from the risk/reward perspective at the moment. We will keep you informed should anything change, or should we see a confirmation/invalidation of the above.
USD/JPY
Quoting our Friday’s Forex Trading Alert:
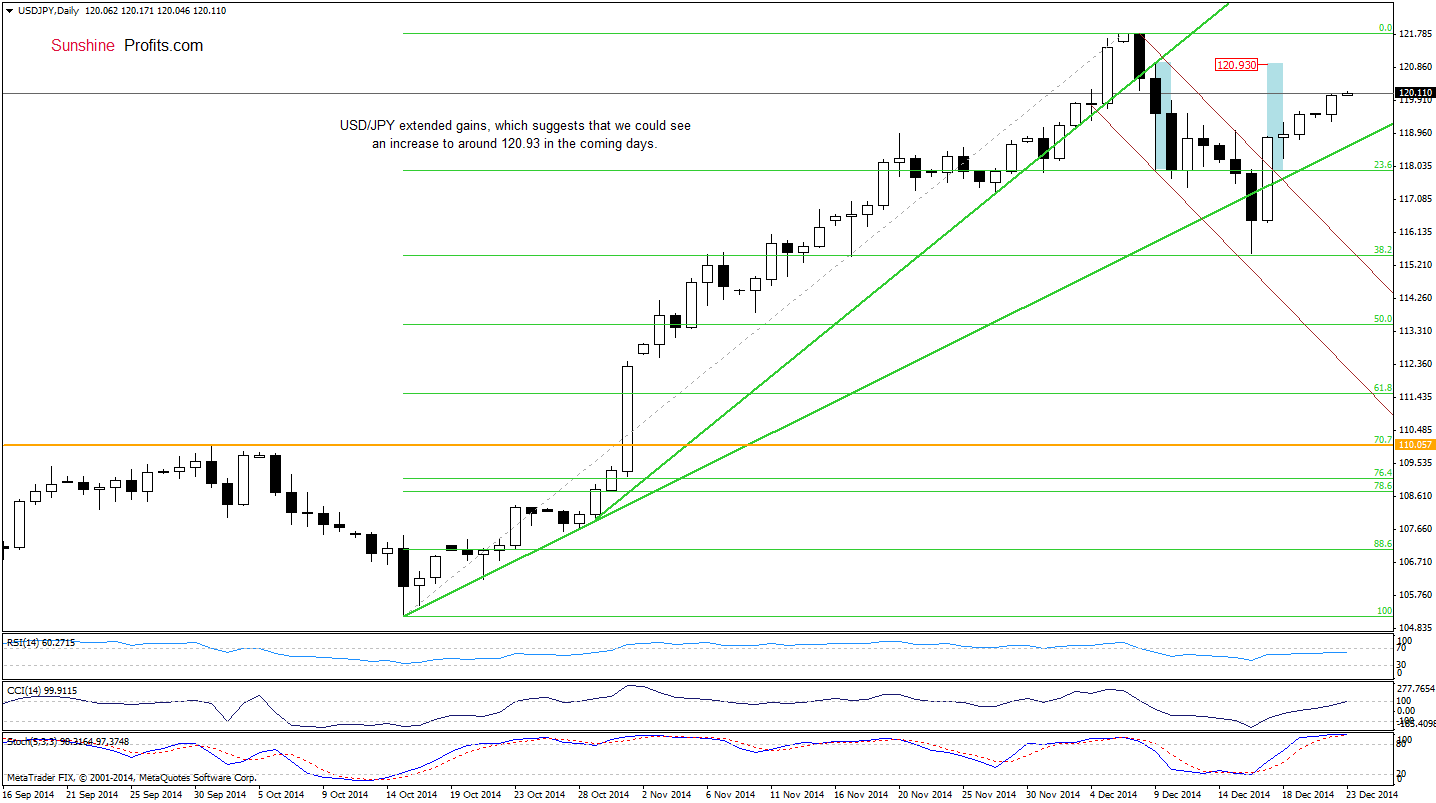
(…) the pair invalidated a breakdown below the green support line, which accelerated further improvement. Additionally, this sharp comeback took USD/JPY above the upper line of the declining trend channel (marked with brown), which suggests that we’ll see higher values of the exchange rate. If this is the case, the initial upside target would be around 120.93, where the size of the upswing will correspond to the height of the trend channel.
Looking at the daily chart, wee that currency bulls pushed the exchange rate higher as we expected and USD/JPY is on its track to our upside target. Nevertheless, when we take a closer look at the current position of the indicators, we see that the Stochastic Oscillator is extremely overbought, which suggests that we could see a pullback from here in the coming days. Additionally, this scenario is also reinforced by the long-term picture.
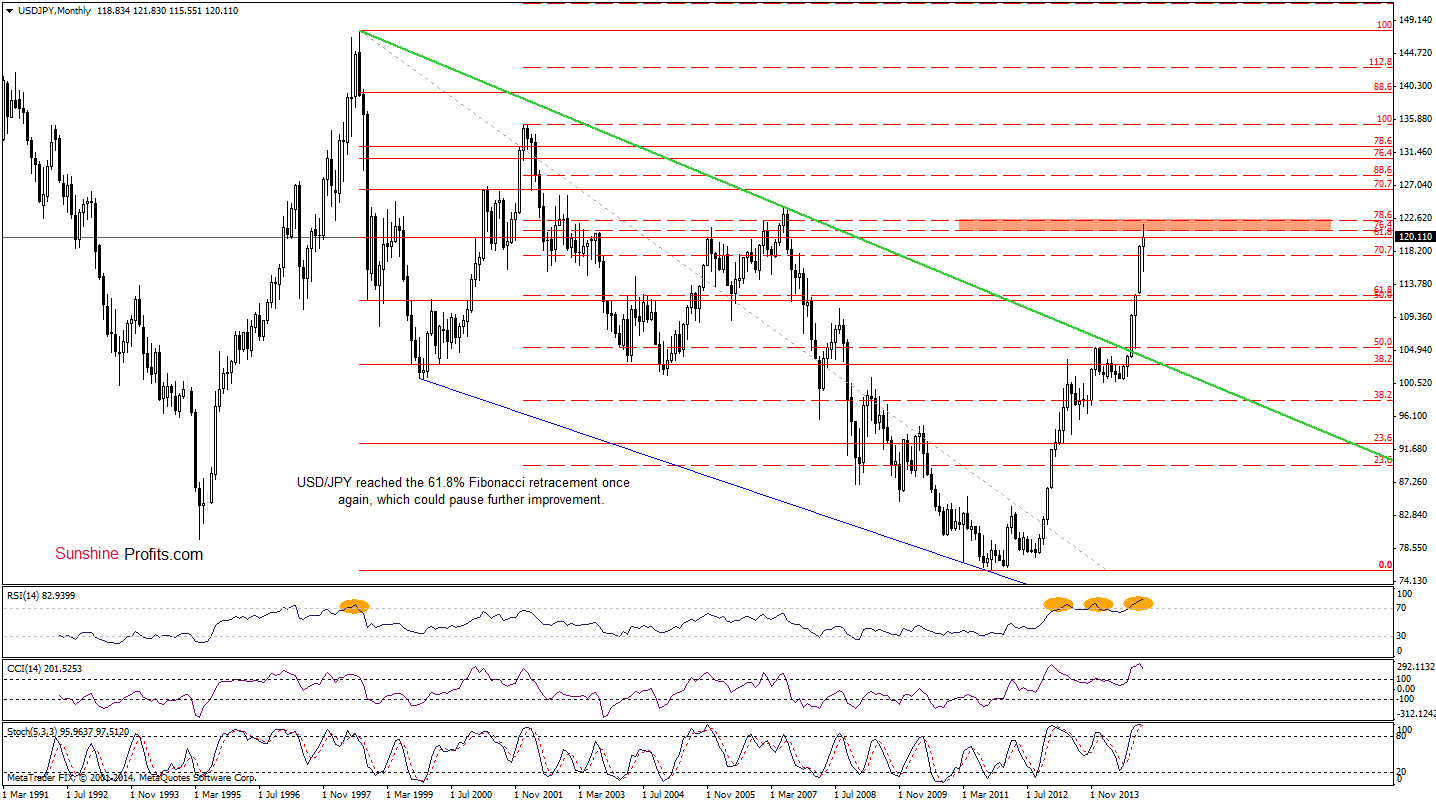
On the above chart, we see that with the recent very short-term upward move USD/JPY came back to the previously-broken 61.8% Fibonacci retracement, which could pause further improvement in the near future.
Very short-term outlook: mixed
Short-term outlook: mixed
MT outlook: mixed
LT outlook: bullish
Trading position (short-term; our opinion): No positions are justified from the risk/reward perspective at the moment. We will keep you informed should anything change, or should we see a confirmation/invalidation of the above.
Thank you.
Nadia Simmons
Forex & Oil Trading Strategist
Forex Trading Alerts
Oil Investment Updates
Oil Trading Alerts

