

Forex Trading Alert originally sent to subscribers on October 27, 2015, 10:33 AM.
Although today’s data showed that core durable goods orders (without volatile transportation items) declined by 0.4% in Sept, the U.S. dollar moved higher against its Canadian counterpart as dropping oil prices affected negatively the commodity-linked Canadian currency. Where will USD/CAD head next in the coming days?
In our opinion the following forex trading positions are justified - summary:
- EUR/USD: short (a stop-loss order at 1.1887; the downside target around 1.0938)
- GBP/USD: none
- USD/JPY: none
- USD/CAD: none
- USD/CHF: none
- AUD/USD: none
EUR/USD
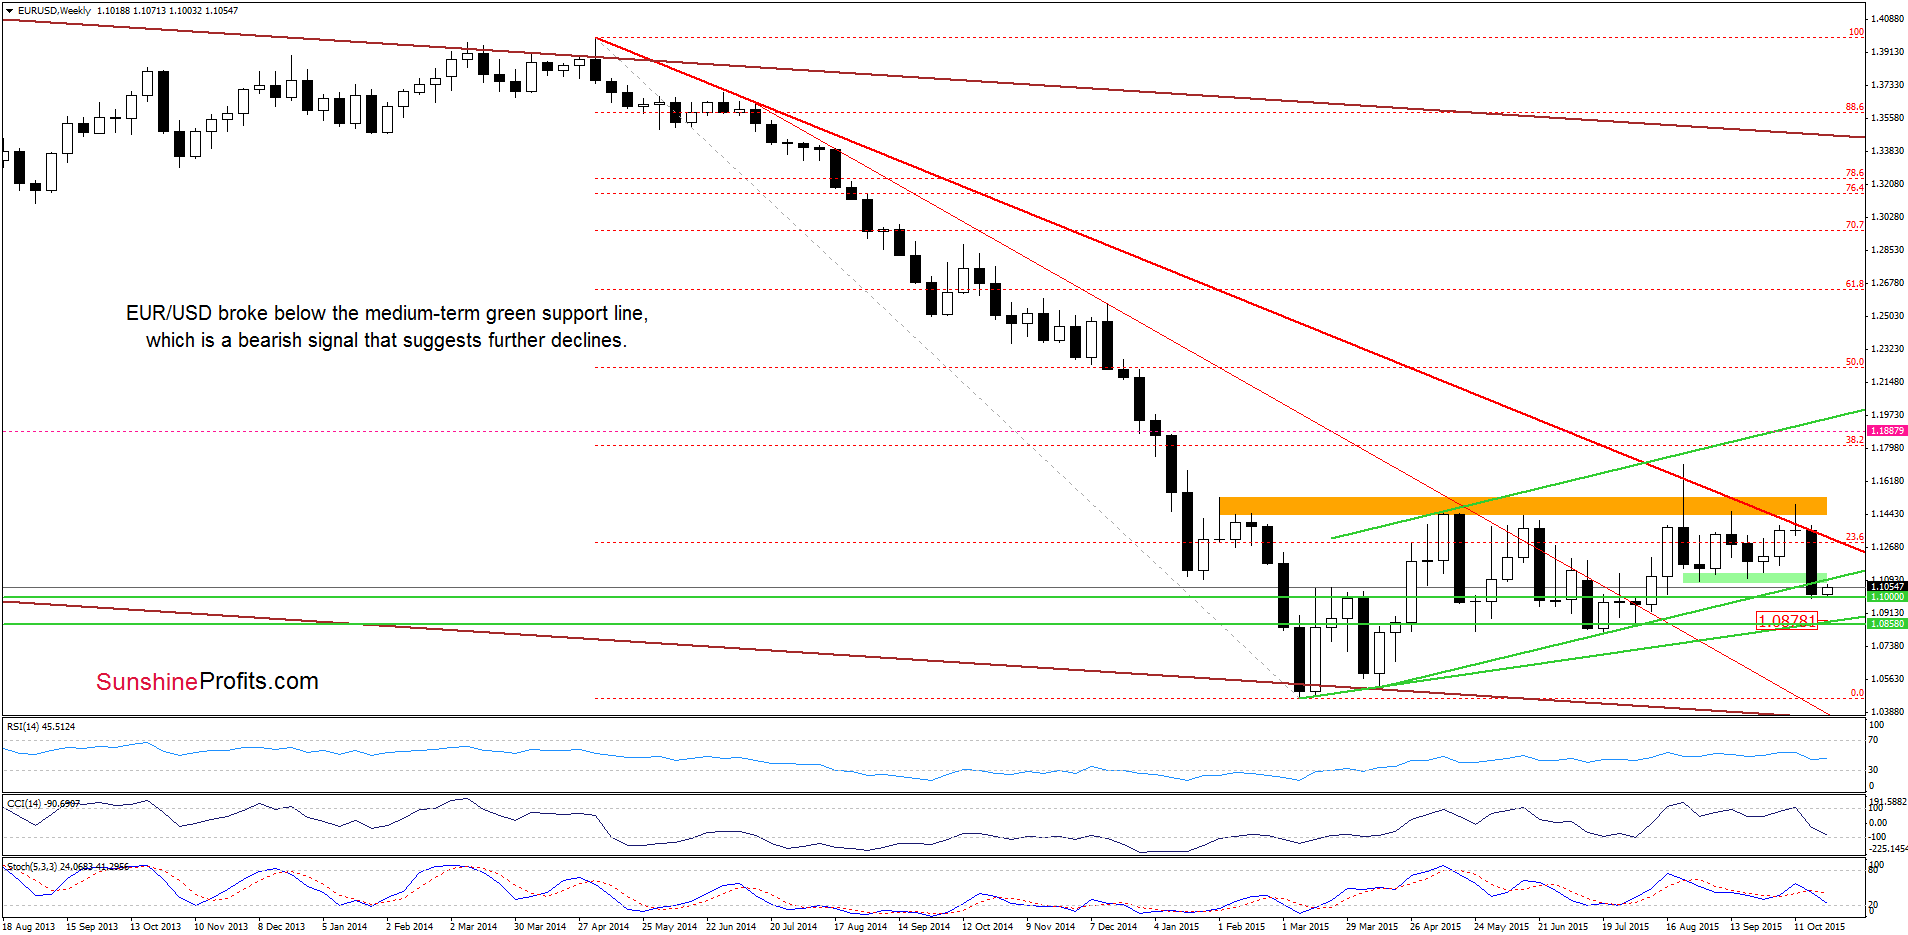
The situation in the medium term remains almost unchanged as EUR/USD remains under the previously-broken key support zone (marked with green). This is a bearish signal, which suggests that we may see a decline even to around 1.0878, where the long-term green support line (based on the Apr, Jul and Aug lows) is.
What can we infer from the daily hart? Let’s check.
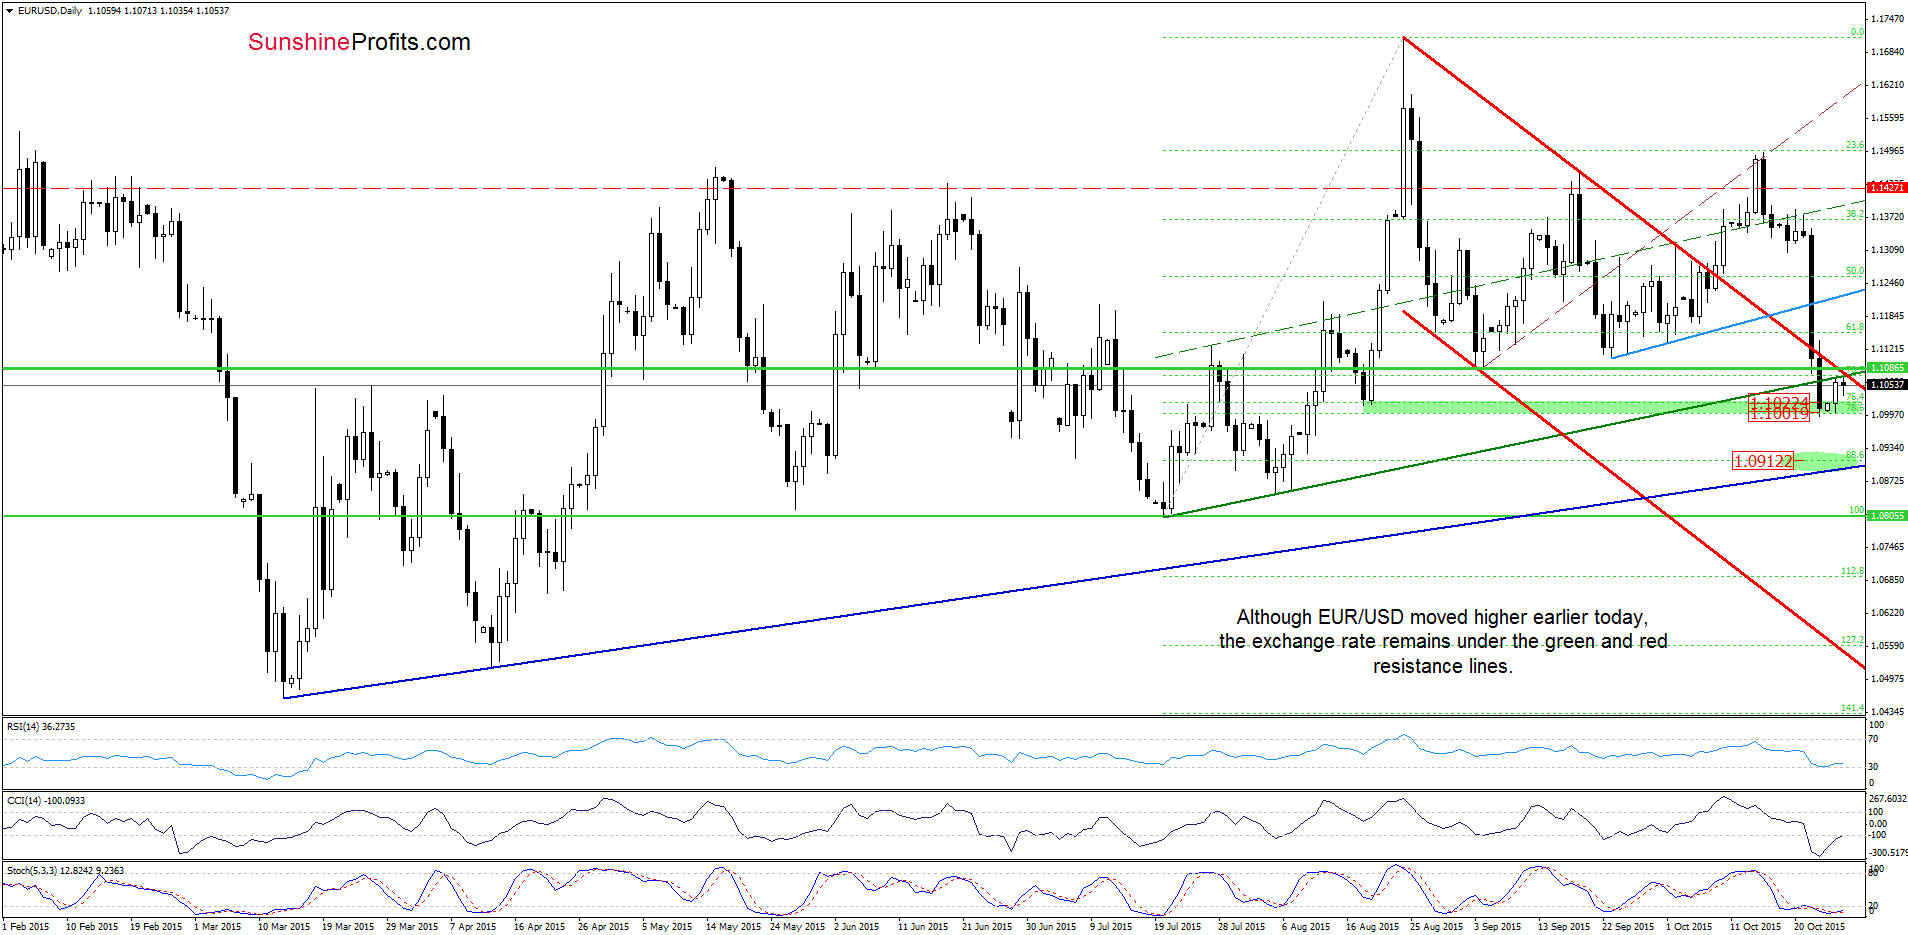
Earlier today, EUR/USD moved higher and climbed to the previously-broken medium-term green line and the upper border of the red declining trend channel. Despite this increase, currency bulls didn’t manage to push the pair higher, which suggests that today’s move might be nothing more than a verification of earlier breakdown. If this is the case, and the exchange rate declines from here, it would be another bearish signal, which will likely trigger another downswing and a test of the recent lows. If this support is broken, and EUR/USD extends losses, breaking below the Friday’s low of 1.0996, the next downside target for currency bears would be around 1.0912, where the 88.6% Fibonacci retracement and the long-term navy blue support line are (marked with the green ellipse on the chart).
Very short-term outlook: bearish
Short-term outlook: bearish
MT outlook: mixed with bearish bias
LT outlook: mixed
Trading position (short-term; our opinion): Short positions (which are already profitable as we entered them when EUR/USD was at about 1.1427) with a stop-loss order at 1.1887 are justified from the risk/reward perspective. We will keep you informed should anything change, or should we see a confirmation/invalidation of the above.
USD/JPY
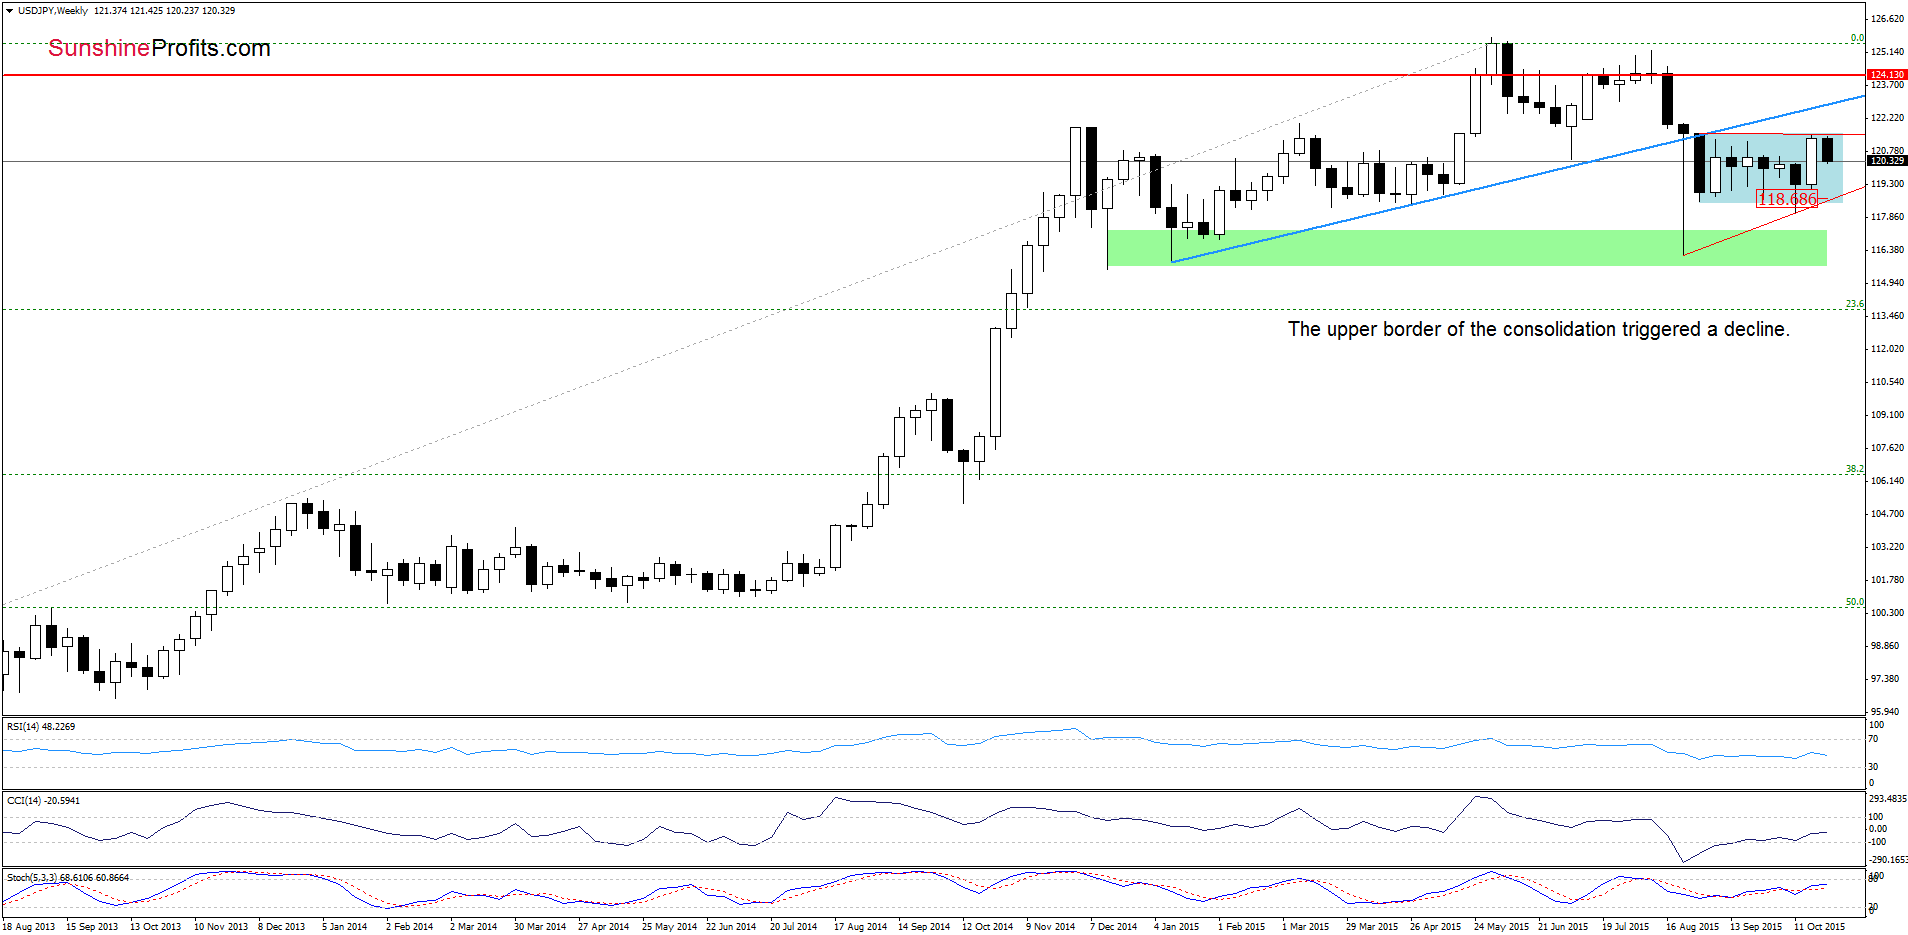
Looking at the weekly chart we see that USD/JPY climbed to the upper border of the consolidation, which encouraged currency bears to act. As a result, the pair reversed and gave up some gains.
What impact did this move have on the very short-term chart? Let’s check.
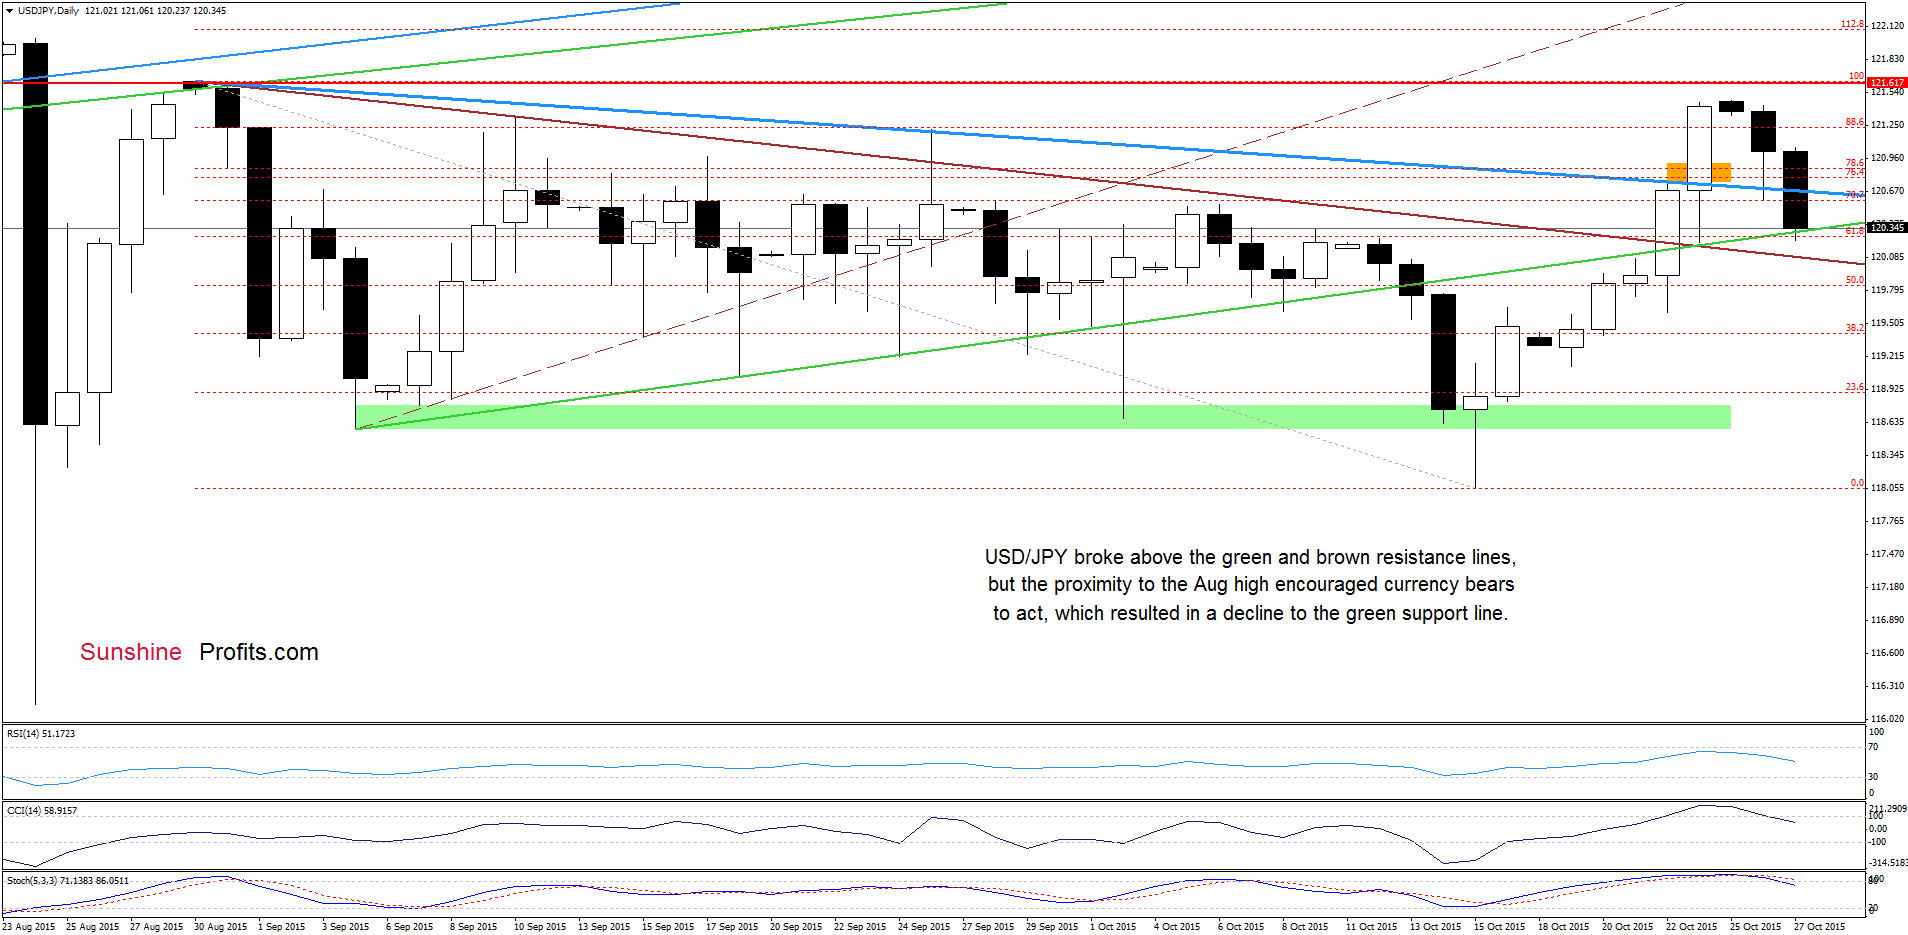
On Friday, we wrote:
(…) the combination of the blue resistance line and the orange resistance zone (created by the 76.4% and 78.6% Fibonacci retracement levels) triggered a pullback earlier today. With this downswing the exchange rate slipped to the previously-broken lines, which suggests that we could see a rebound from here (…). Nevertheless, the current position of the indicators suggests that reversal and lower values of the exchange rate in the coming week should not surprise us.
From today’s point of view we see that the situation developed in line with the above scenario and USD/JPY declined after an increase above the orange resistance zone. As you see on the chart, the proximity to the Aug high encouraged currency bears to act, which resulted in a drop to the previously-broken green line. Although the pair could rebound from here (and test the recent high), the current position of the indicators (the CCI and Stochastic Oscillator generated sell signals) suggests that lower values of the exchange rate are just around the corner.
Very short-term outlook: mixed
Short-term outlook: mixed
MT outlook: mixed
LT outlook: mixed
Trading position (short-term; our opinion): No positions are justified from the risk/reward perspective at the moment. We will keep you informed should anything change, or should we see a confirmation/invalidation of the above.
USD/CAD
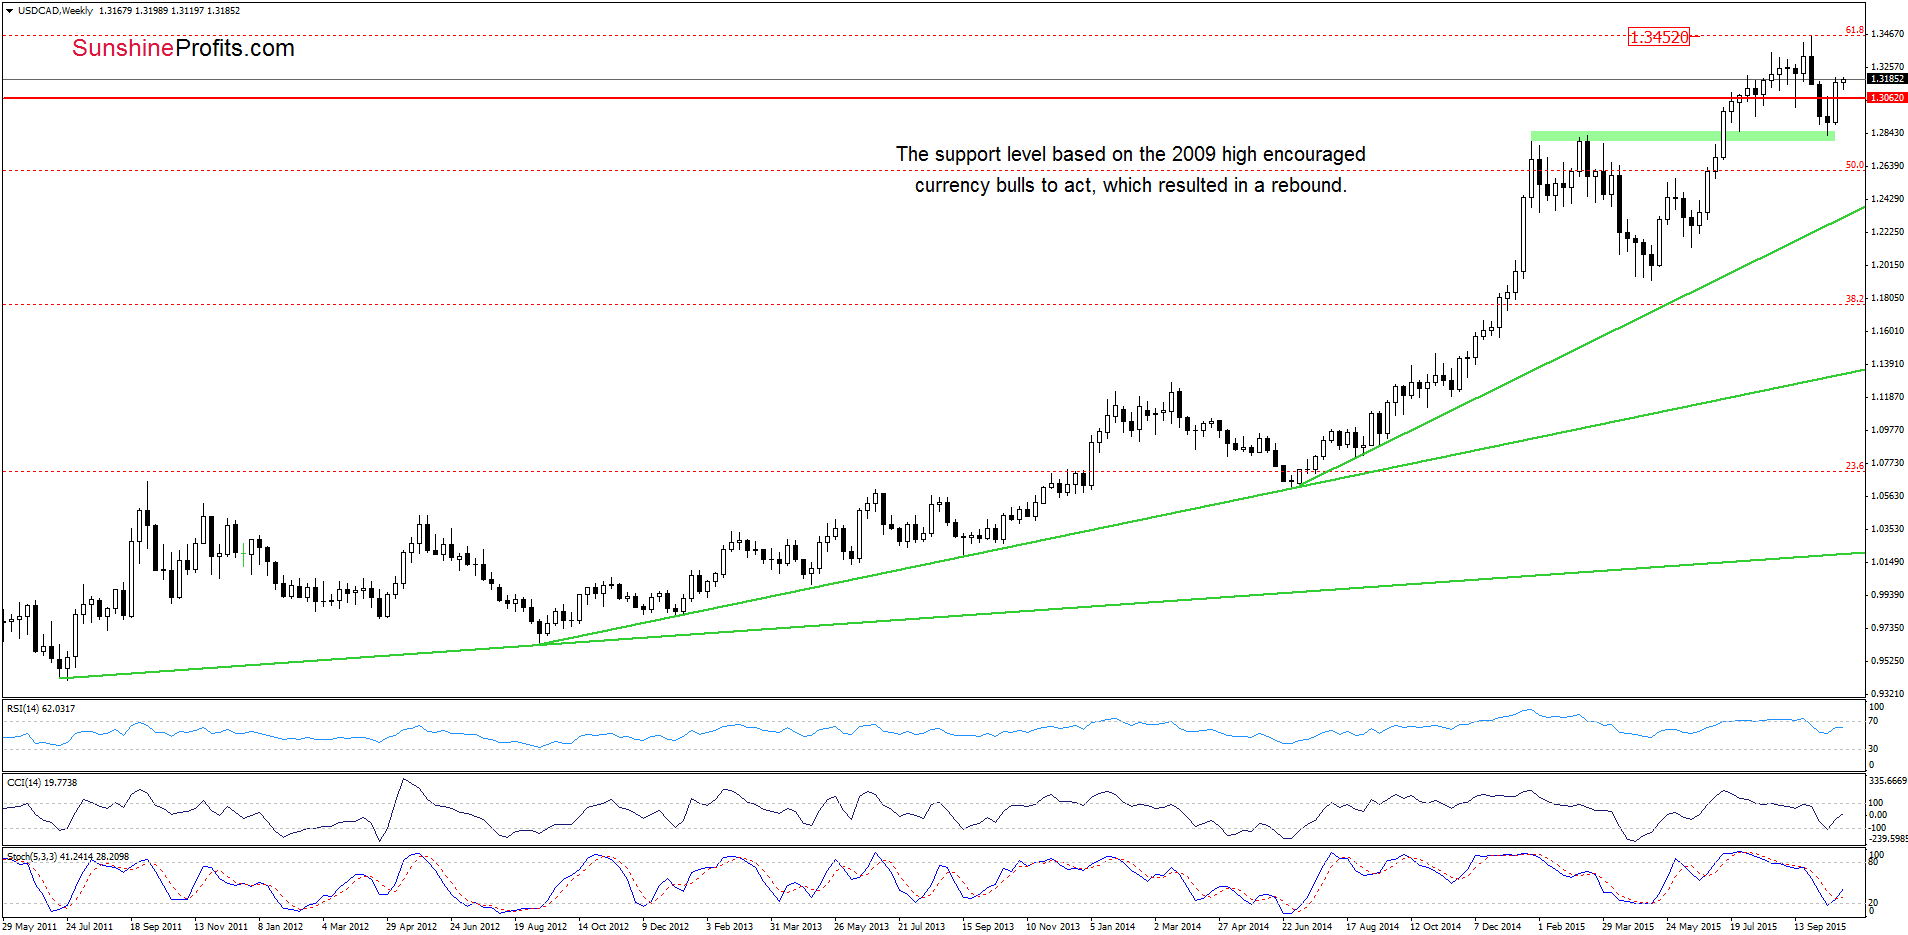
Quoting our Friday’s Forex Trading Alert:
USD/CAD moved little lowed and slipped to the previously-broken 2009 high, which could encourage currency bulls to act.
As you see on the weekly chart the situation developed in tune with the above scenario and USD/CAD rebounded, increasing to the last week’s high.
How did this move affect the daily chart? Let’s check.
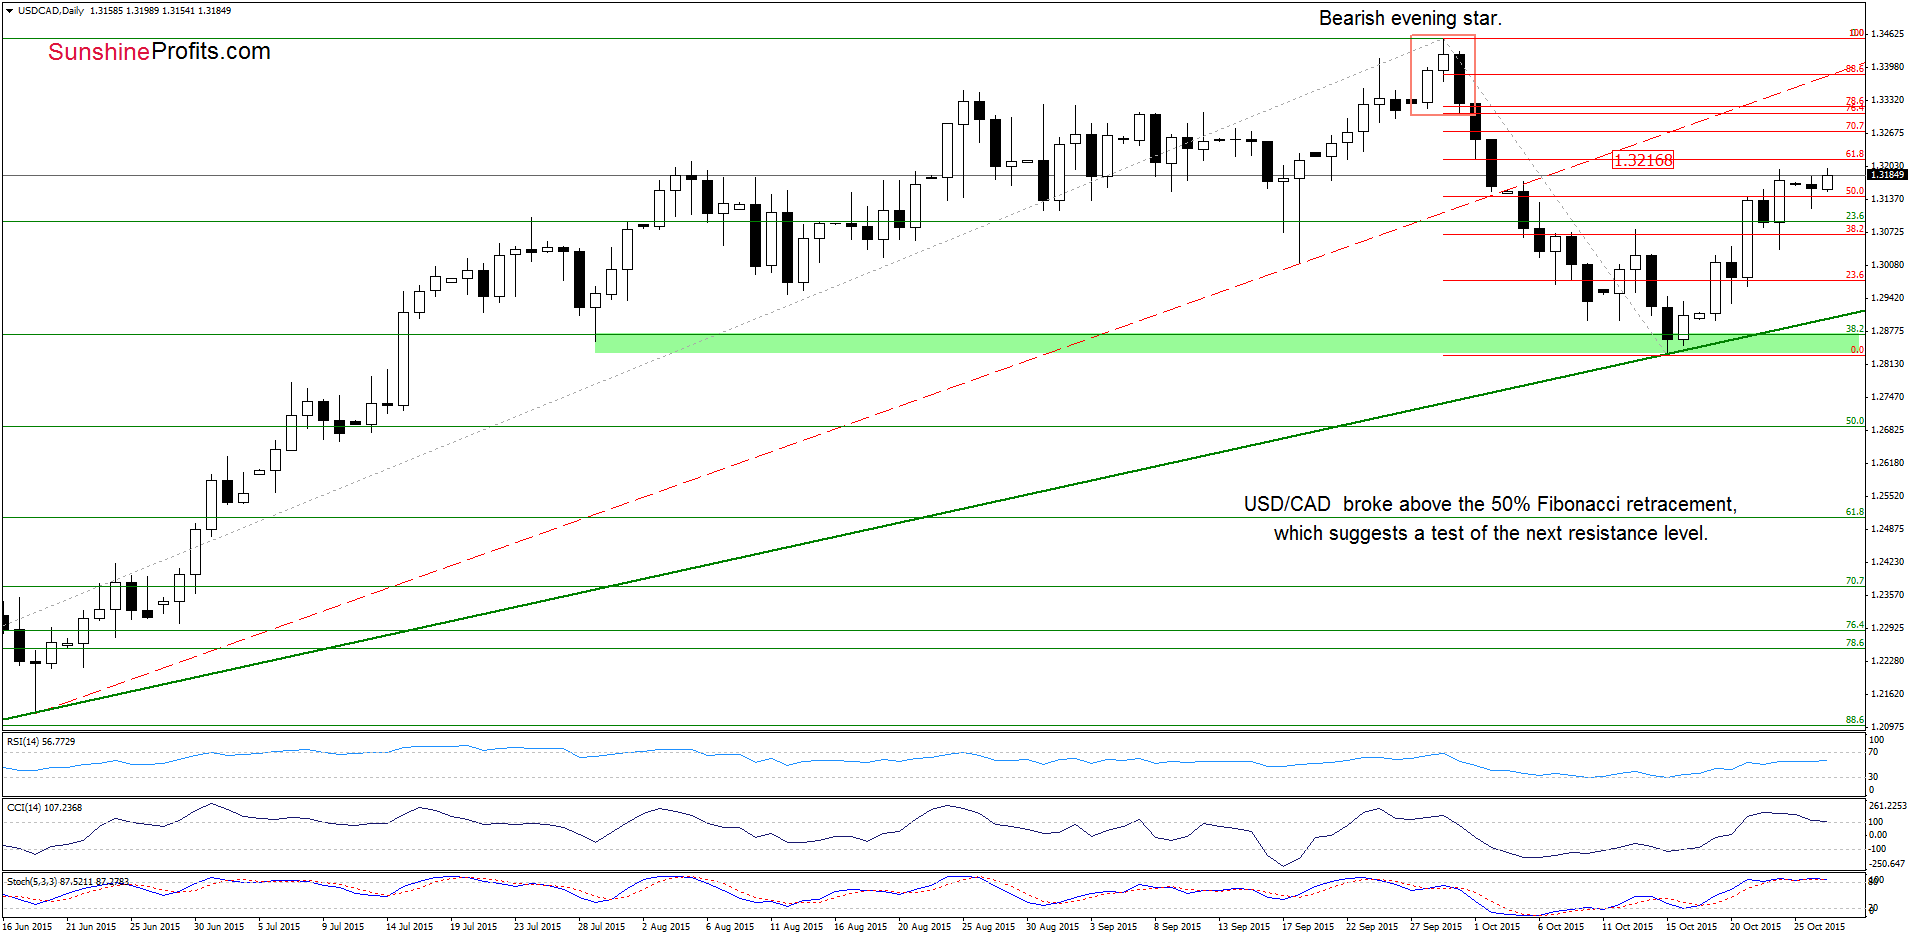
Looking at the chart, we see that although USD/CAD gave up some gains, the pair reversed and climbed to the Friday’s high, invalidating earlier breakdown under the 50% Fibonacci retracement. This is a positive signal, which suggests a test of the next resistance level (around 1.3217) in the coming days. If the 61.8% Fibonacci retracement is broken, we may see a rally to the barrier of 1.3300 or even to 1.3308-1.3321, where the resistance zone (created by the 76.4% and 78.6% Fibonacci retracement levels) is.
Very short-term outlook: mixed with bullish bias
Short-term outlook: mixed
MT outlook: mixed
LT outlook: mixed
Trading position (short-term; our opinion): No positions are justified from the risk/reward perspective at the moment. We will keep you informed should anything change, or should we see a confirmation/invalidation of the above.
Thank you.
Nadia Simmons
Forex & Oil Trading Strategist
Przemyslaw Radomski, CFA
Founder, Editor-in-chief
Gold & Silver Trading Alerts
Forex Trading Alerts
Oil Investment Updates
Oil Trading Alerts
