

Forex Trading Alert originally sent to subscribers on March 10, 2016, 7:38 AM.
Earlier today, the euro declined against the U.S. dollar once again as uncertainty around today’s ECB decisions continues to weight on the European currency. Thanks to these circumstances, EUR/USD dropped under the barrier of 1.1000. Will we see a test of the recent lows in the coming days?
In our opinion the following forex trading positions are justified - summary:
- EUR/USD: short (stop-loss order at 1.1512; initial downside target at 1.0572)
- GBP/USD: none
- USD/JPY: none
- USD/CAD: none
- USD/CHF: none
- AUD/USD: none
EUR/USD
Quoting our previous alert:
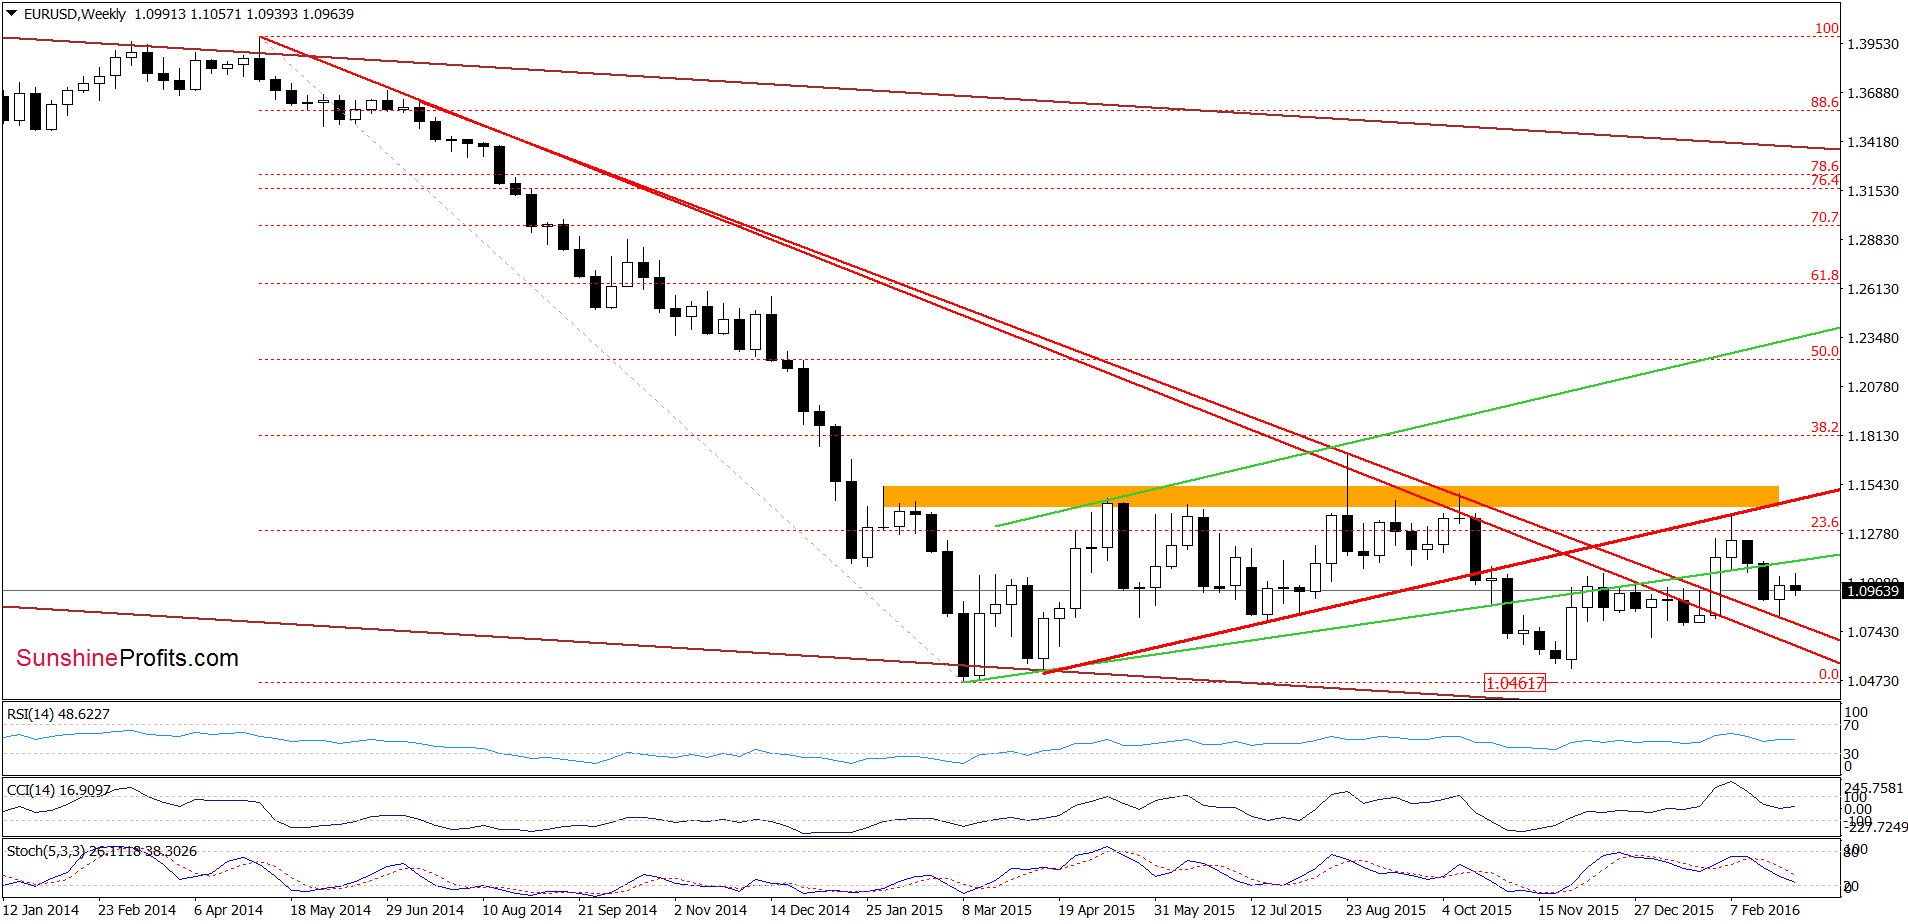
(…) the orange resistance zone (created by the 38.2% Fibonacci retracement and the horizontal resistance line based on the mid-Dec highs) continues to keep gains in check. Taking this fact into account, and combining it with the current position of the Stochastic Oscillator (the indicator is very lose to generating a sell signal), we think that reversal is just around the corner.
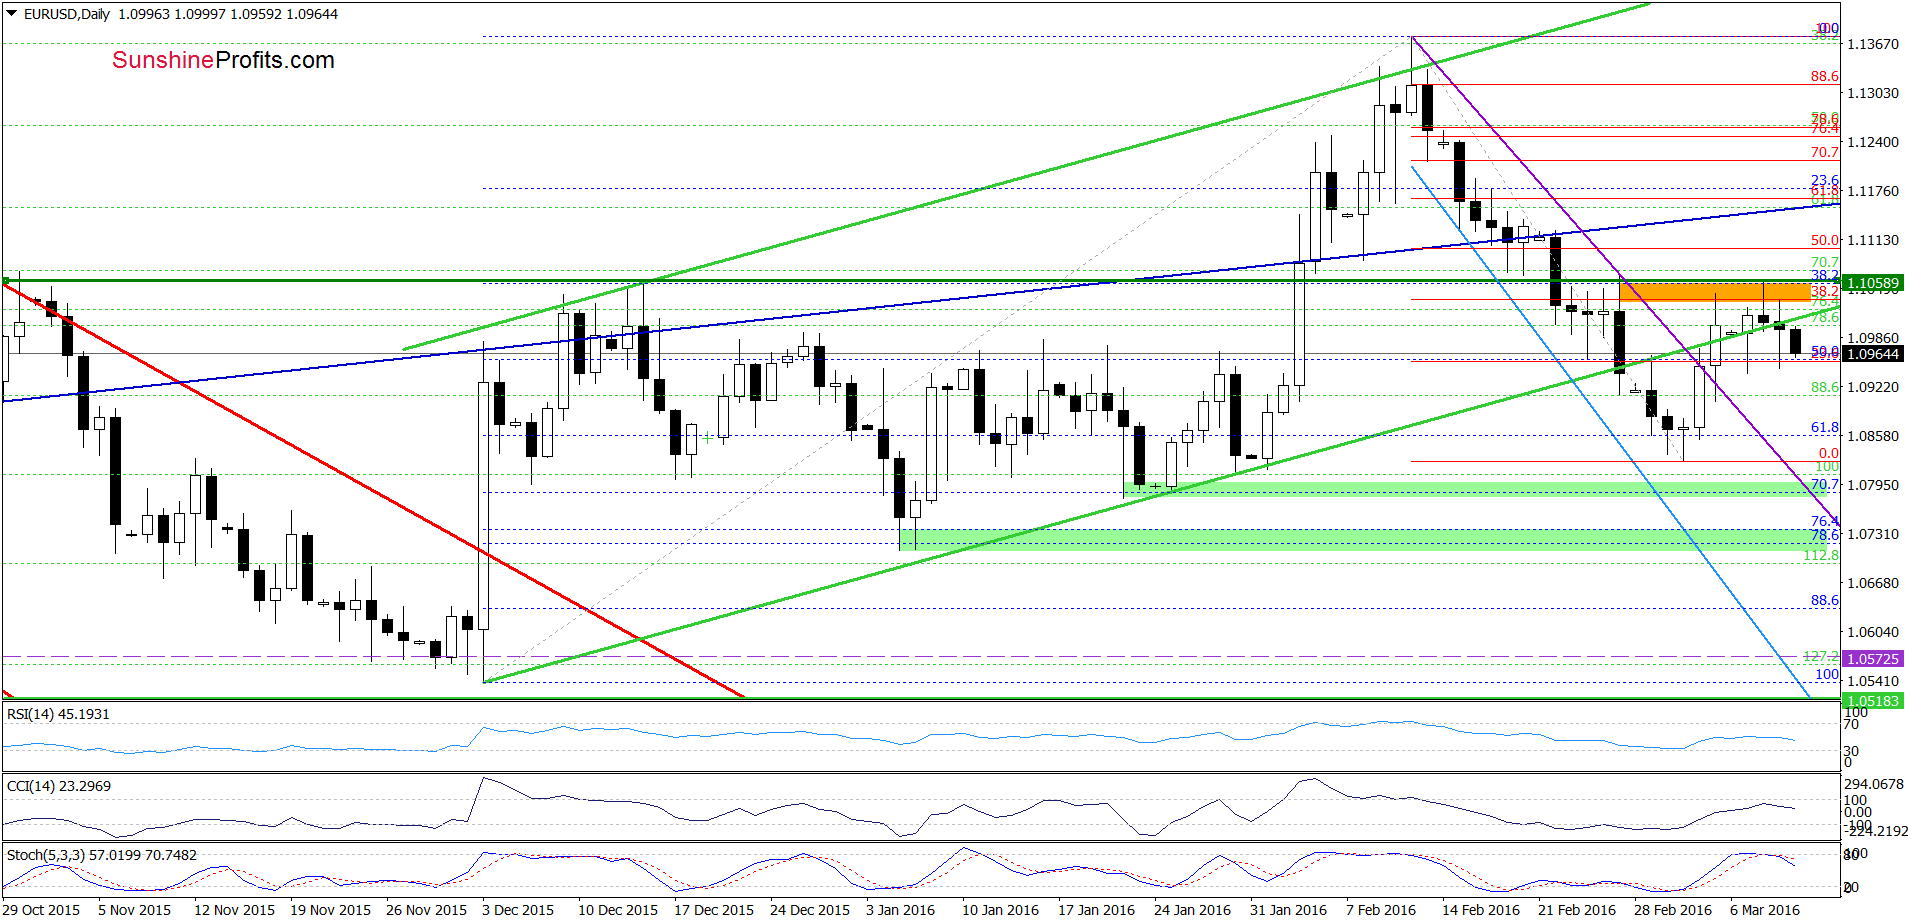
Looking at the daily chart, we see that the situation developed in line with the above scenario and EUR/USD moved lower. With today’s downswing, the pair slipped under the previously-broken lower border of the green rising trend channel, which suggests further deterioration – especially when we factor in a sell signal generated by the Stochastic Oscillator.
Finishing today’s commentary on this currency pair, please note that most market participants expect the European Central Bank to announce fresh measures to fight deflation in the euro zone. If ECB cuts interest rates further (divergence in monetary policies) and intensify its asset purchase program, we could see a sharp drop in EUR/USD later in the day.
Very short-term outlook: bearish
Short-term outlook: bearish
MT outlook: mixed with bearish bias
LT outlook: mixed
Trading position (short-term; our opinion): Short positions (with a stop-loss order at 1.1512 and the initial downside target at 1.0572) are justified from the risk/reward perspective. We will keep you informed should anything change, or should we see a confirmation/invalidation of the above.
GBP/USD
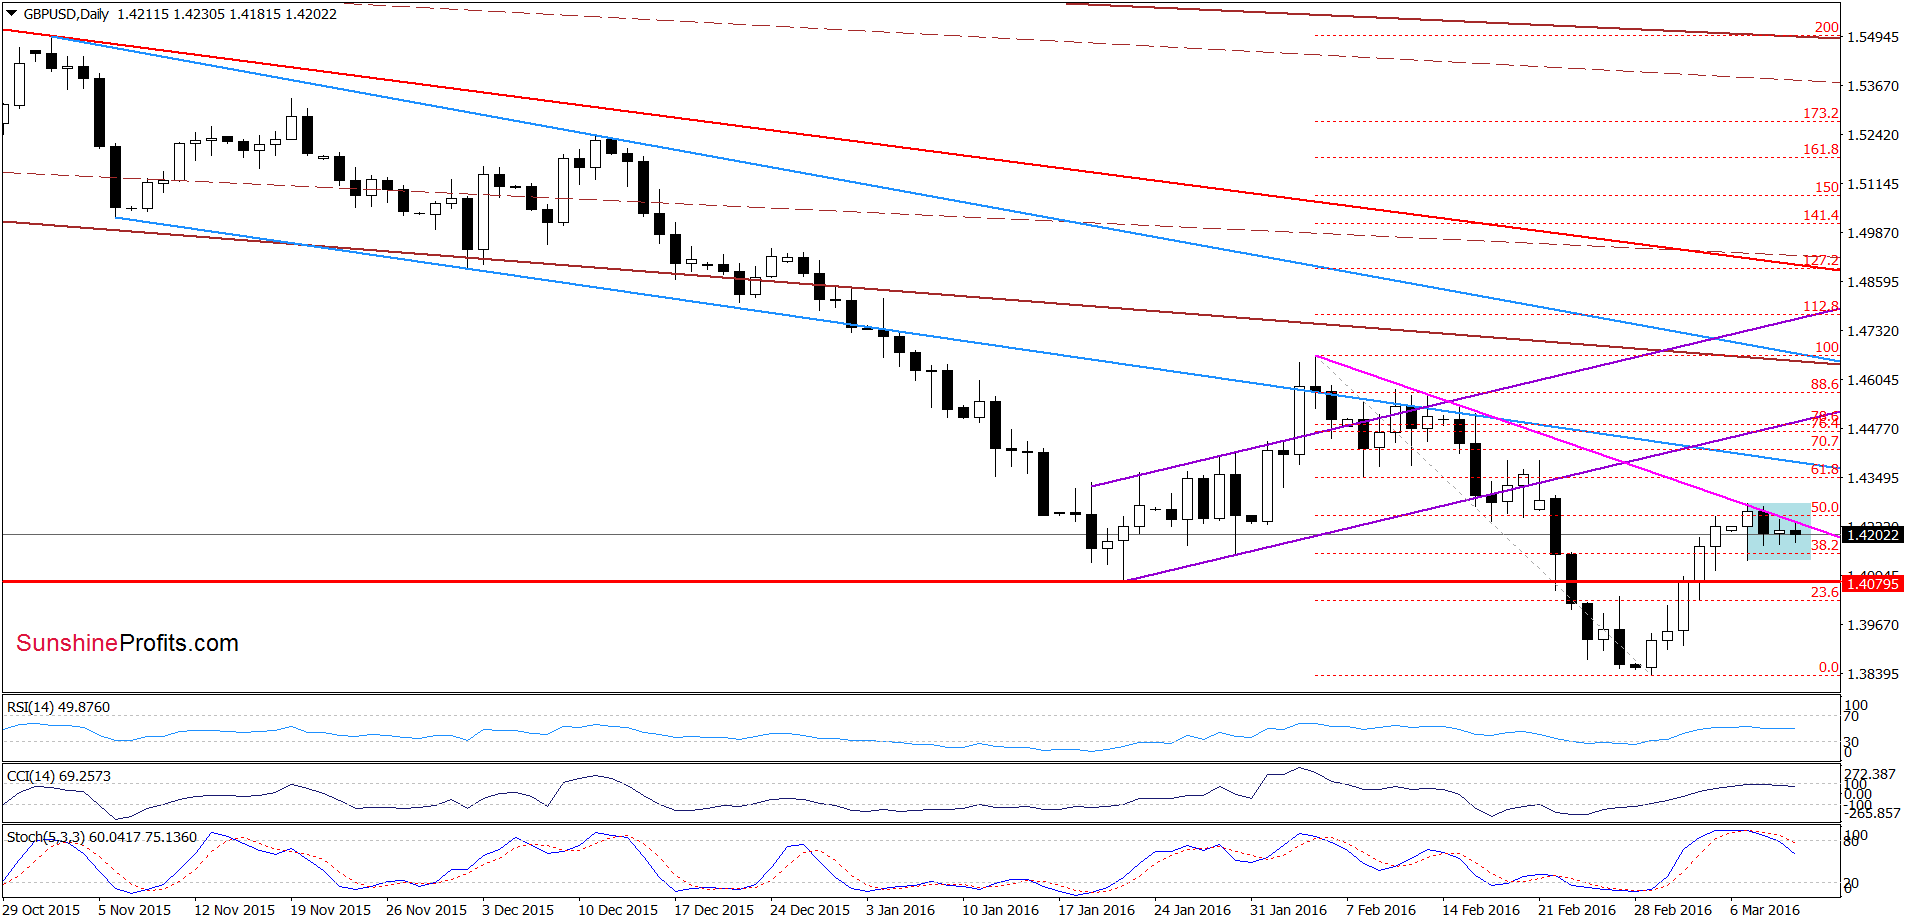
Looking at the daily chart, we see that GBP/USD remains in the blue consolidation under the pink resistance line and the 50% Fibonacci retracement. Although the pair can go both or north and south from here, the current position of the indicators (a sell signal generated by the Stochastic Oscillator is still in play) suggests that another downswing in the coming days is more likely.
Are the any other factors that could support the realization of the above scenario? Let’s examine the weekly chart and find out.
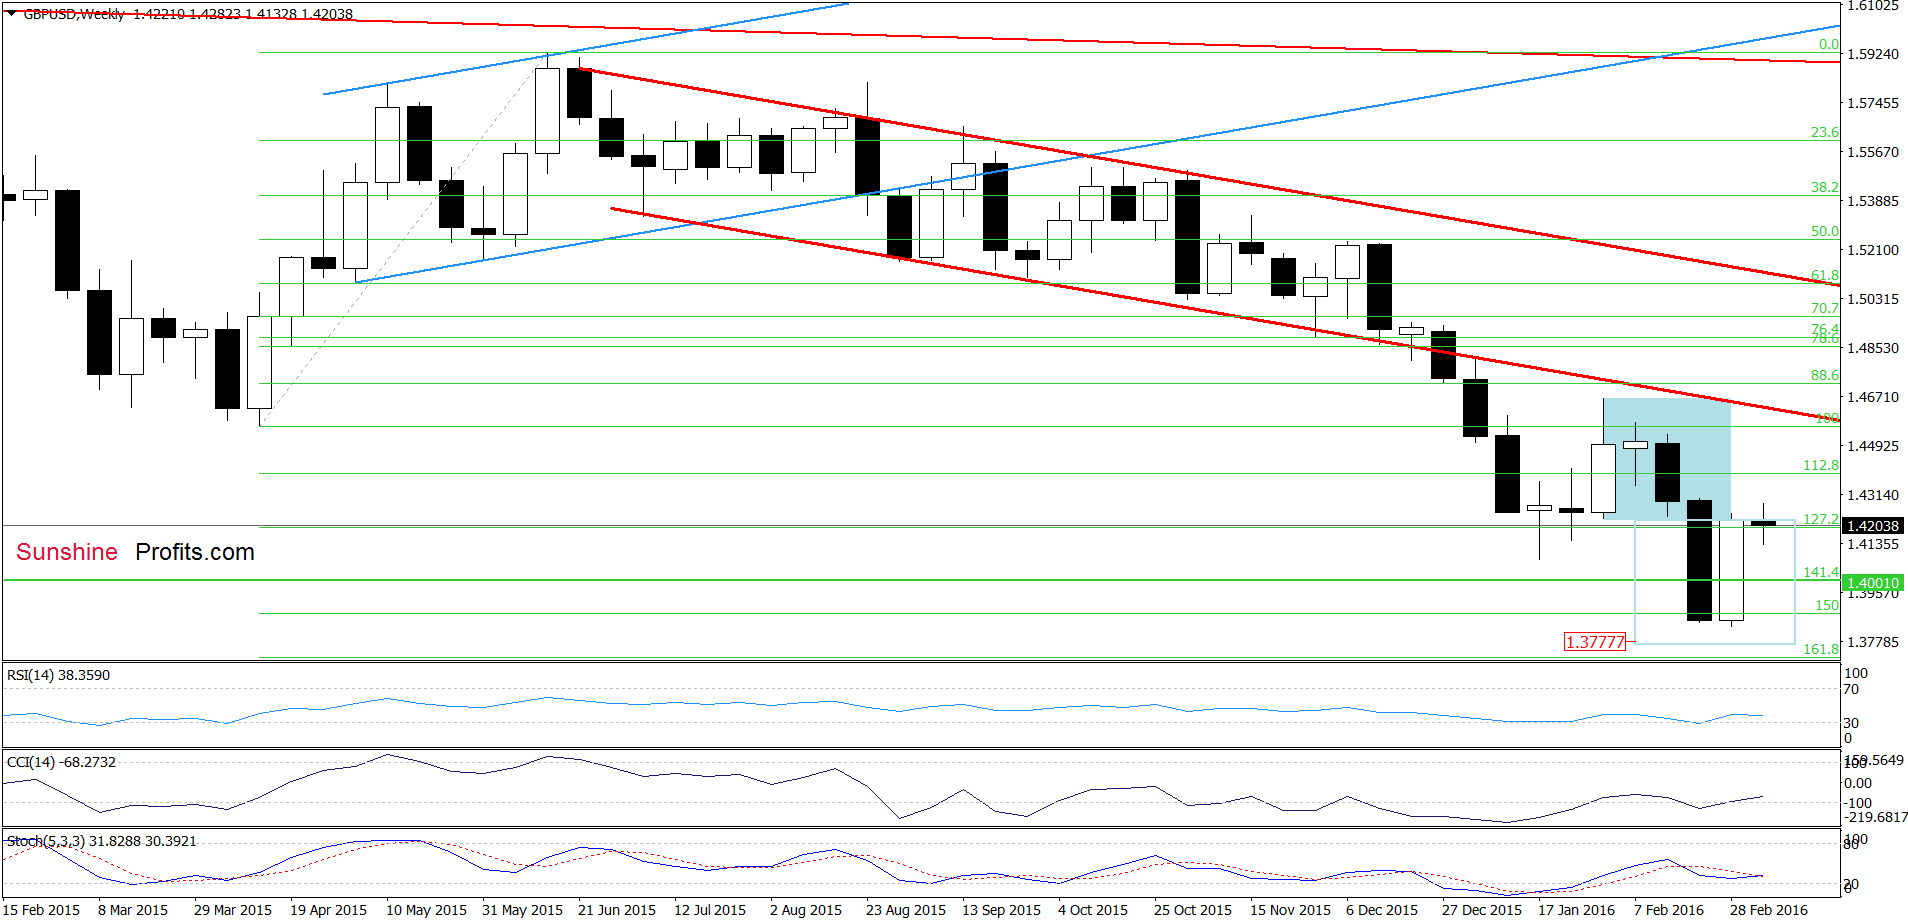
From this perspective, we see that although GBP/USD moved higher earlier this week, the pair gave up some gains and slipped under the lower border of the blue consolidation, which looks like a verification of earlier breakdown. If this is the case, the exchange rate will extend declines in the coming week.
Having said the above, let’s take a closer look at the long-term chart below.
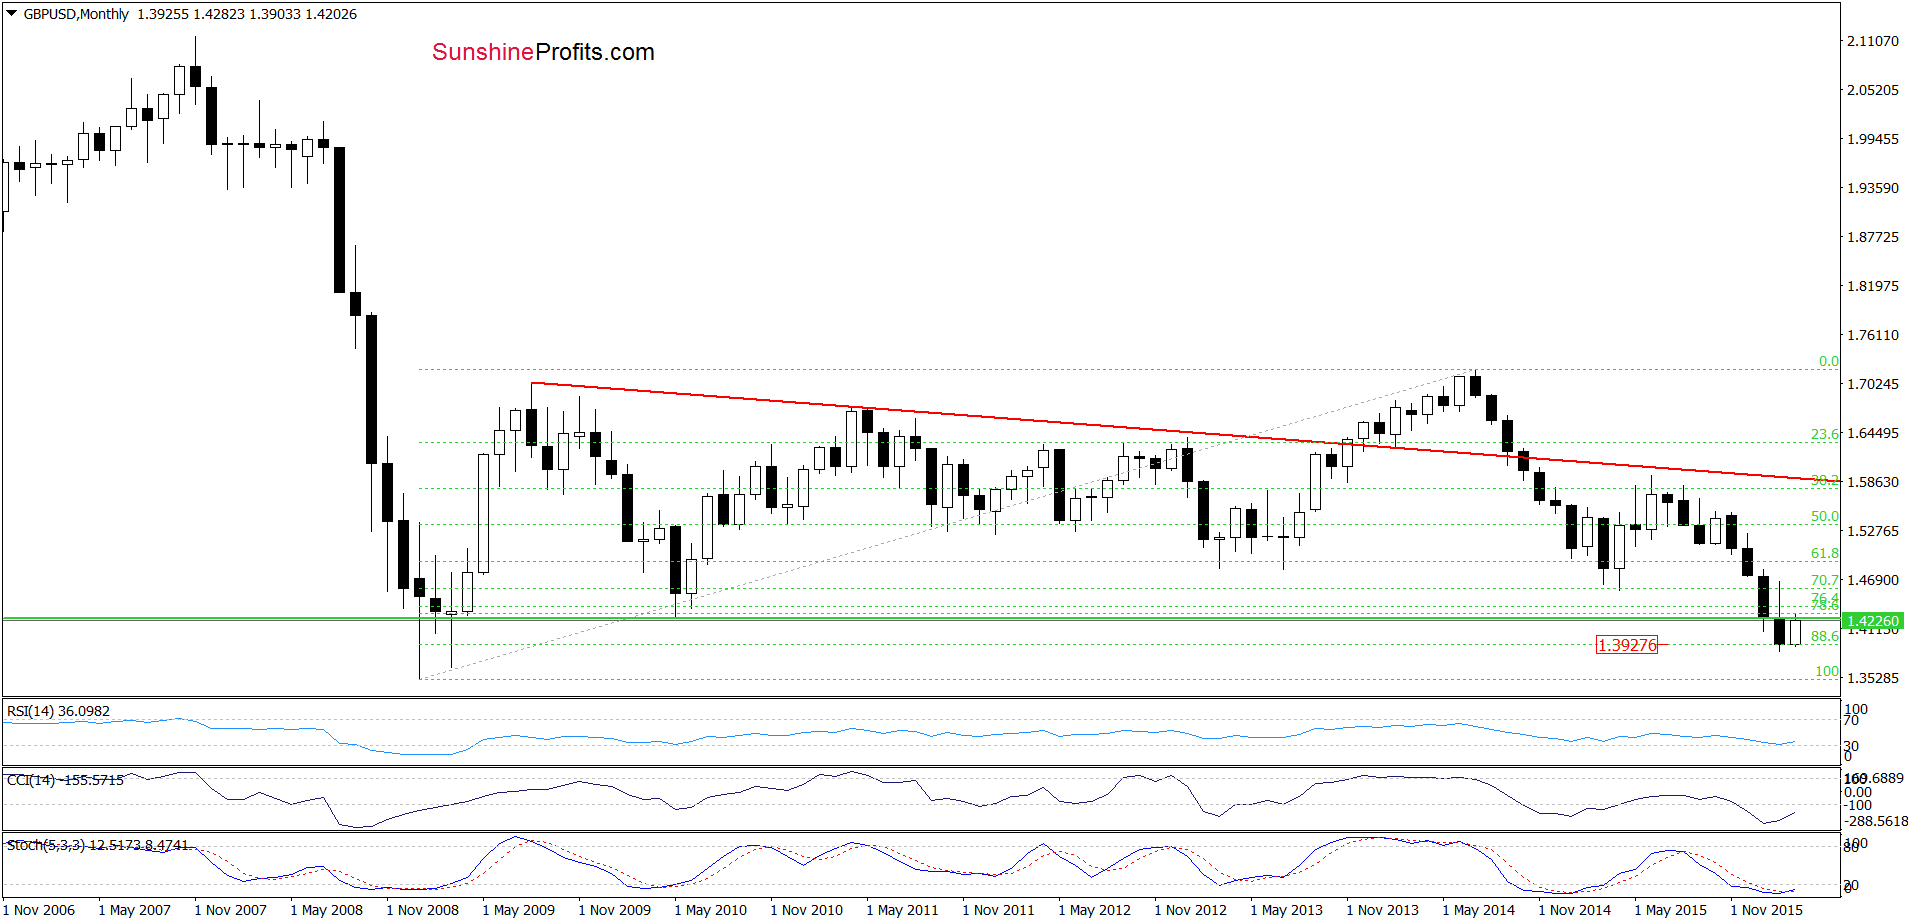
On the long-term chart, we see that GBP/USD rebounded and climbed to the horizontal resistance line based on the May 2010 lows, which suggests a verification of earlier breakdown and lower values of GBP/USD in near future. Therefore if the pair declines from the current levels, the first downside target would be around 1.4090, where the 38.2% Fibonacci retracement (based on the recent upward move) and the red horizontal support line are.
Very short-term outlook: mixed with bearish bias
Short-term outlook: mixed with bearish bias
MT outlook: mixed
LT outlook: mixed
Trading position (short-term; our opinion): No positions are justified from the risk/reward perspective at the moment. We will keep you informed should anything change, or should we see a confirmation/invalidation of the above.
USD/CHF
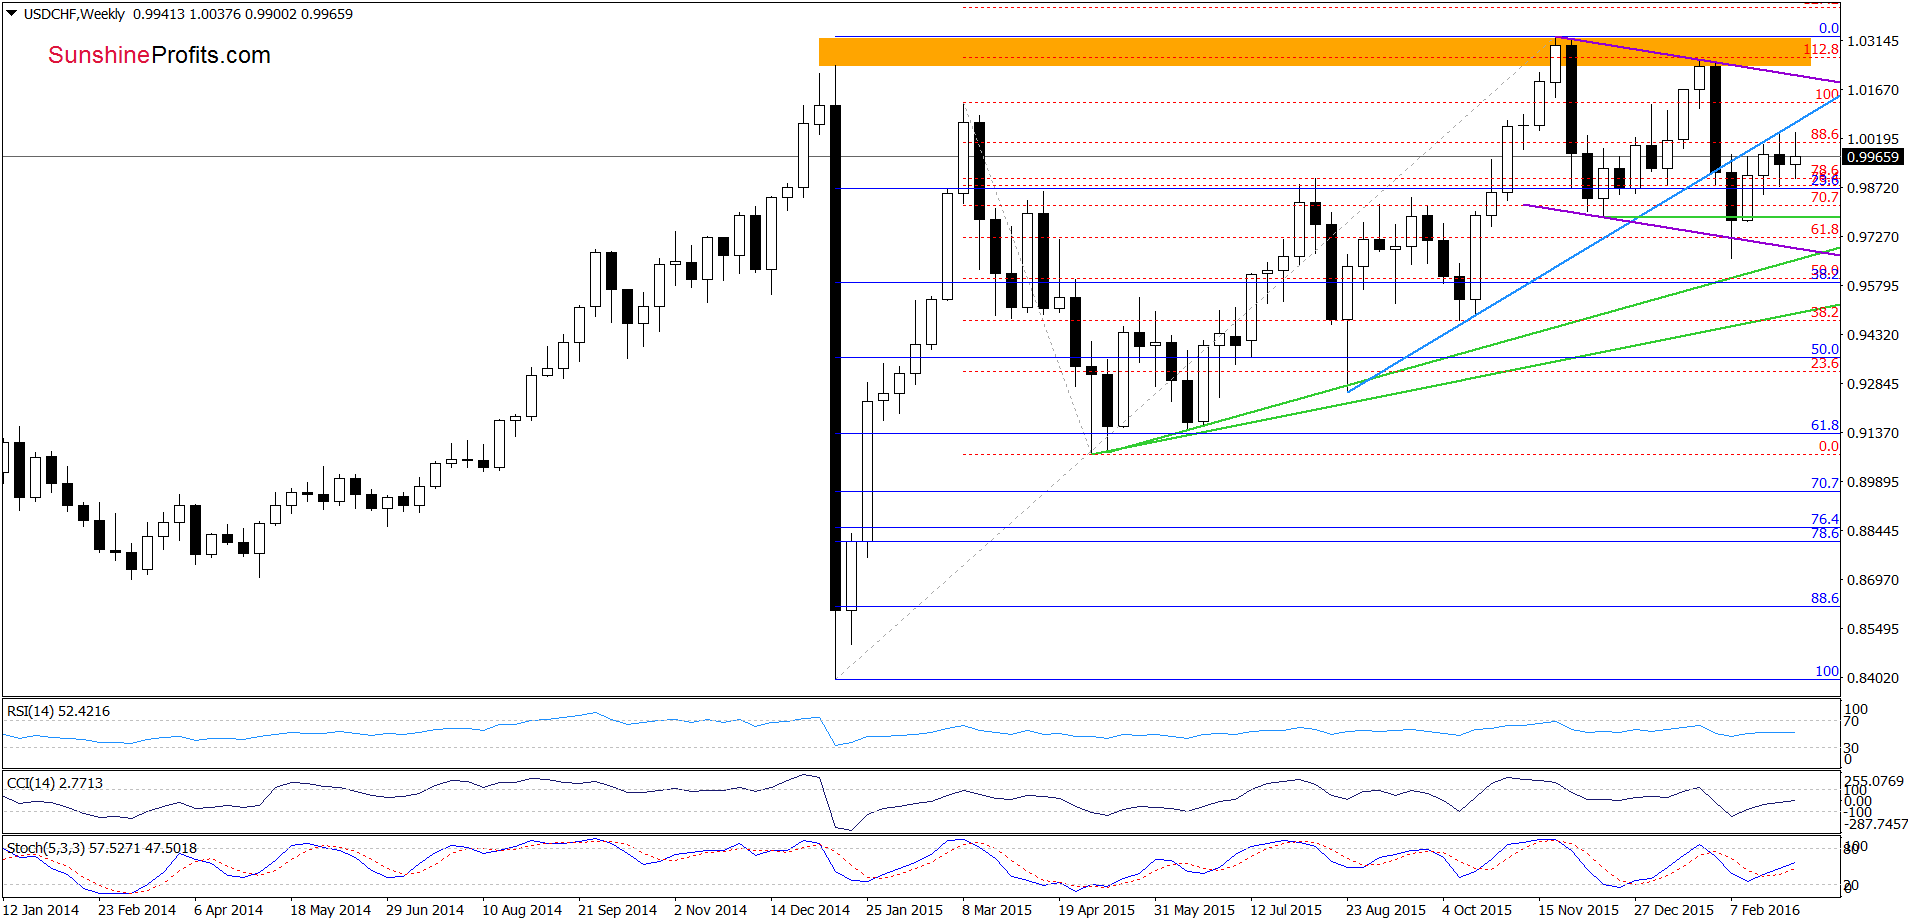
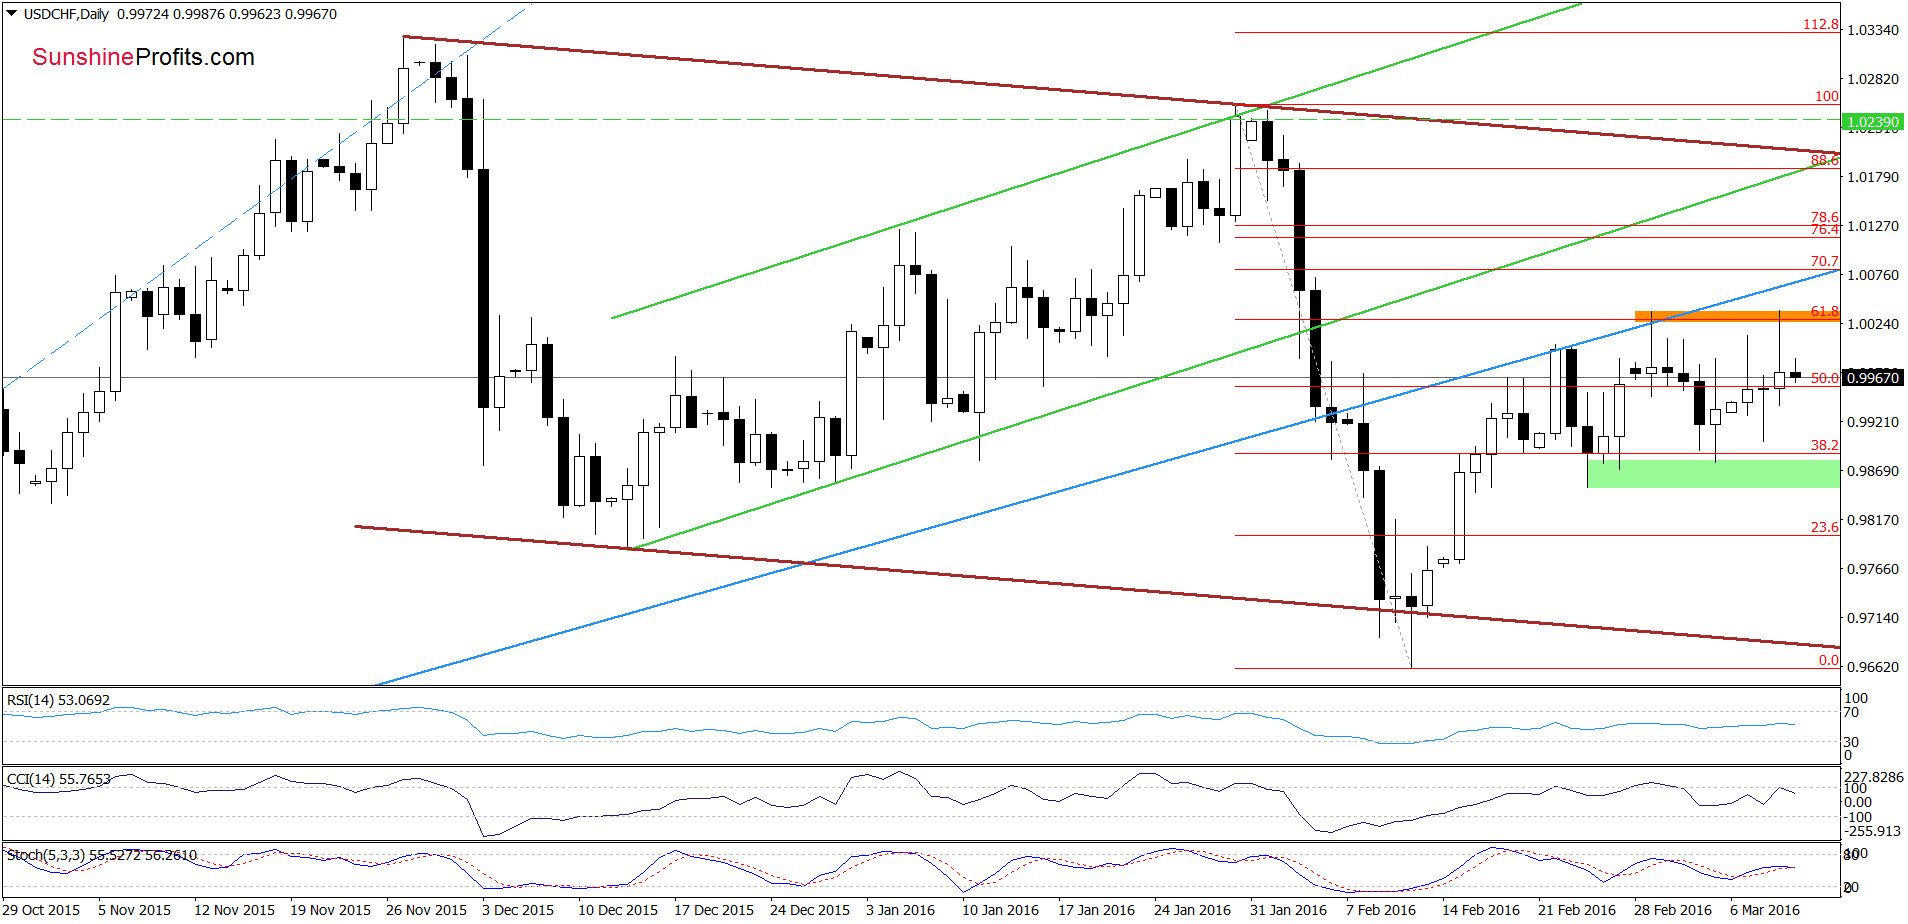
Looking at the above charts, we see that USD/CHF extended gains and re-tested the 61.8% Fibonacci retracement. With this move, the pair climbed slightly above the previous high, but as you see this improvement was only very temporary and the pair gave up some gains very quickly. As a result, the pair invalidated this small breakout, which in combination with the Fibonacci retracement and sell signals generated by the CCI and Stochastic Oscillator suggests further deterioration in the coming days. If this is the case and USD/CHF declines from here, the initial downside target would be the green support zone marked on the daily chart. Finishing today’s alert, please keep in mind that as long as there is no invalidation of the breakdown under the blue resistance line another bigger upward move is questionable. Nevertheless, if we see such price action, we’ll consider re-opening long positions.
Very short-term outlook: mixed with bearish bias
Short-term outlook: mixed
MT outlook: mixed
LT outlook: mixed
Trading position (short-term; our opinion): No positions are justified from the risk/reward perspective. We will keep you informed should anything change, or should we see a confirmation/invalidation of the above.
Thank you.
Nadia Simmons
Forex & Oil Trading Strategist
Przemyslaw Radomski, CFA
Founder, Editor-in-chief
Gold & Silver Trading Alerts
Forex Trading Alerts
Oil Investment Updates
Oil Trading Alerts
