

Forex Trading Alert originally sent to subscribers on March 24, 2016, 8:26 AM.
Yesterday, the Canadian dollar moved sharply lower against its U.S. counterpart as light crude declined under $40 after bigger-than-expected increase in crude oil inventories. As a result, USD/CAD came back above the lower border of trend channel, invalidating earlier breakdown. What does it mean for the exchange rate?
In our opinion the following forex trading positions are justified - summary:
- EUR/USD: short (stop-loss order at 1.1512; initial downside target at 1.0572)
- GBP/USD: none
- USD/JPY: none
- USD/CAD: none
- USD/CHF: long (stop-loss order at 0.9542; initial upside target at 0.9985)
- AUD/USD: none
EUR/USD
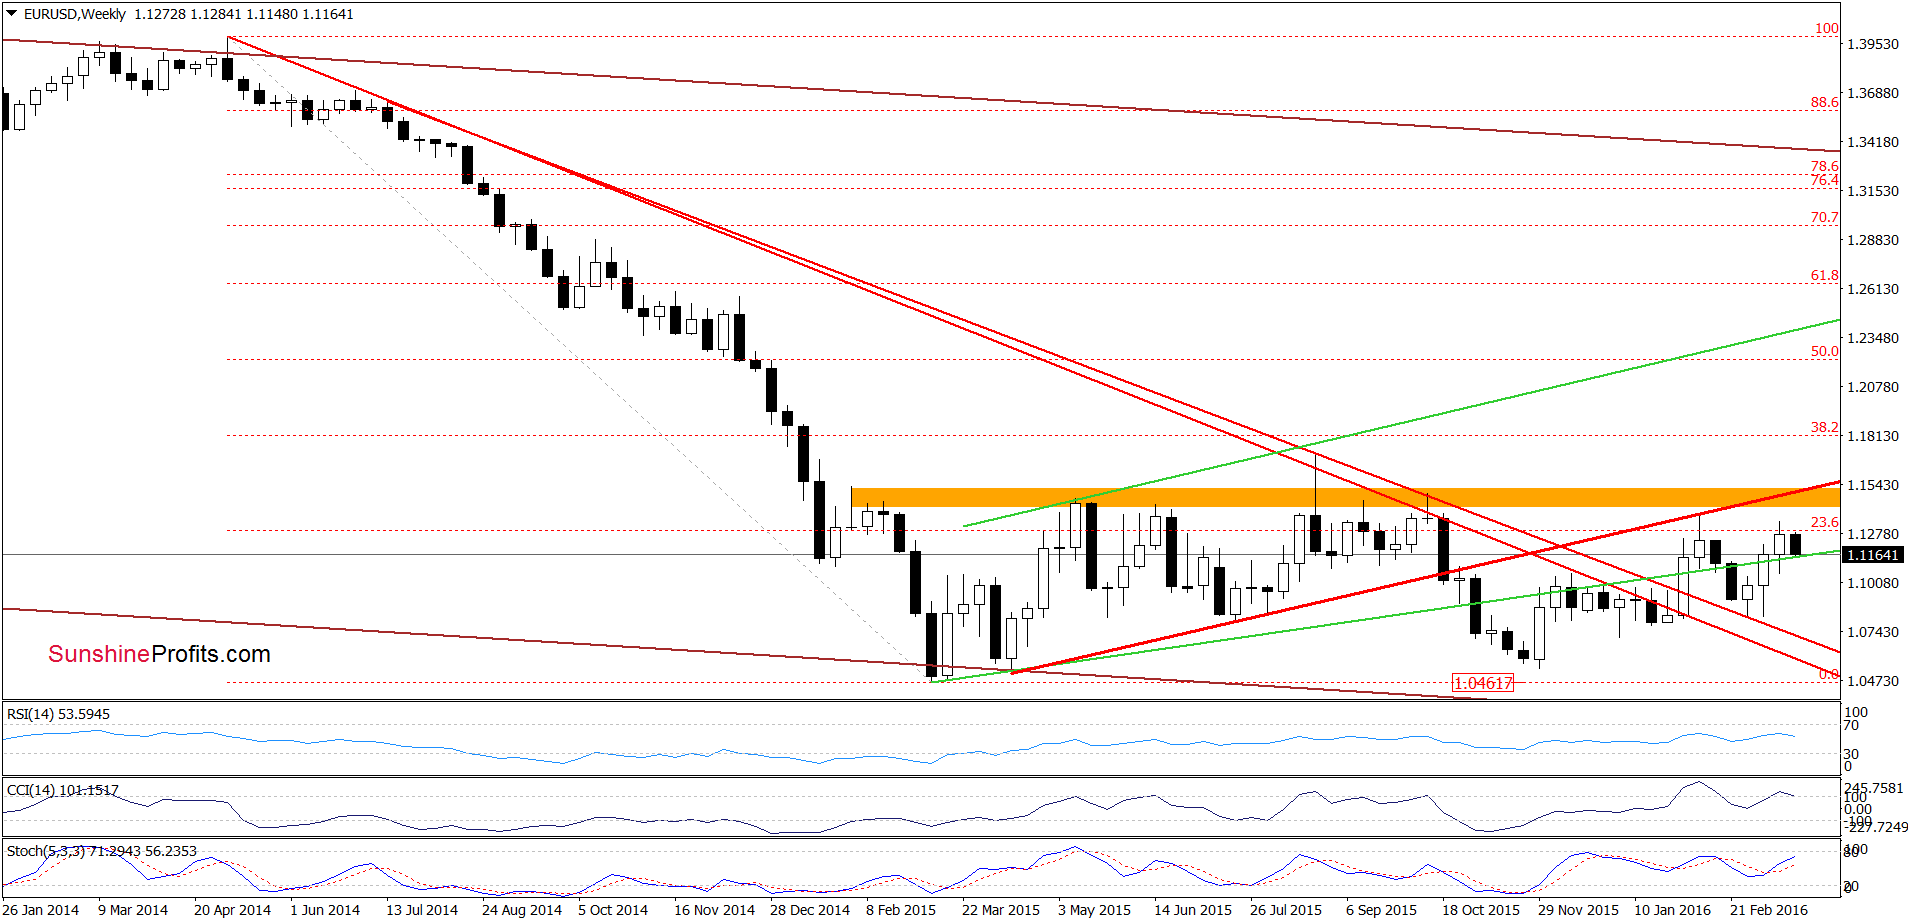
Looking at the above charts, we see that EUR/USD remains under the lower border of the blue consolidation, which suggests that what we wrote on Tuesday is up-to-date:
(…) the key resistance zone (marked with orange and reinforced by the red resistance line based on the Apr and Jul lows) continues to keep gains in check. Therefore, we believe that as long as there will be no breakout above this area lower values of the exchange rate are very likely.
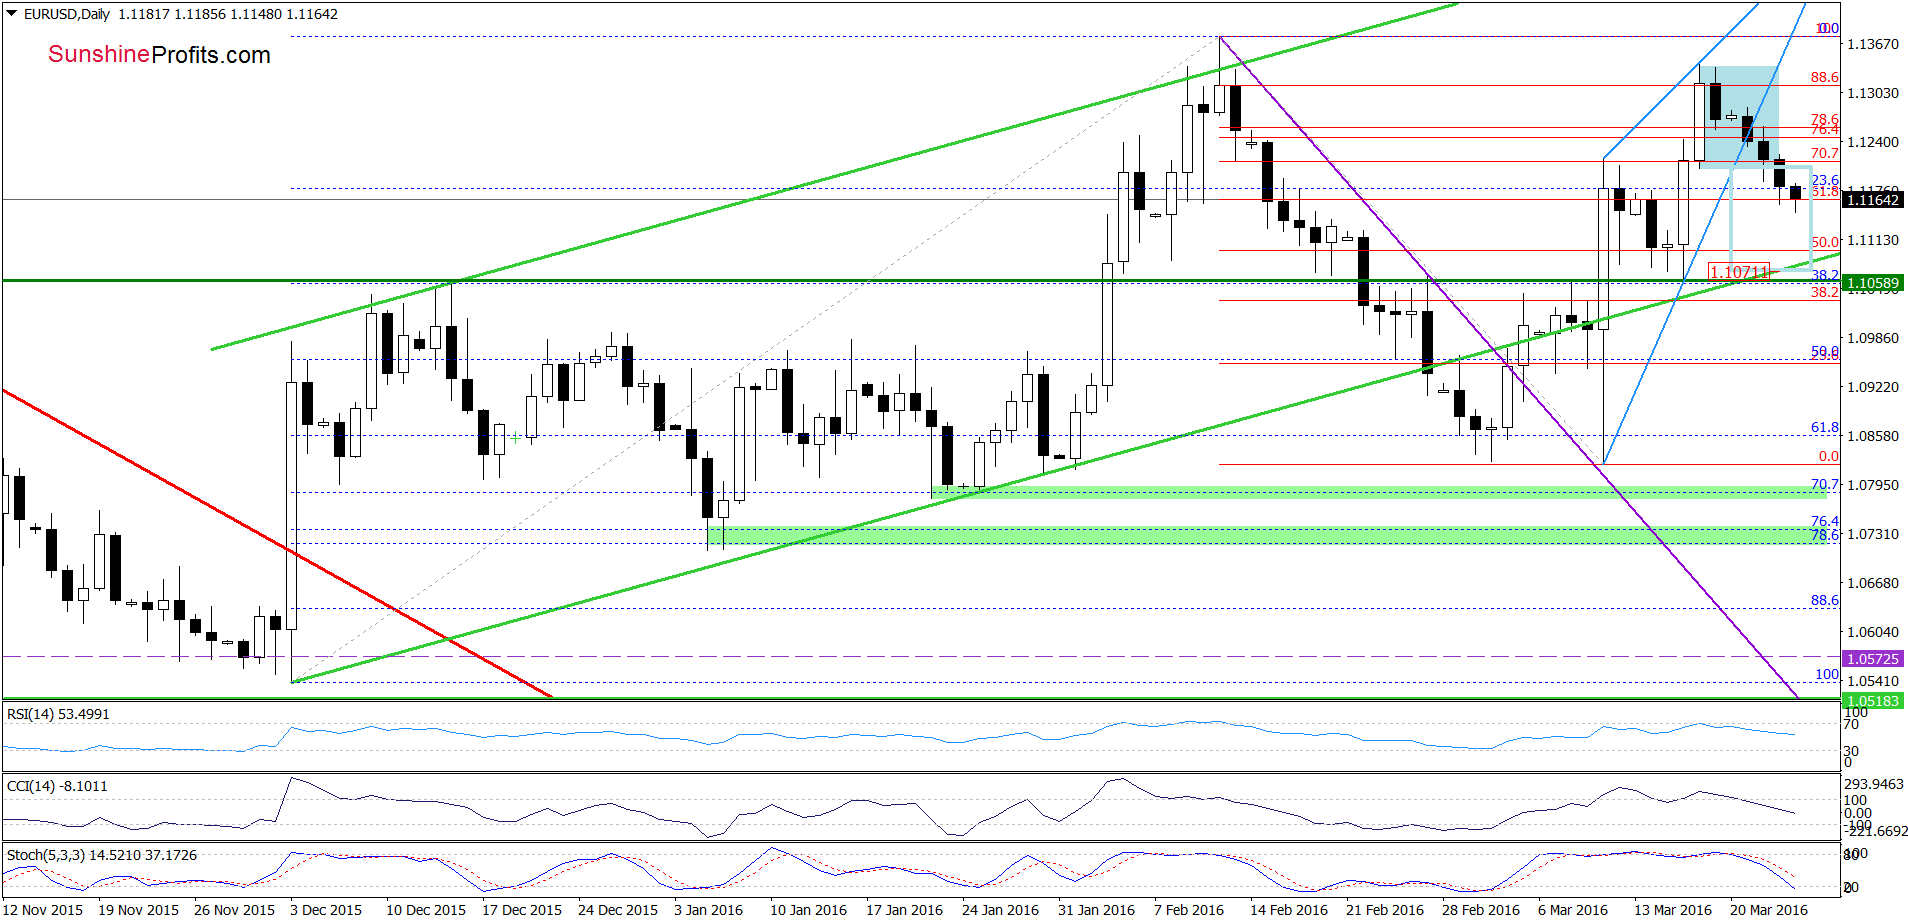
(…) EUR/USD declined not only under the lower border of the blue rising wedge, but also below the lower line of the blue consolidation, which suggests further deterioration and a drop to around 1.1071, where the size of the move will correspond to the height of the formation. In this area is also the lower border of the green rising trend channel and the green horizontal support line, which together could pause further declines.
Very short-term outlook: bearish
Short-term outlook: bearish
MT outlook: mixed with bearish bias
LT outlook: mixed
Trading position (short-term; our opinion): Short positions (with a stop-loss order at 1.1512 and the initial downside target at 1.0572) are justified from the risk/reward perspective. We will keep you informed should anything change, or should we see a confirmation/invalidation of the above.
GBP/USD
On Monday, we wrote:
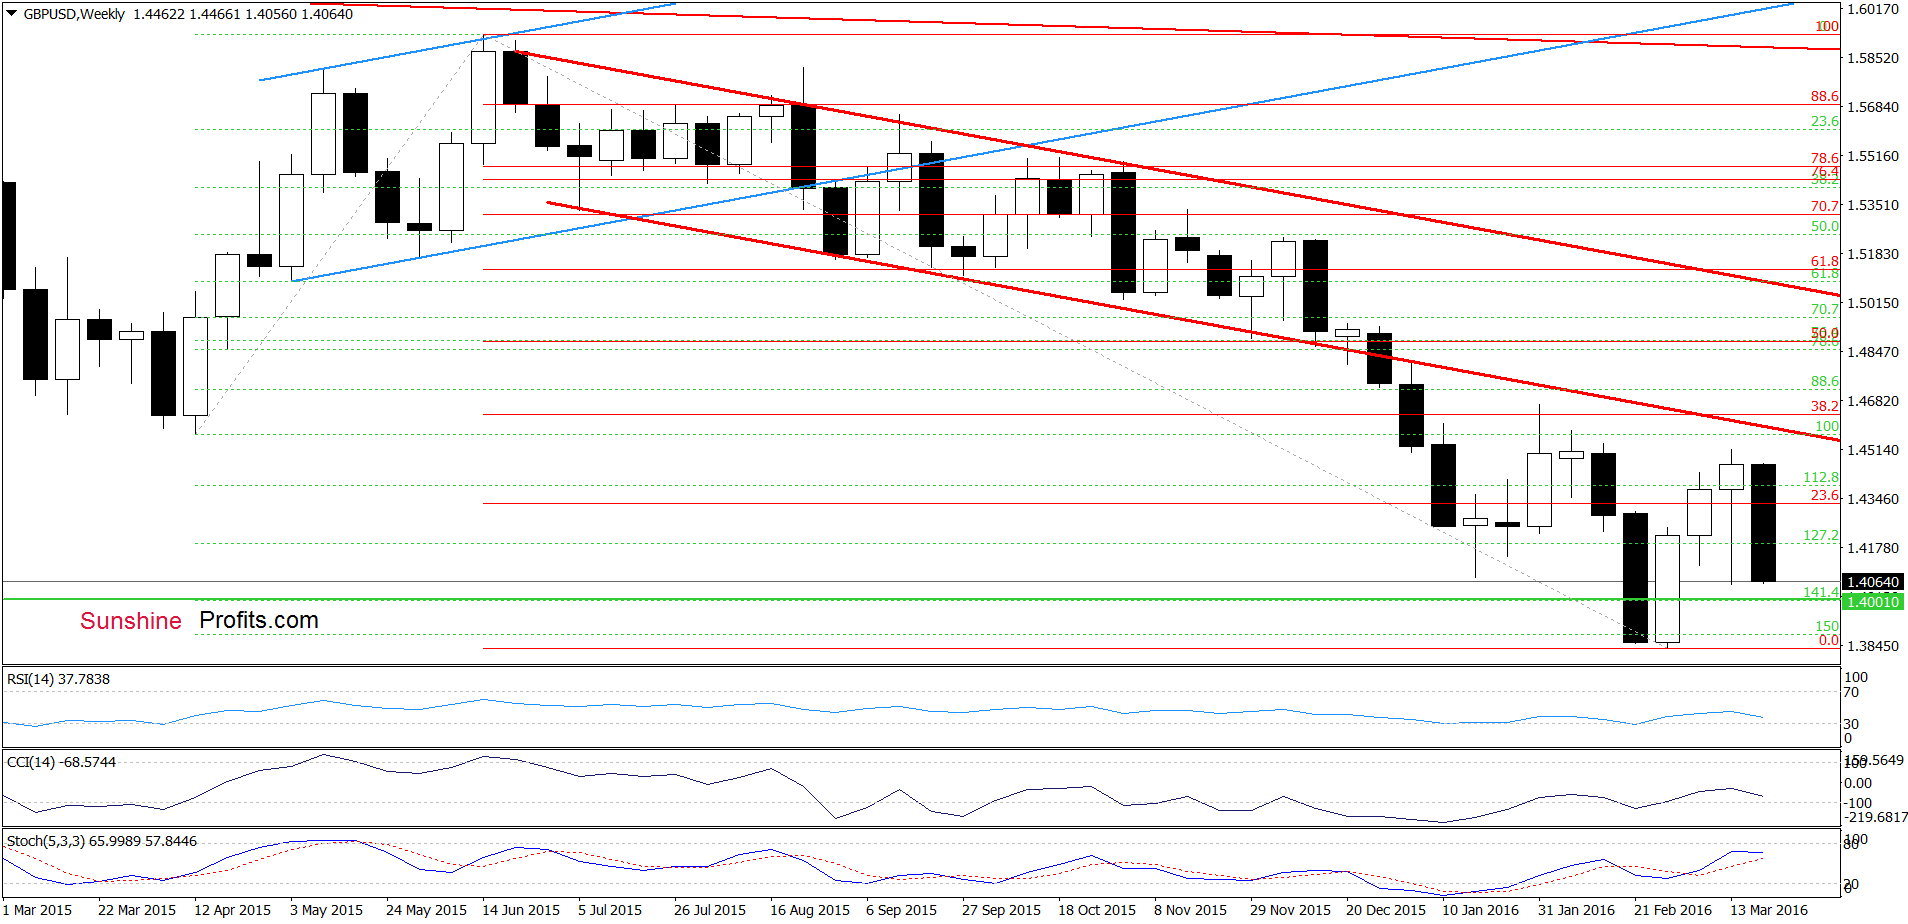
(…) the CCI generated a sell signal, while the Stochastic Oscillator is very close to doing the same, which suggests that further deterioration is just around the corner. If this is the case and GBP/USD declines from here, the initial downside target would be the blue declining line, which serves as the short-term support at the moment.
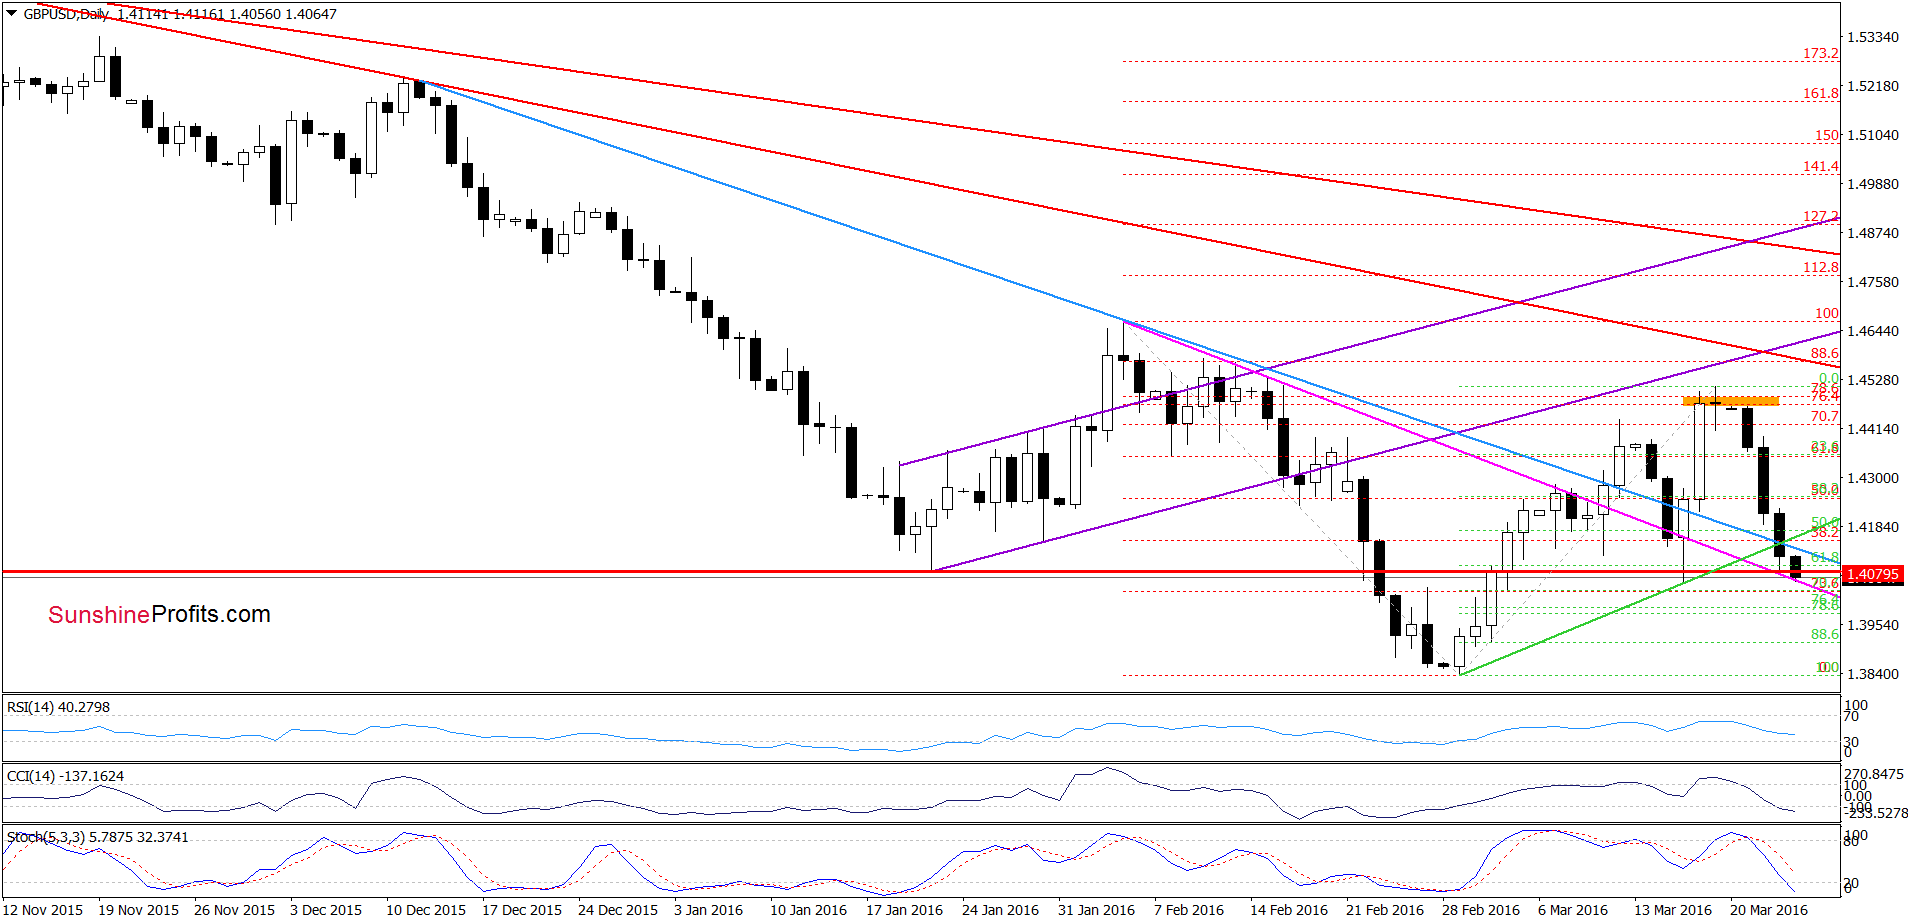
On the daily chart, we see that currency bears pushed GB/USD lower as we had expected. With this downward move, the exchange rate not only declined to our downside target, but also slipped below the green support line based on the previous lows, which is an additional negative signal. As you see on the daily chart, the recent decline took the pair to the red horizontal support line based on the Jan low, which suggests that we may see a rebound from here – similarly to id-March upswing. Nevertheless, as long as GBP/USD is trading under the green and blue lines and sell signals remain in place lower values of the exchange rate are still in play. Therefore, if the pair extends losses, we’ll see a test of the psychological barrier of 1.4000 or even a decline to the Feb low of 1.3834 in the coming week.
Very short-term outlook: bearish
Short-term outlook: mixed with bearish bias
MT outlook: mixed
LT outlook: mixed
Trading position (short-term; our opinion): No positions are justified from the risk/reward perspective at the moment. We will keep you informed should anything change, or should we see a confirmation/invalidation of the above.
USD/CAD
Quoting our last commentary on this currency pair:
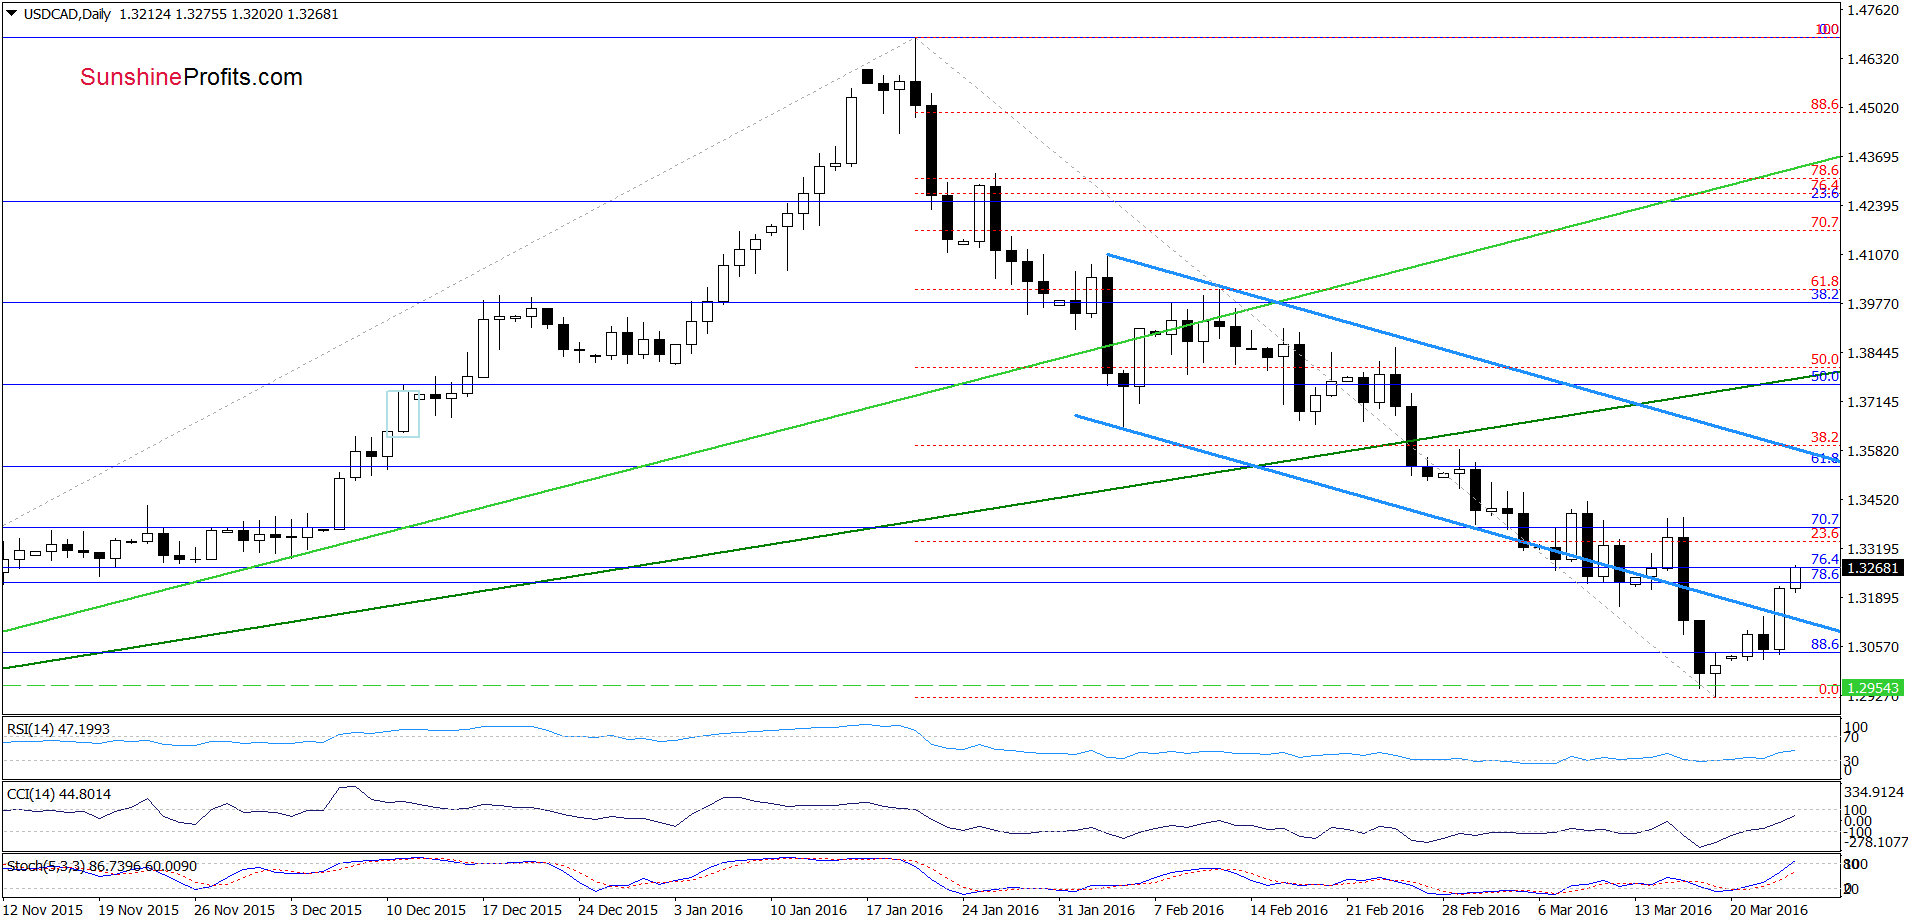
(…) daily and weekly indicators are oversold (and very close to generating buy signals), which suggests that the space for declines may be limited and reversal in the coming week should not surprise us.
As you see on the chart the situation developed in line with the above scenario and USD/CAD rebounded in recent days. As a result, the pair invalidated the breakdown under the lower border of the blue declining trend channel, which is a positive event that suggests further improvement – especially when we factor in buy signals generated by the indicators. Nevertheless, we should keep in mind that the size of move is quite small as USD/CAD didn’t even reach the 23.6% Fibonacci retracement based n the entire Jan-March decline.
Are there any other factors that could hinder the realization of a pro-growth scenario? Let’s examine the weekly chart and find out.
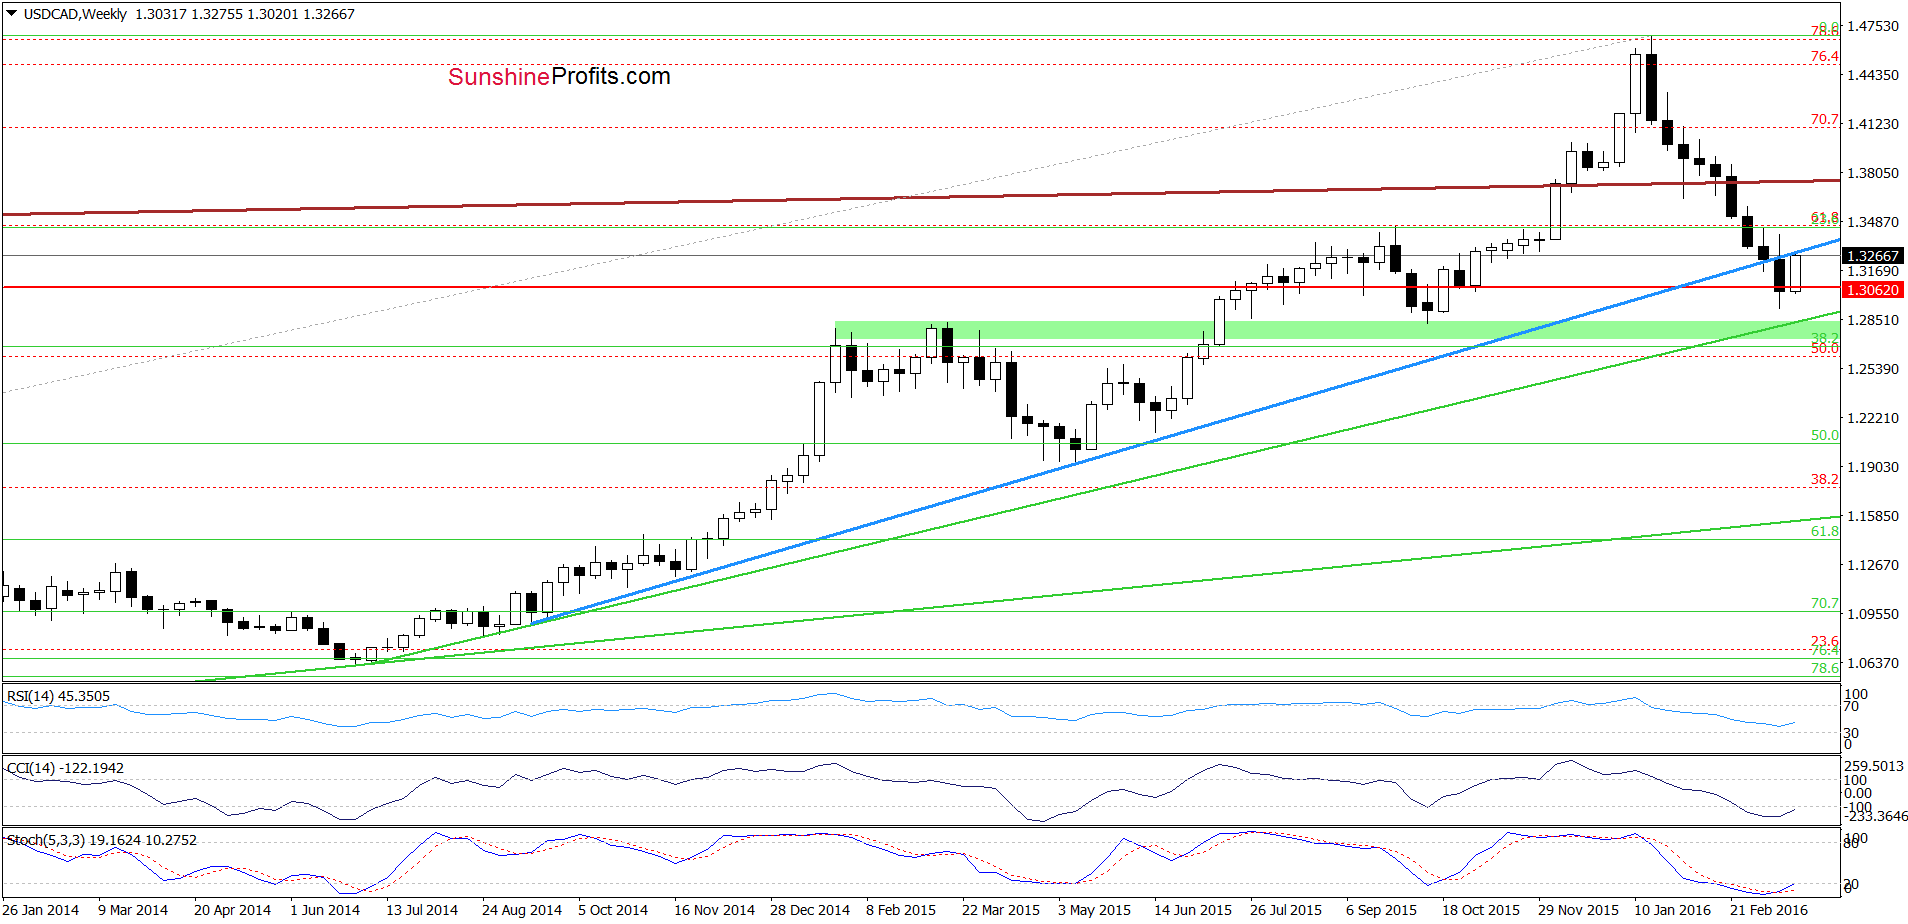
From this perspective, we see that this week’s upswing took USD/CAD to the previously-broken medium-term blue line, which suggests that as long as there won’t be invalidation of the breakdown under this resistance all upswings could be just a verification of earlier breakdown. Therefore, in our opinion, further improvement would be more reliable if we see a weekly closure above this important resistance line.
Very short-term outlook: mixed with bullish bias
Short-term outlook: mixed
MT outlook: mixed
LT outlook: mixed
Trading position (short-term; our opinion): No positions are justified from the risk/reward perspective at the moment. We will keep you informed should anything change, or should we see a confirmation/invalidation of the above.
On an administrative note, due to the Easter weekend, there will be no regular Forex Trading Alerts on Friday and on Monday. If there are important changes, we will send you a short intra-day alert. Thank you for understanding.
Thank you.
Nadia Simmons
Forex & Oil Trading Strategist
Przemyslaw Radomski, CFA
Founder, Editor-in-chief
Gold & Silver Trading Alerts
Forex Trading Alerts
Oil Investment Updates
Oil Trading Alerts
