

Earlier today, the pound moved lower against the greenback after Ian Duncan Smith (Secretary of State for Work and Pensions) Friday’s resignation. As a result, GBP/USD invalidated earlier breakout above the resistance zone and declined under 1.4400. What happened at the same time with other currency pairs?
In our opinion the following forex trading positions are justified - summary:
- EUR/USD: short (stop-loss order at 1.1512; initial downside target at 1.0572)
- GBP/USD: none
- USD/JPY: none
- USD/CAD: none
- USD/CHF: none
- AUD/USD: none
EUR/USD
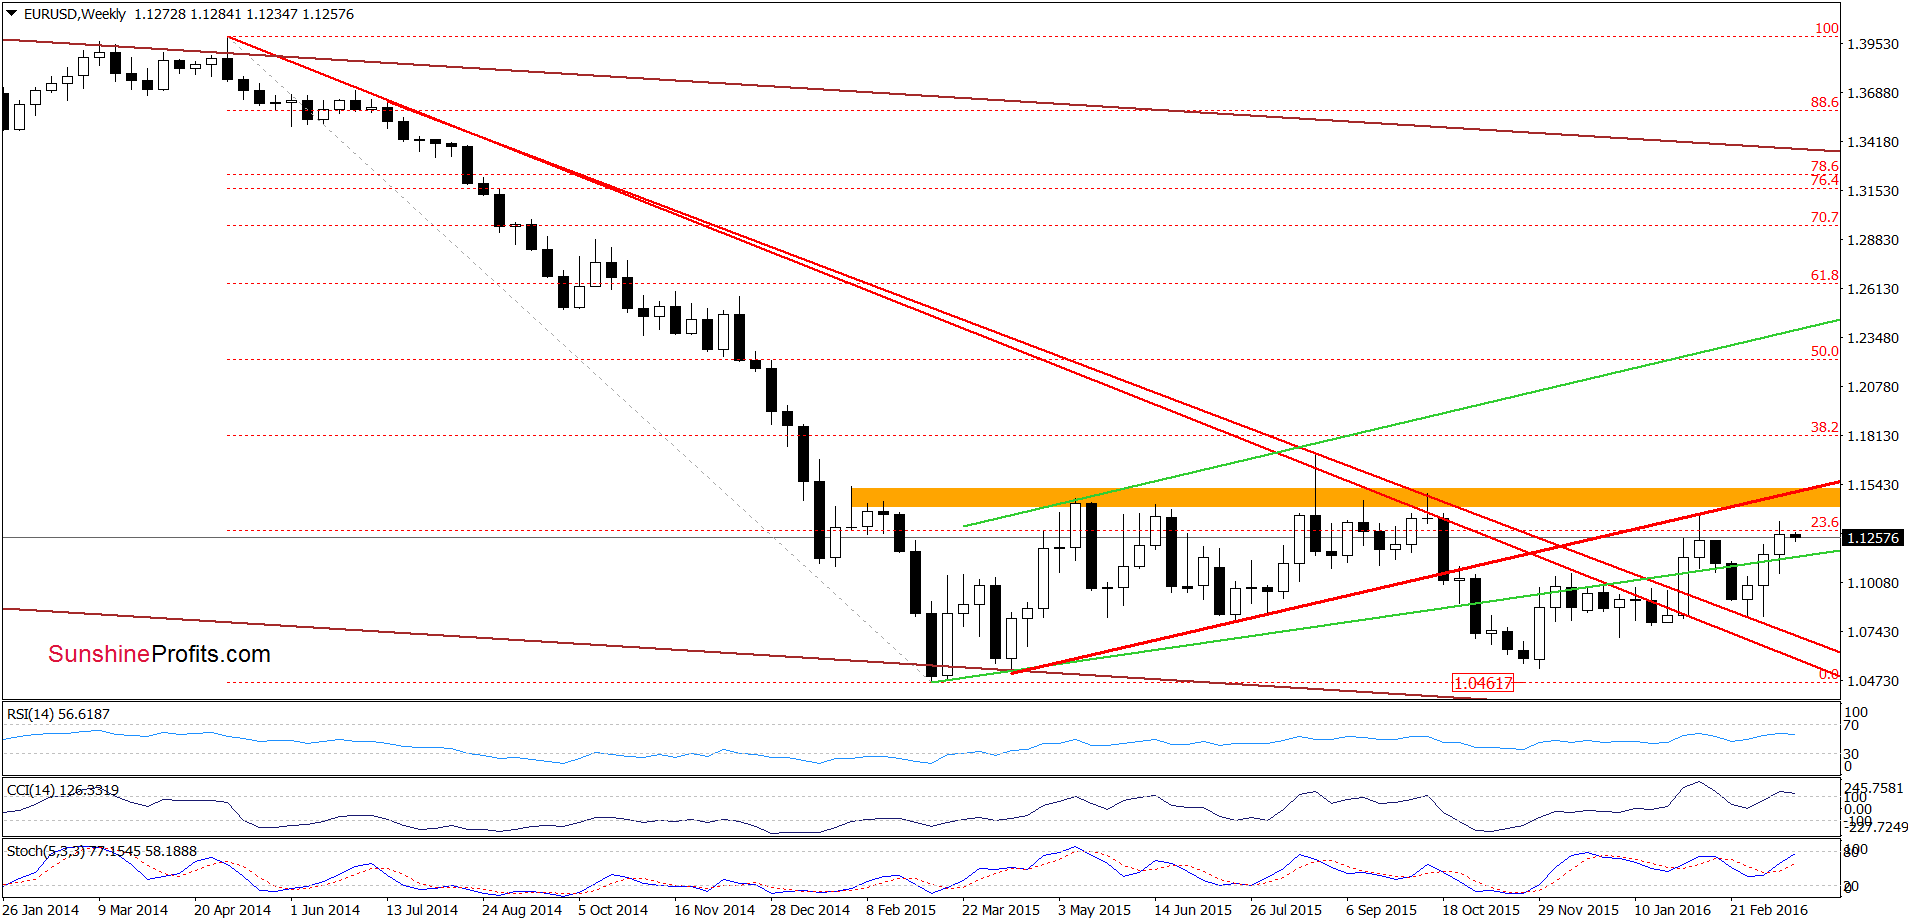
Looking at the weekly chart, we see that EUR/USD moved higher in recent weeks and came back above the previously-broken green support/resistance line. Although this is a positive signal, the key resistance zone (marked with orange and reinforced by the red resistance line based on the Apr and Jul lows) continues to keep gains in check. Therefore, we believe that as long as there will be no breakout above this area lower values of the exchange rate are very likely.
Having said the above, let’s focus on the very short-term changes.
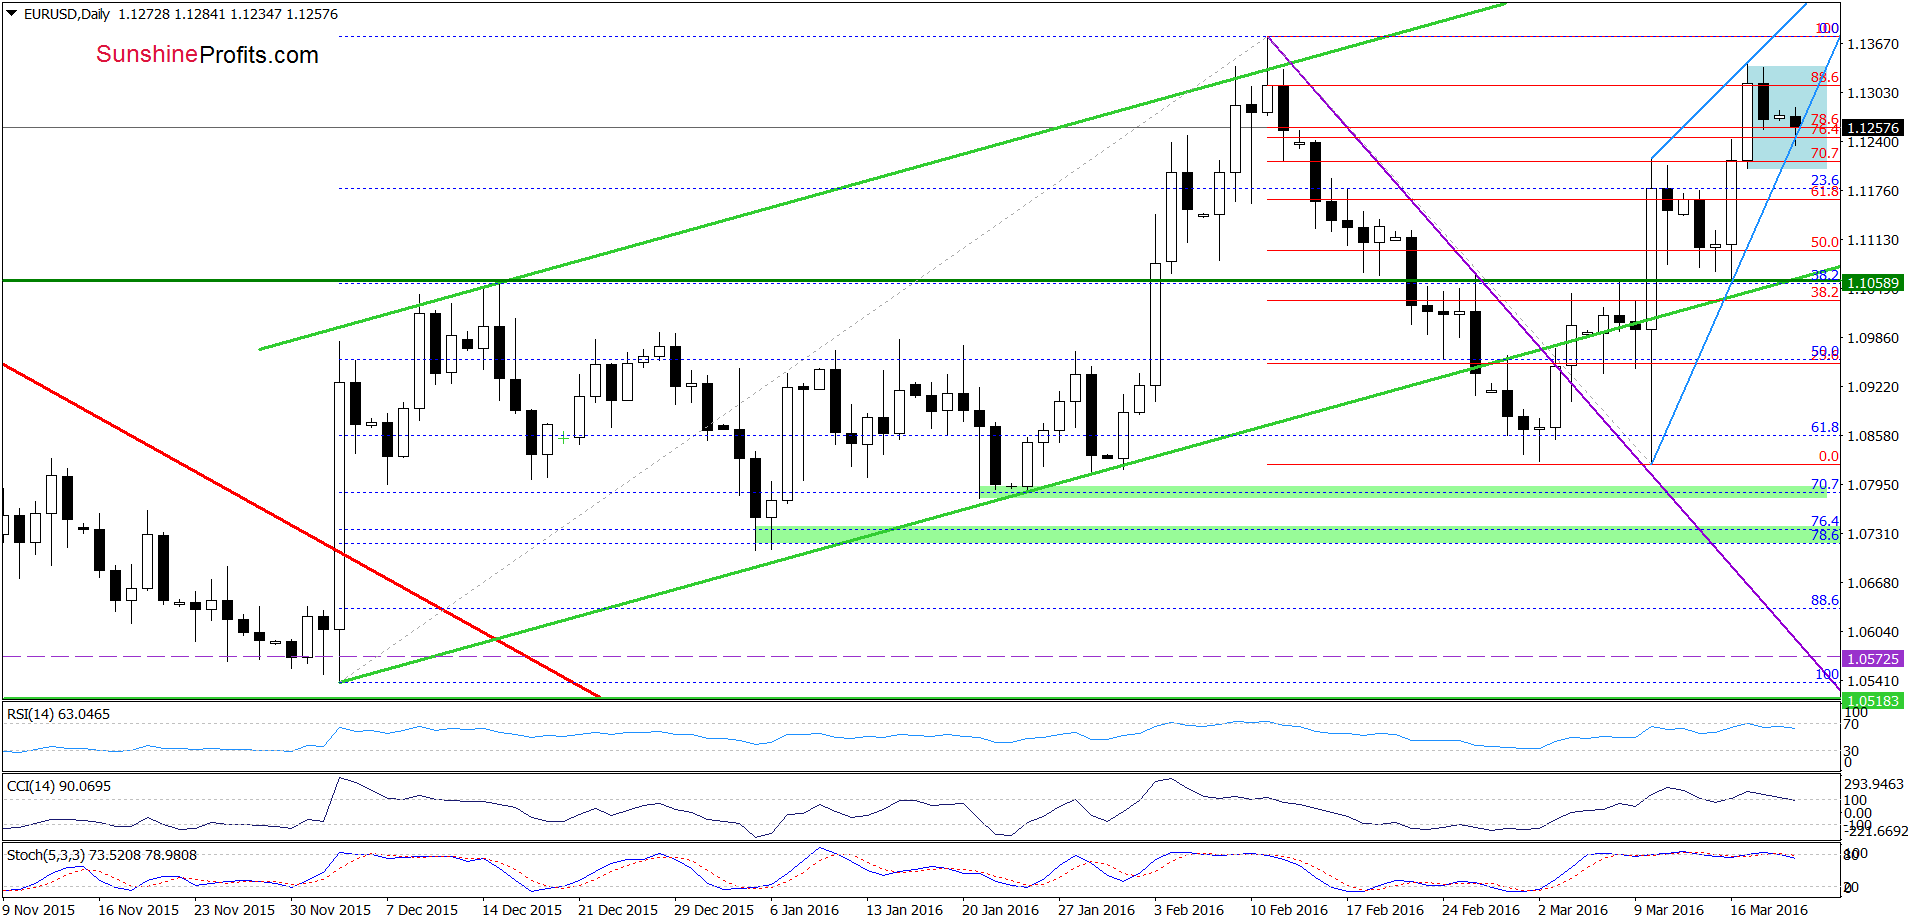
From this perspective, we see that the exchange rate is consolidating in a narrow range inside the blue rising wedge. This suggests that the breakdown under the lower border of the formation (or a breakout above the upper line) will trigger another bigger move. What’s next? Taking into account the proximity to the Feb high and the current position of the indicators (they generated sell signals), we believe that the next move will be to the downside and EUR/USD will re-test the lower border of the green rising trend channel in the coming week.
Very short-term outlook: bearish
Short-term outlook: bearish
MT outlook: mixed with bearish bias
LT outlook: mixed
Trading position (short-term; our opinion): Short positions (with a stop-loss order at 1.1512 and the initial downside target at 1.0572) are justified from the risk/reward perspective. We will keep you informed should anything change, or should we see a confirmation/invalidation of the above.
GBP/USD
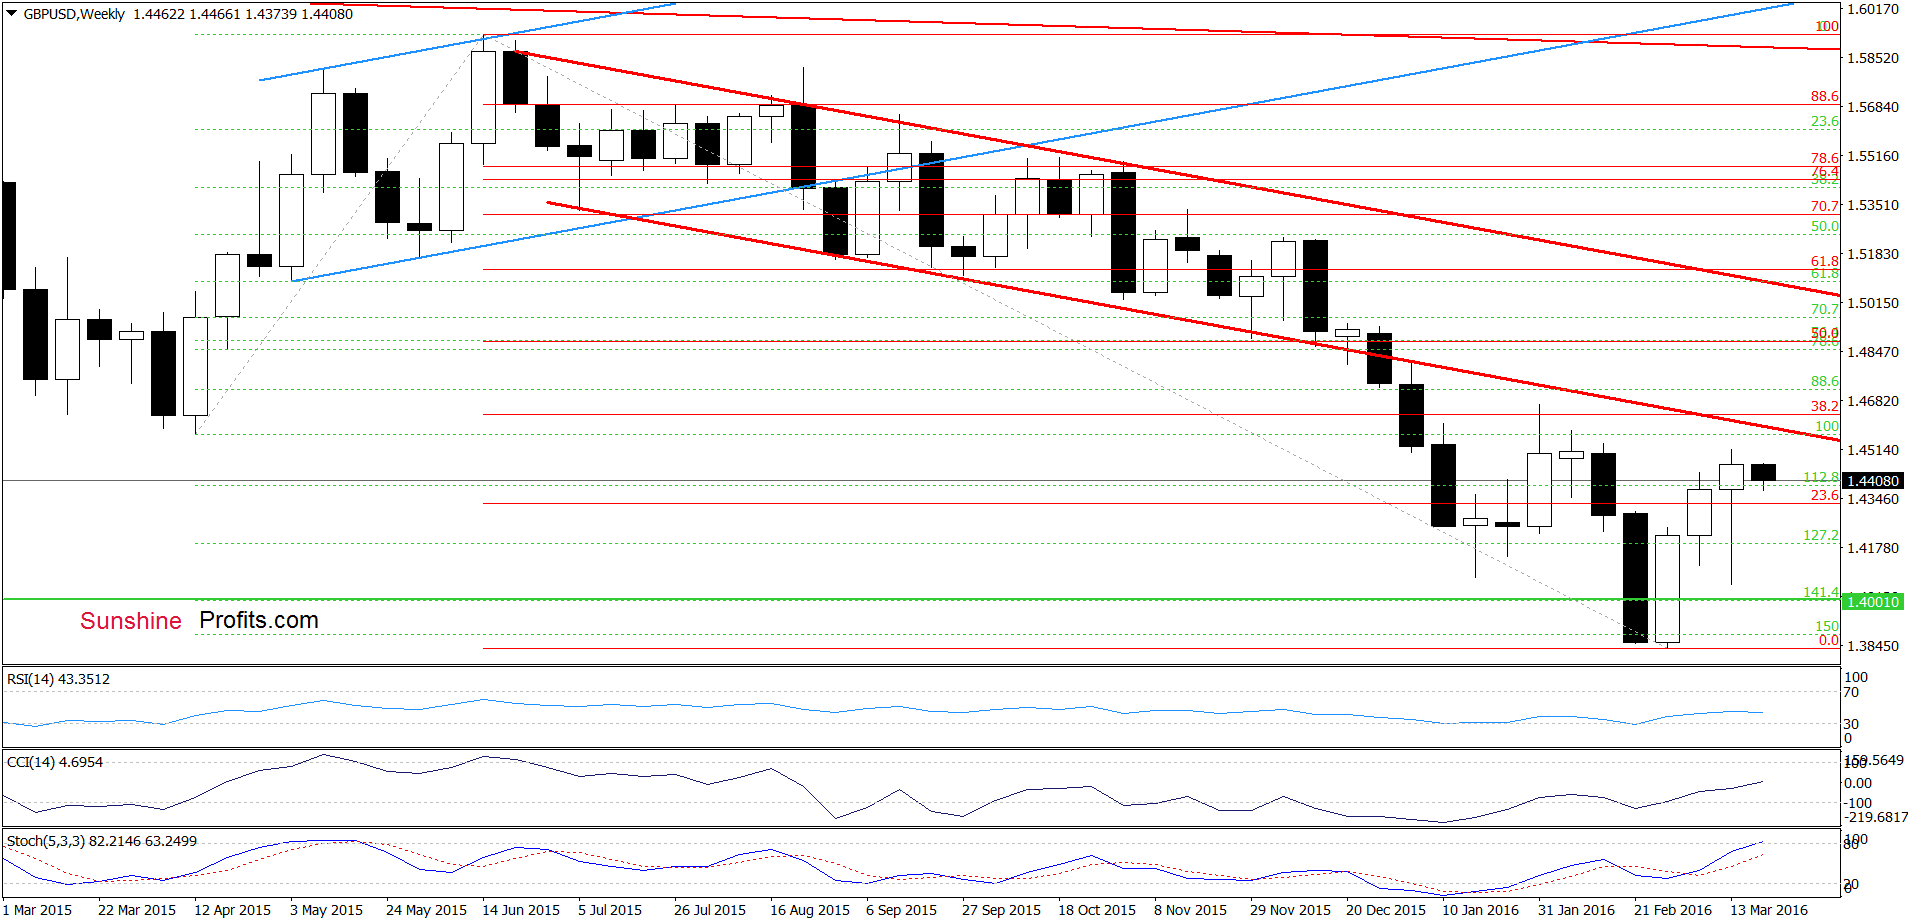
Looking at the chart, we see that the orange resistance zone (created by the 76.4% and 78.6% Fibonacci retracement levels) stopped currency bulls on Friday and triggered a pullback earlier today. Additionally, the CCI generated a sell signal, while the Stochastic Oscillator is very close to doing the same, which suggests that further deterioration is just around the corner. If this is the case and GBP/USD declines from here, the initial downside target would be the blue declining line, which serves as the short-term support at the moment.
Very short-term outlook: mixed with bearish bias
Short-term outlook: mixed with bearish bias
MT outlook: mixed
LT outlook: mixed
Trading position (short-term; our opinion): No positions are justified from the risk/reward perspective at the moment. We will keep you informed should anything change, or should we see a confirmation/invalidation of the above.
USD/JPY
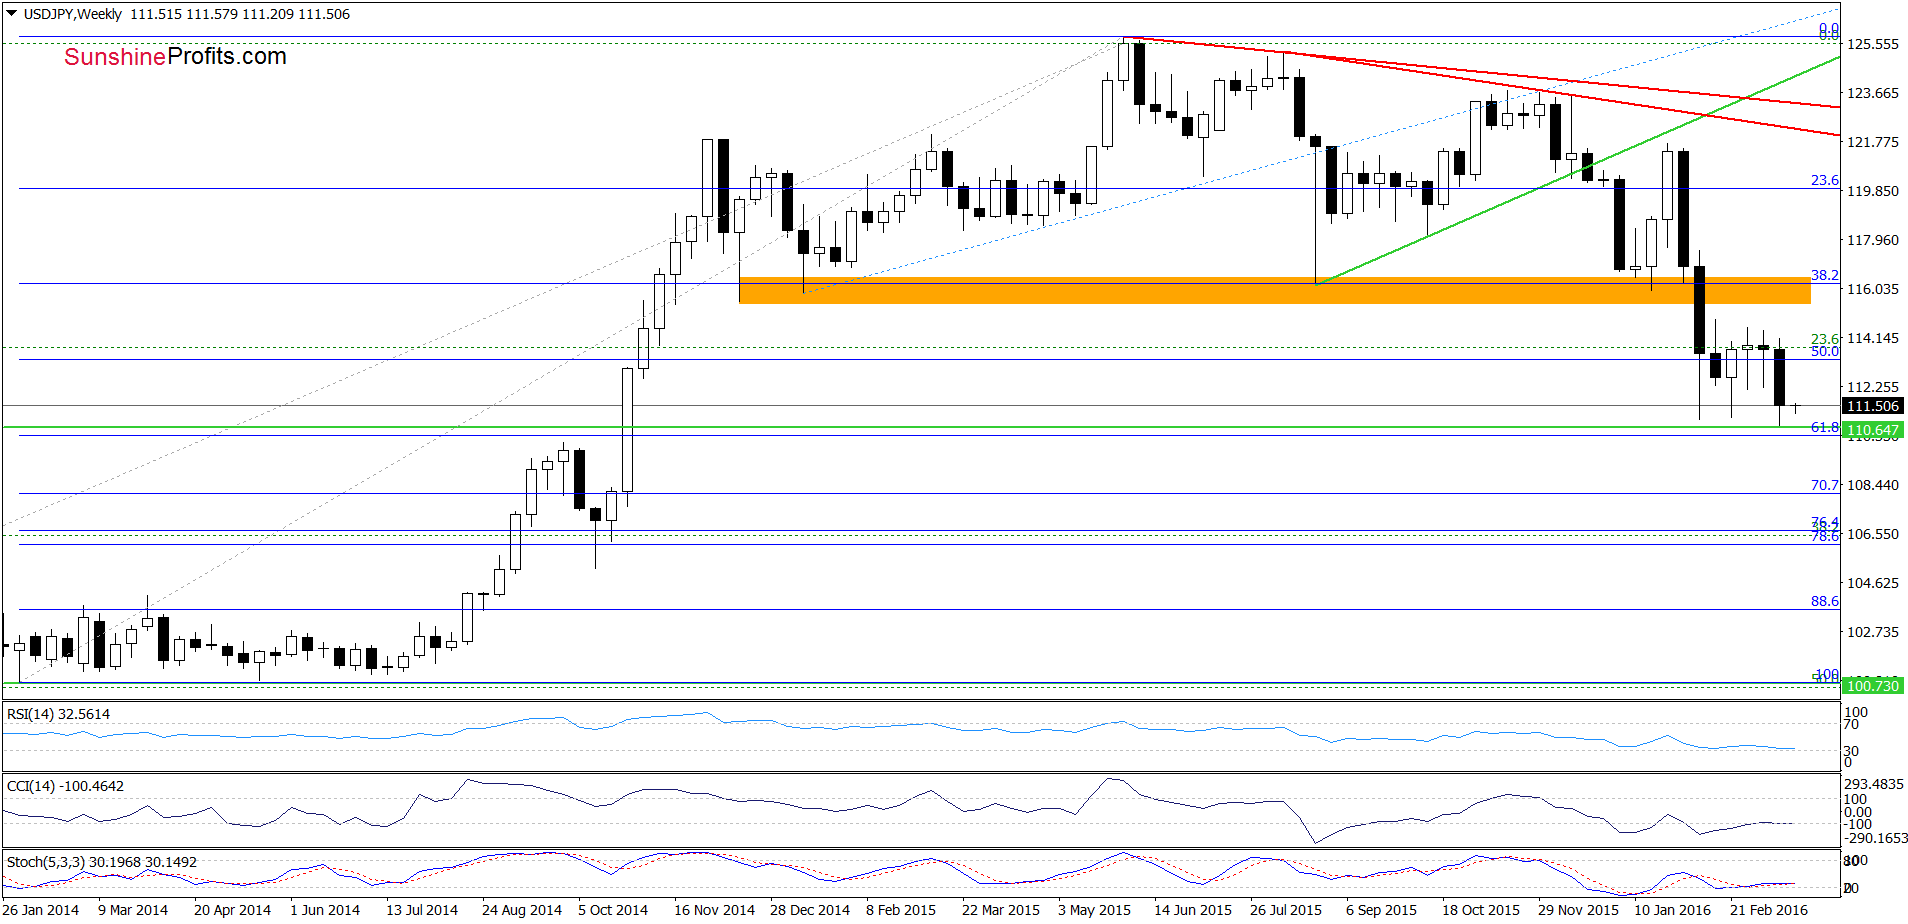
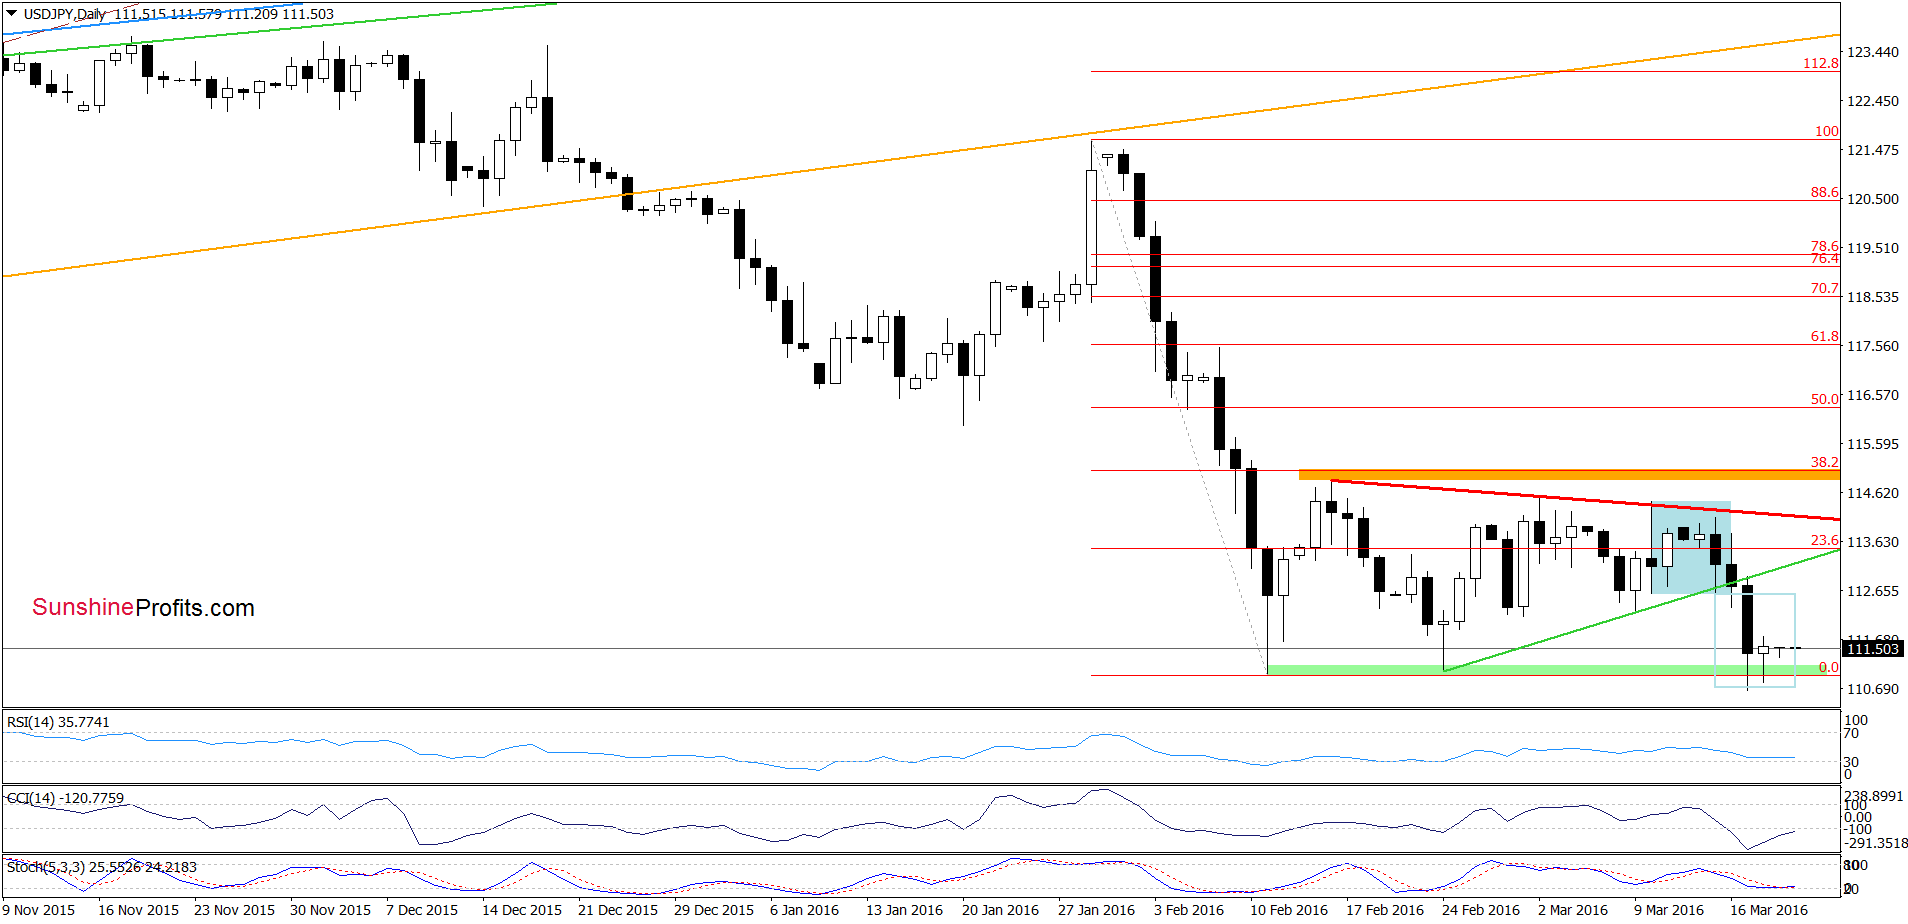
Quoting our previous commentary on this currency pair:
(…) USD/JPY remains in the blue consolidation. Nevertheless, the Stochastic Oscillator generated a sell signal once again, suggesting that the pair will test the green support line based on the previous lows in the coming day. If it is broken, the next downside target would be around 110.96-111.97, where the Feb lows (in terms of intraday lows and the lowest opening prices) are.
As you see on the charts, the situation developed in line with the above scenario and USD/JPY slipped slightly below the green support zone marked on the daily chart. With this downswing, the pair also reached the support line based on the Aug 2008 high and approached the 61.8% Fibonacci retracement (based on the Feb 2014-May 2015 upward move). Additionally, daily and weekly indicators are oversold (and very close to generating buy signals), which suggests that the space for declines may be limited and reversal in the coming week should not surprise us.
Very short-term outlook: mixed
Short-term outlook: mixed
MT outlook: mixed
LT outlook: mixed
Trading position (short-term; our opinion): No positions are justified from the risk/reward perspective at the moment. We will keep you informed should anything change, or should we see a confirmation/invalidation of the above.
USD/CAD
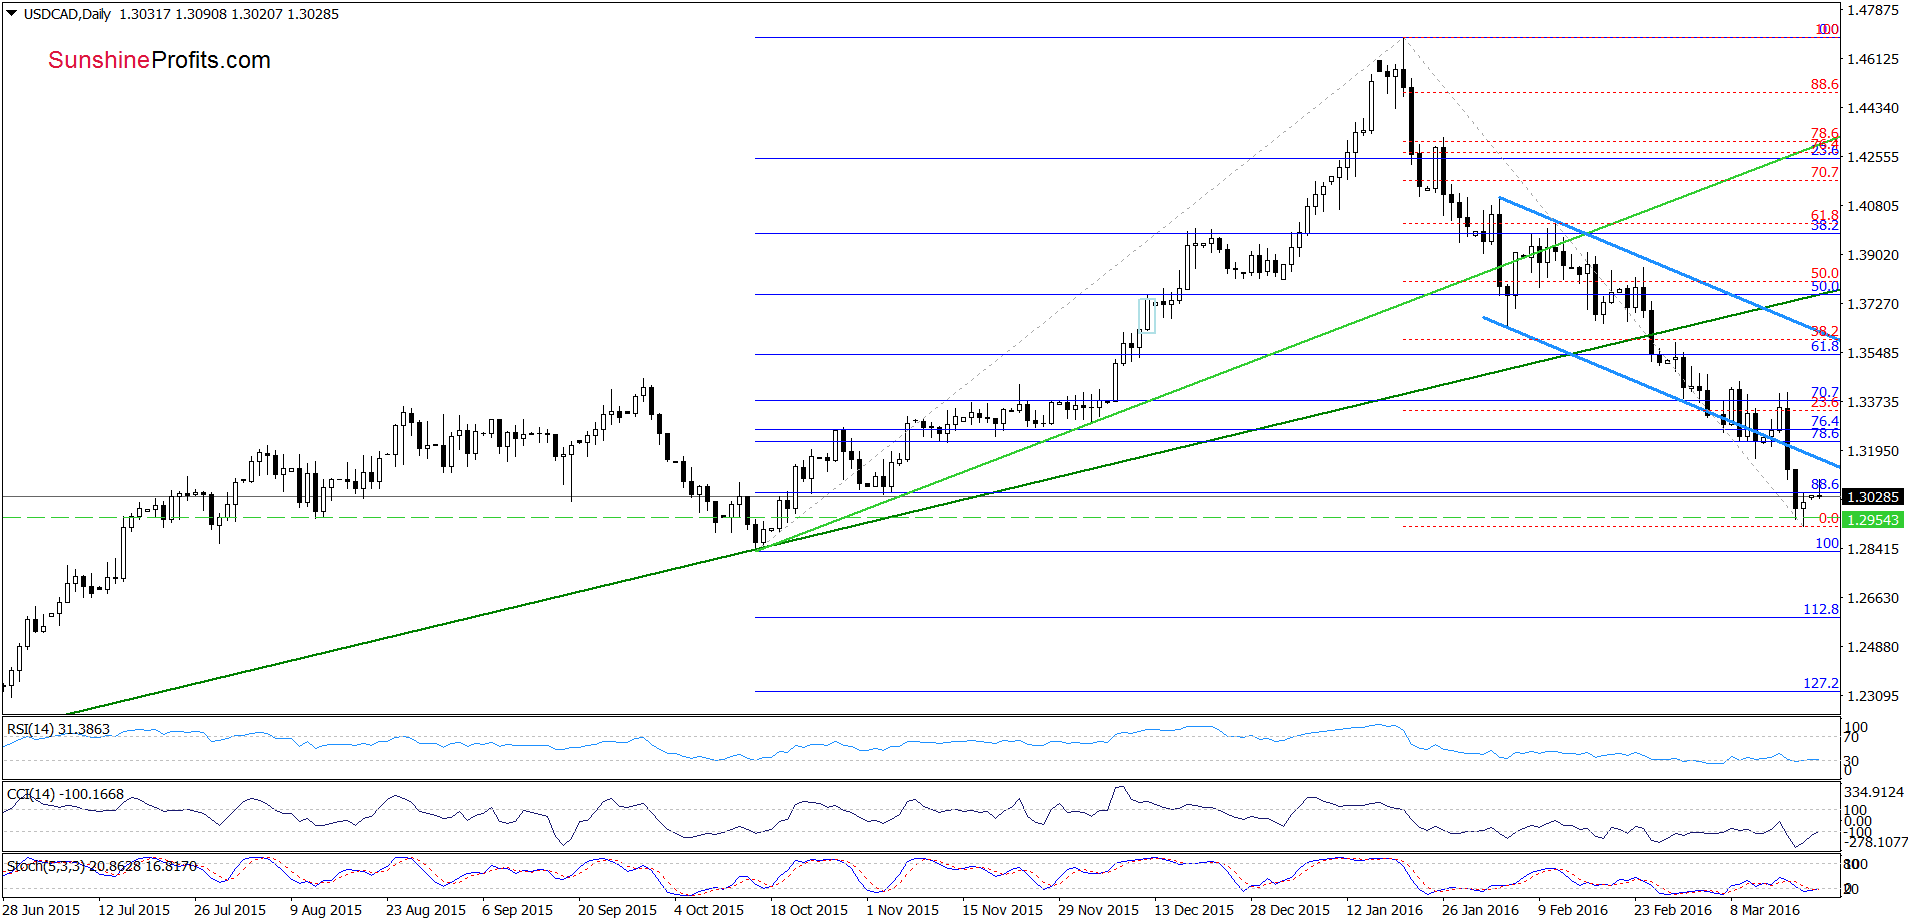
The first thing that catches the eye on the daily chart is a breakdown under the lower border of the blue declining trend channel. This negative signal triggered further deterioration and took USD/CAD under the 88.6% Fibonacci retracement based on the Oct-Jan upward move. Although the exchange rate moved little higher earlier today, we think that as long as there won’t be an invalidation of the breakdown under the lower line of the formation another bigger upward move is not likely to be seen.
What impact did this move have on the medium-term picture? Let’s check.
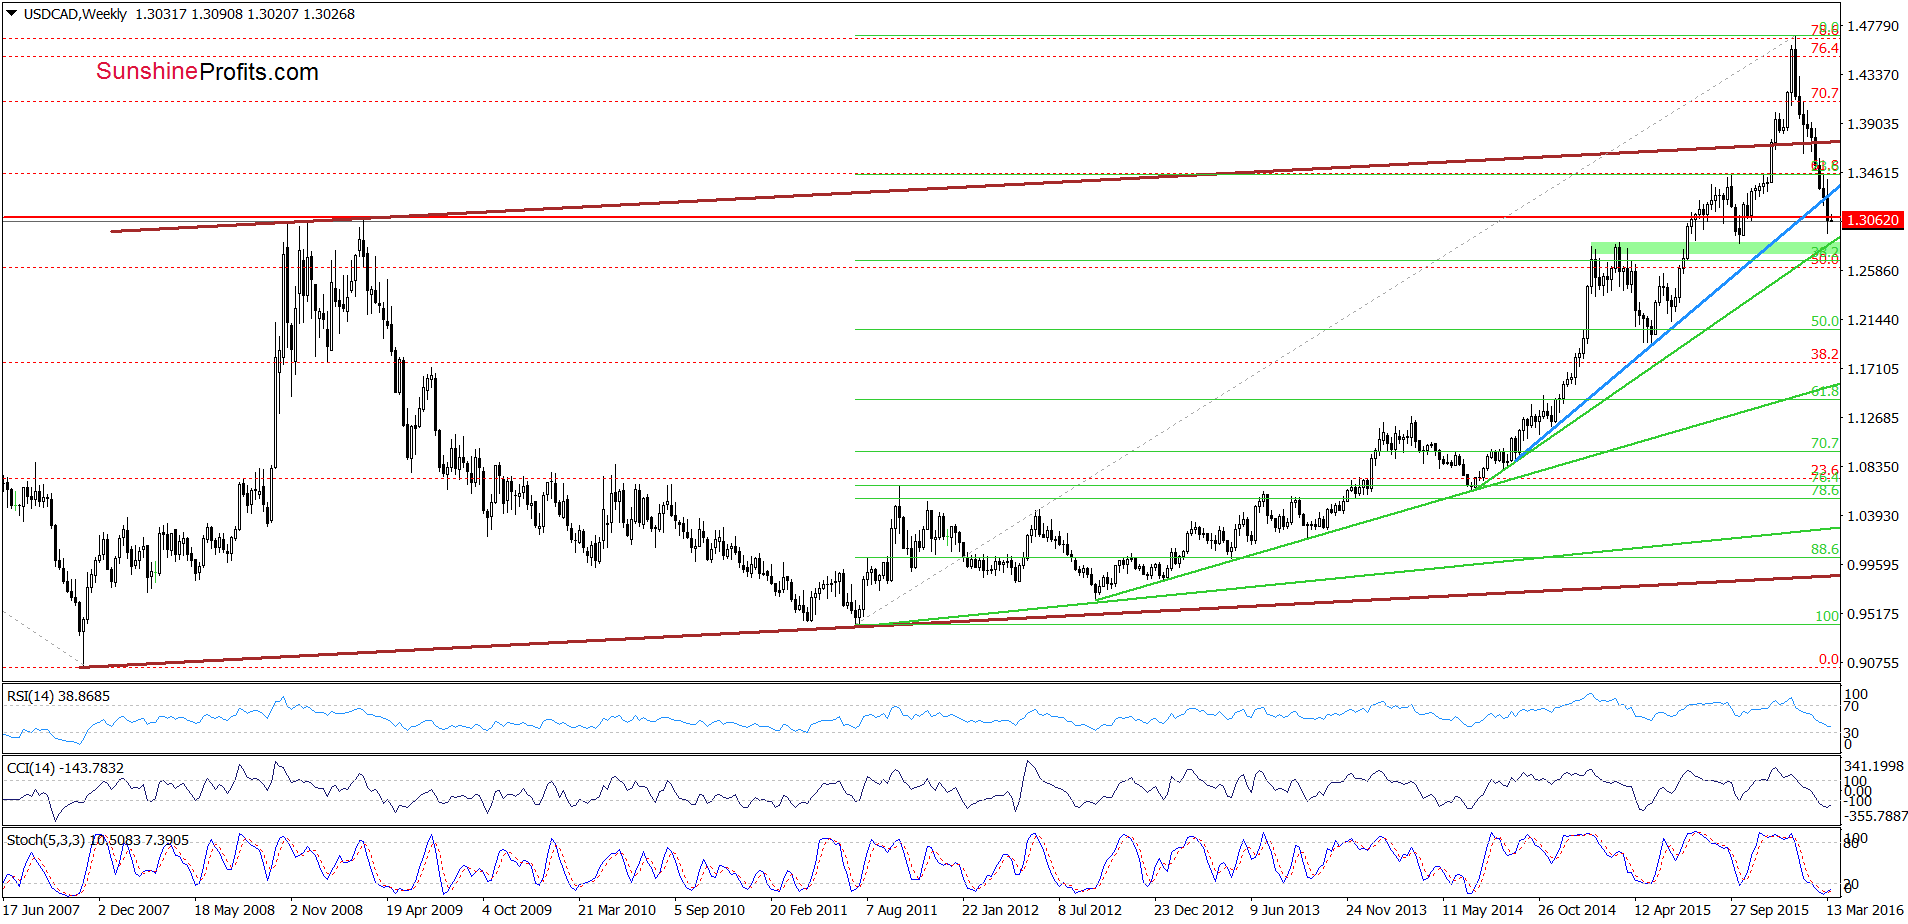
From this perspective, we see that the recent downward move took USD/CAD under the blue support line (based on the Sept 2014 and May 2015 lows), which triggered further deterioration and a drop below the Mar 2009 high. In this way, the pair invalidated earlier breakout, which suggests a test of the Oct low and the green support zone in near future. Nevertheless, daily and weekly indicators are oversold (and very close to generating buy signals), which suggests that the space for declines may be limited and reversal in the coming week should not surprise us.
Very short-term outlook: mixed
Short-term outlook: mixed
MT outlook: mixed
LT outlook: mixed
Trading position (short-term; our opinion): No positions are justified from the risk/reward perspective at the moment. We will keep you informed should anything change, or should we see a confirmation/invalidation of the above.
USD/CHF
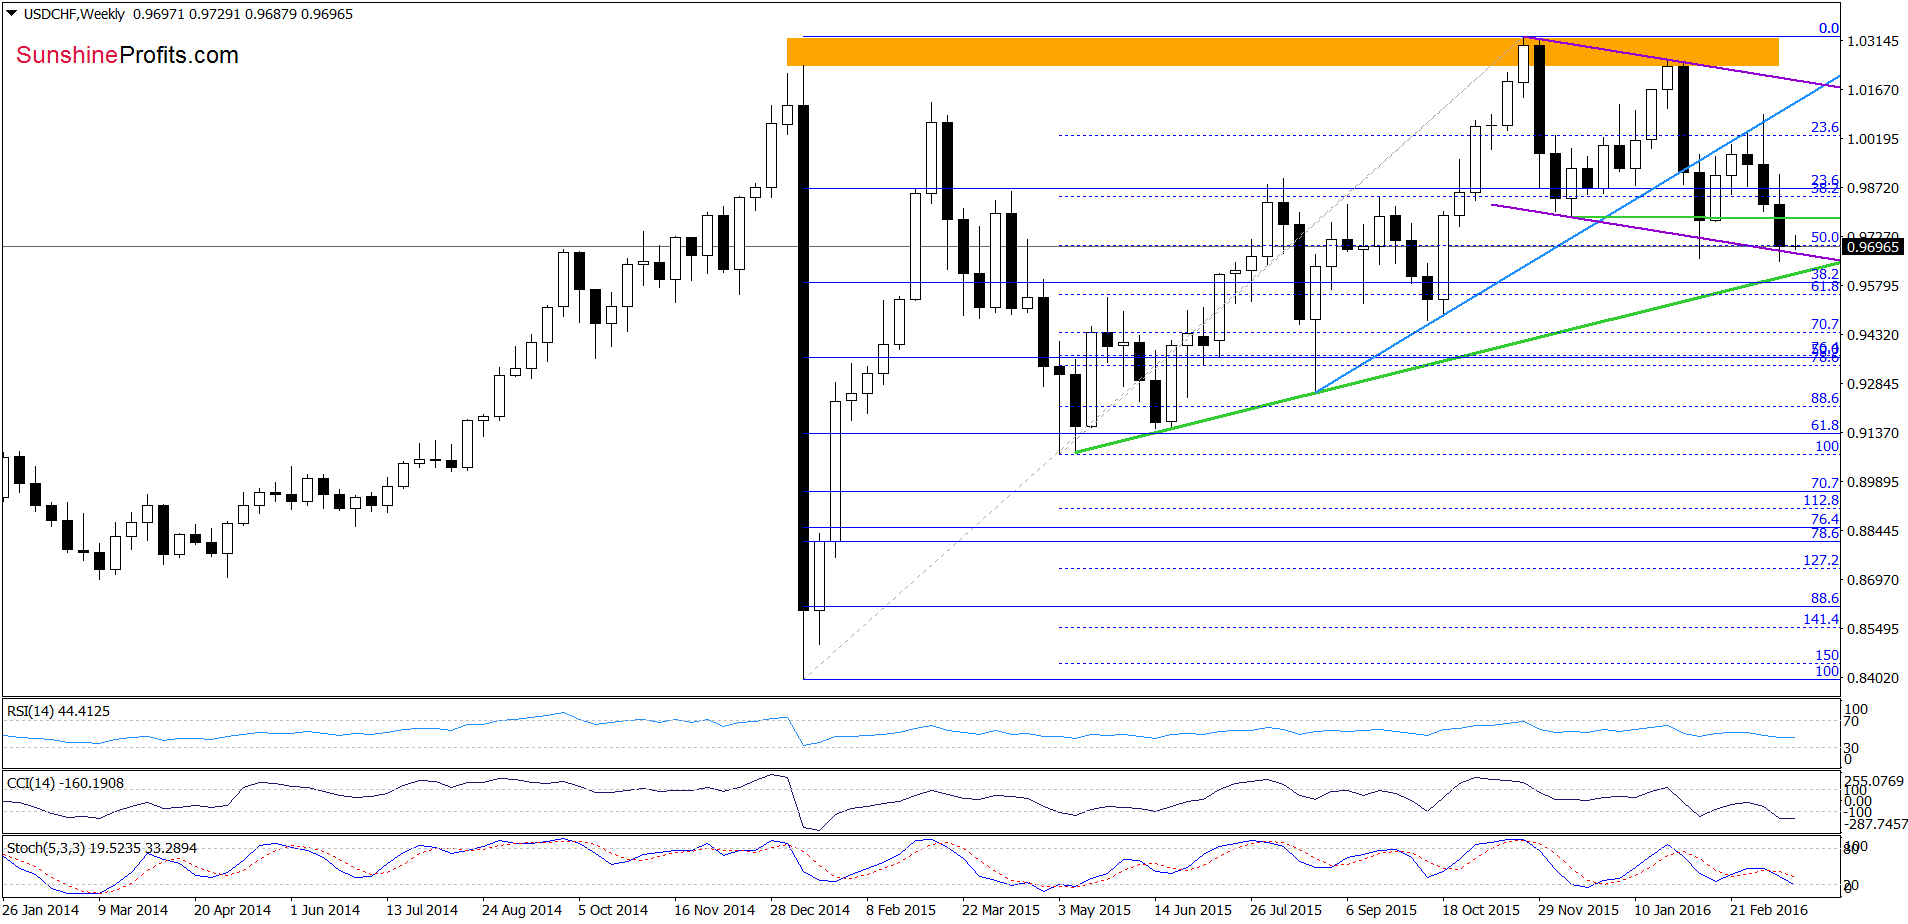
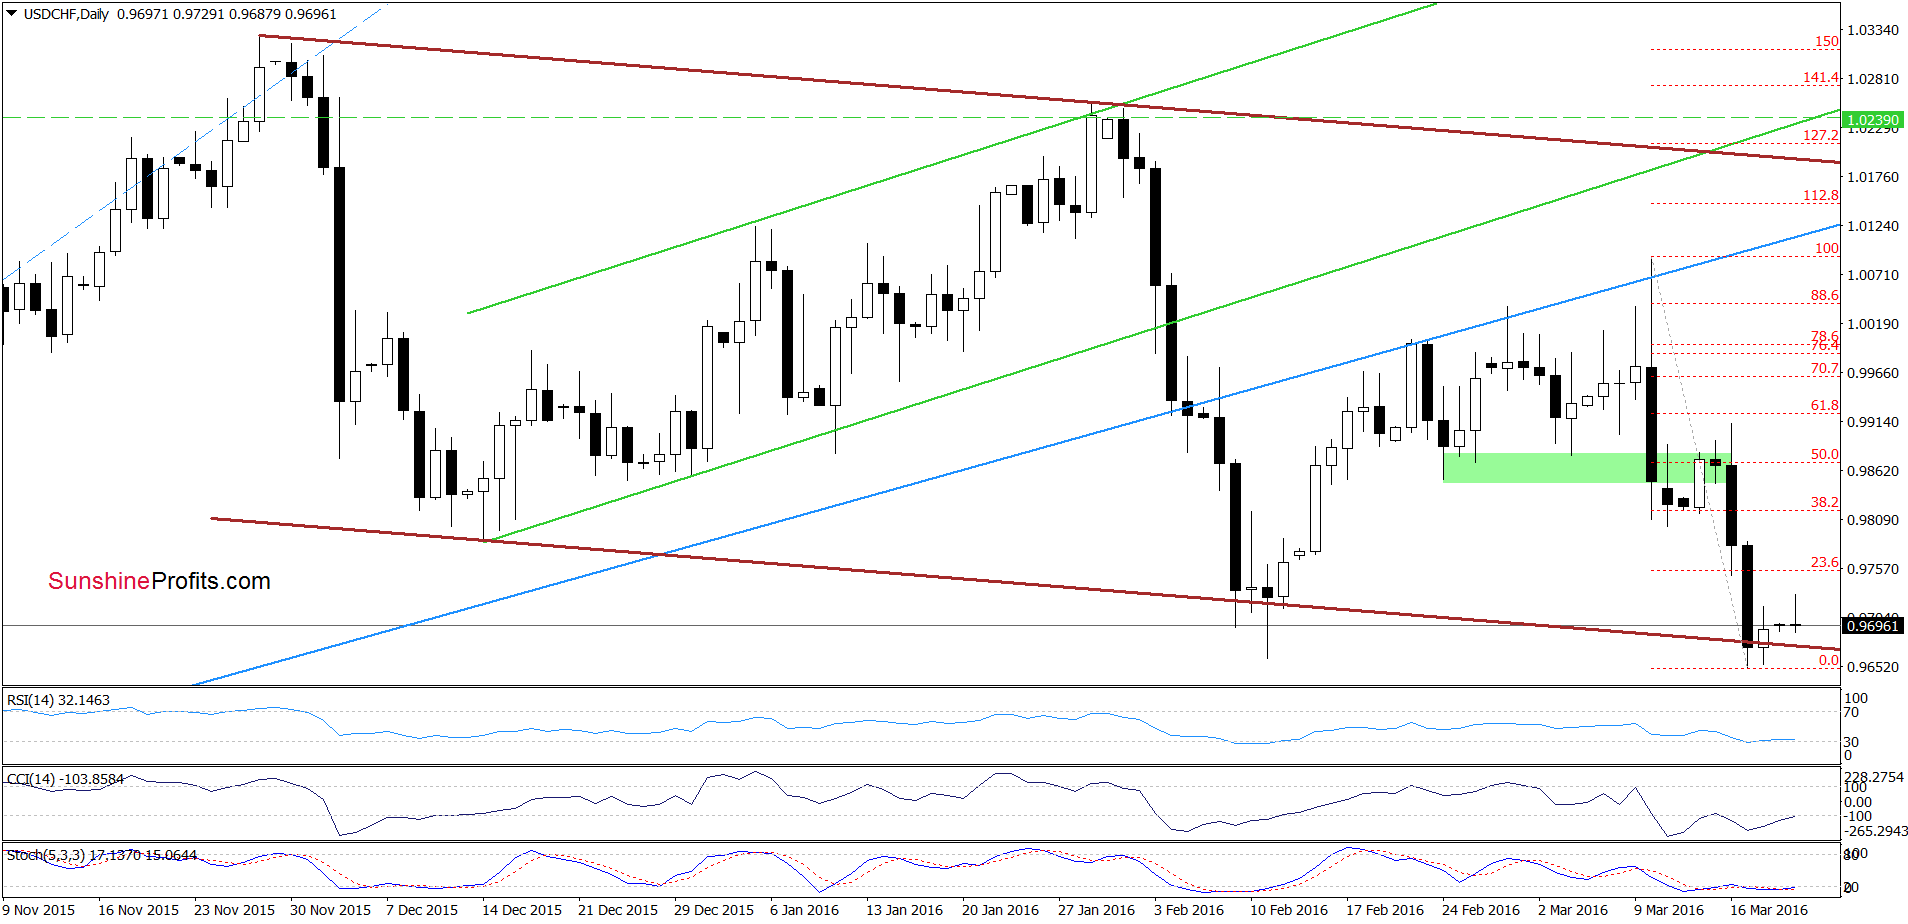
Looking at the above charts, we see that USD/CHF extended losses and declined to the lower border of the brown declining trend channel at the end of the previous week. With this move that pair also reached the 50% Fibonacci retracement (based on the May-Nov upward move) and approached the medium-term green support line based on the May, Jun and Aug lows. When we take a closer look at the daily chart, we notice that we saw similar price action in the previous month. Back then, an invalidation of the breakdown under the lower line of the trend channel triggered an upward move to the blue resistance line, which suggests that we may see similar price action in the coming days. Nevertheless, we’ll wait for buy signals before we decide to re-open long positions.
Very short-term outlook: mixed
Short-term outlook: mixed
MT outlook: mixed
LT outlook: mixed
Trading position (short-term; our opinion): No positions are justified from the risk/reward perspective. We will keep you informed should anything change, or should we see a confirmation/invalidation of the above.
AUD/USD
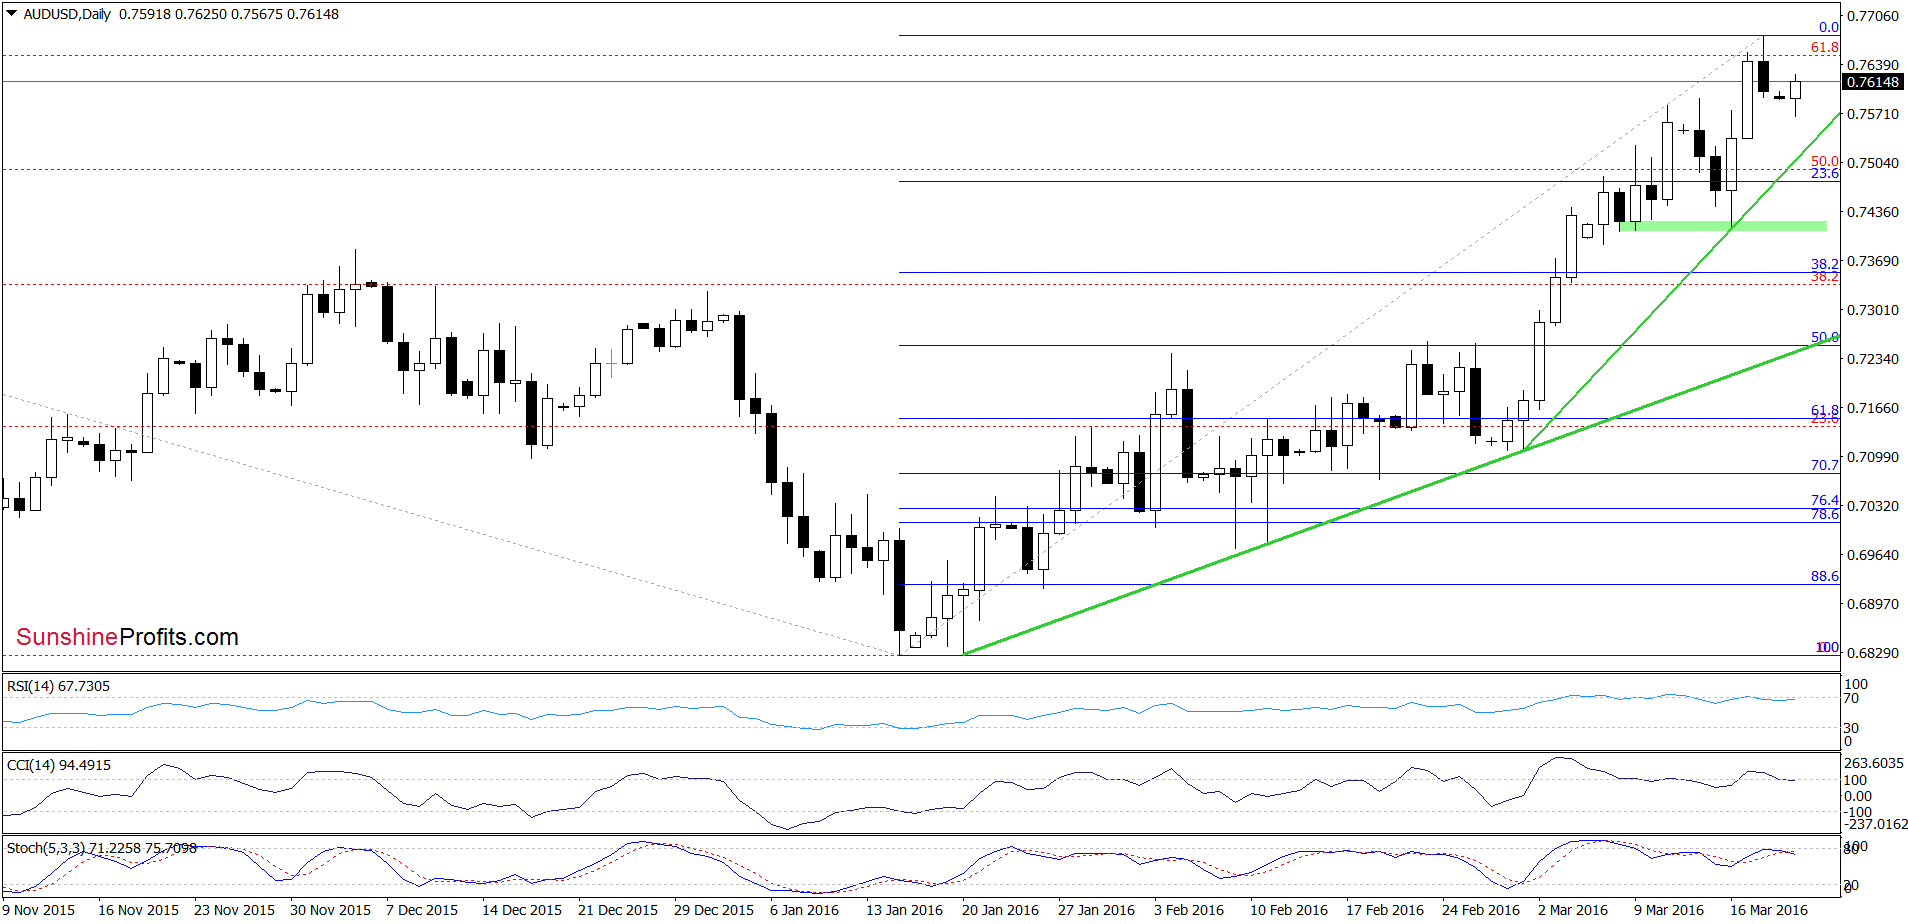
On the daily chart, we see that AUD/USD extended gains and hit a fresh March high on Friday. With this upward move, the pair reached the 61.8% Fibonacci retracement (based on the May-Feb decline), which triggered a small pullback. Will we see further deterioration? Let’s examine the medium-term chart and look for more clues about future moves.
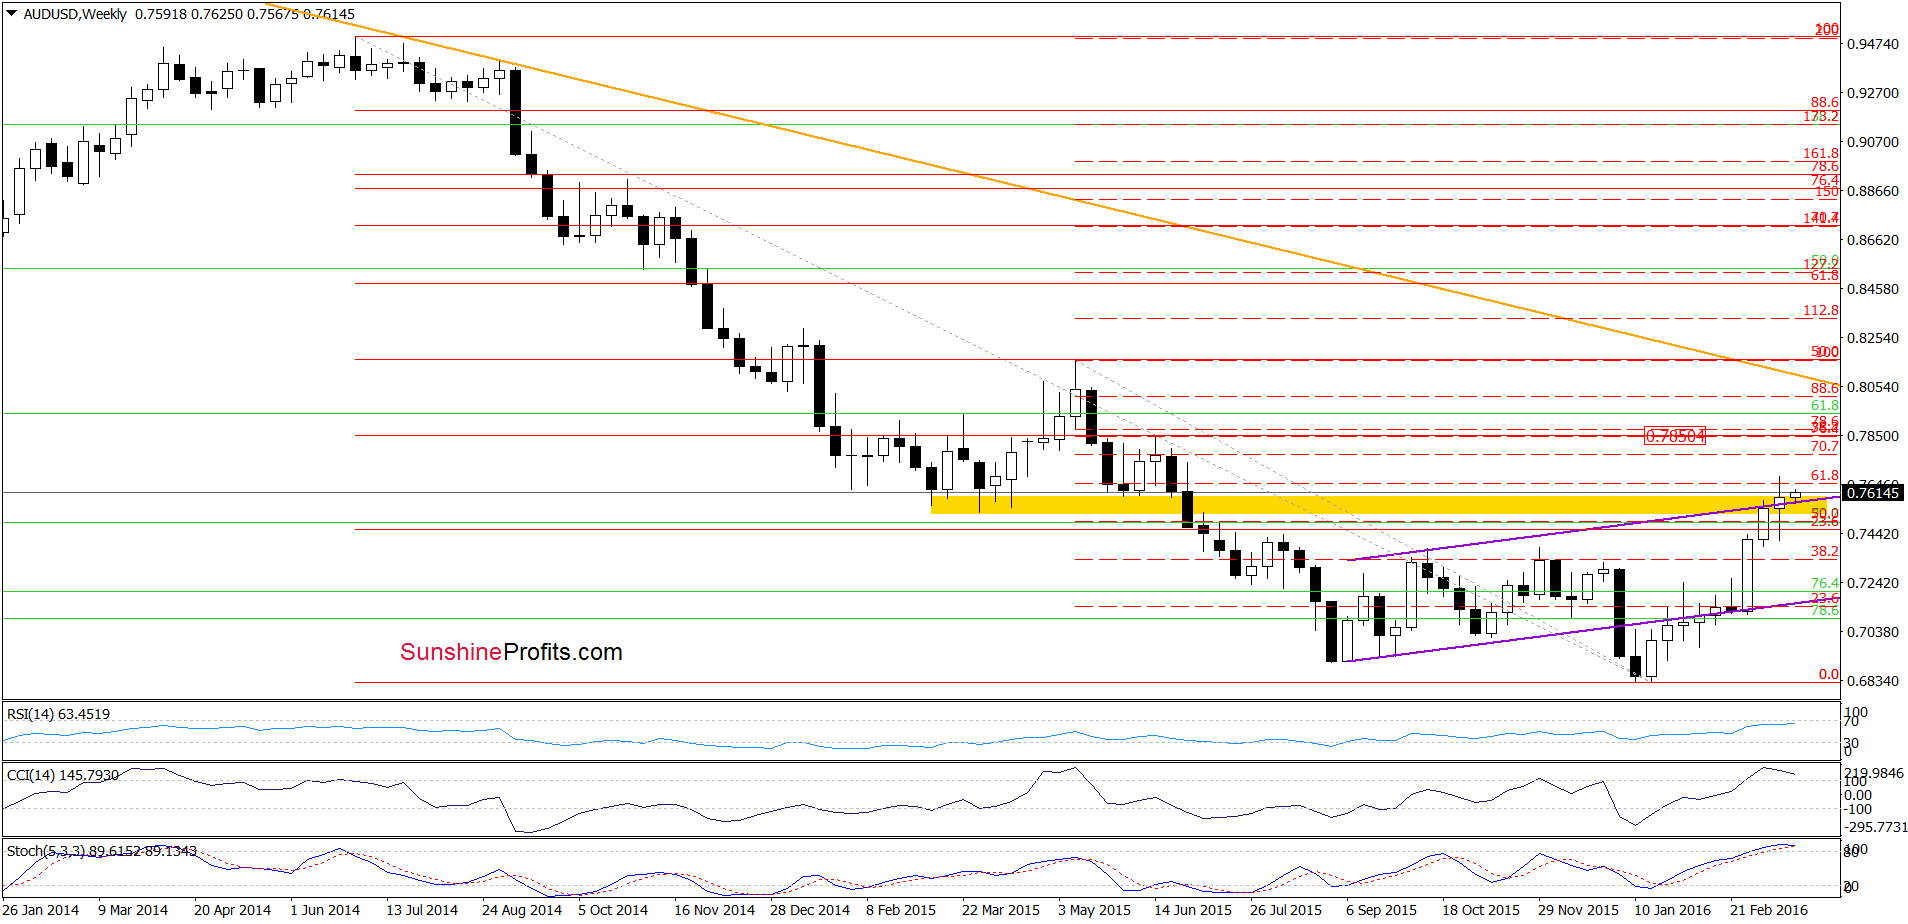
From this perspective we see that although the 61.8% retracement triggered a small pullback, the previously-broken upper border of the purple rising trend channel stopped currency bears. As a result, AUD/USD moved higher earlier today, which suggests a test of the recent high. If it is broken, we may see an increase even to 0.7769, where the 70.7% Fibonacci retracement is. Nevertheless, the current position of the daily (all indicators generated sell signals) and weekly indicators suggests that the space for rally may be limited and reversal in the coming week should not surprise us.
Very short-term outlook: mixed
Short-term outlook: mixed
MT outlook: mixed
LT outlook: mixed
Trading position (short-term; our opinion): No positions are justified from the risk/reward perspective. We will keep you informed should anything change, or should we see a confirmation/invalidation of the above.
Thank you.
Nadia Simmons
Forex & Oil Trading Strategist
Przemyslaw Radomski, CFA
Founder, Editor-in-chief
Gold & Silver Trading Alerts
Forex Trading Alerts
Oil Investment Updates
Oil Trading Alerts

