

Forex Trading Alert originally sent to subscribers on March 22, 2016, 10:57 AM.
Earlier today, official data showed that the U.K. rate of consumer price inflation increased by 0.3% in Feb, missing analysts’ forecasts. Additionally, although month-over-month consumer prices rose by 0.2% in the previous month, the data disappointed market participants, which pushed GBP/USD under 1.4300. How low could the pair go in the coming days?
In our opinion the following forex trading positions are justified - summary:
- EUR/USD: short (stop-loss order at 1.1512; initial downside target at 1.0572)
- GBP/USD: none
- USD/JPY: none
- USD/CAD: none
- USD/CHF: none
- AUD/USD: none
EUR/USD
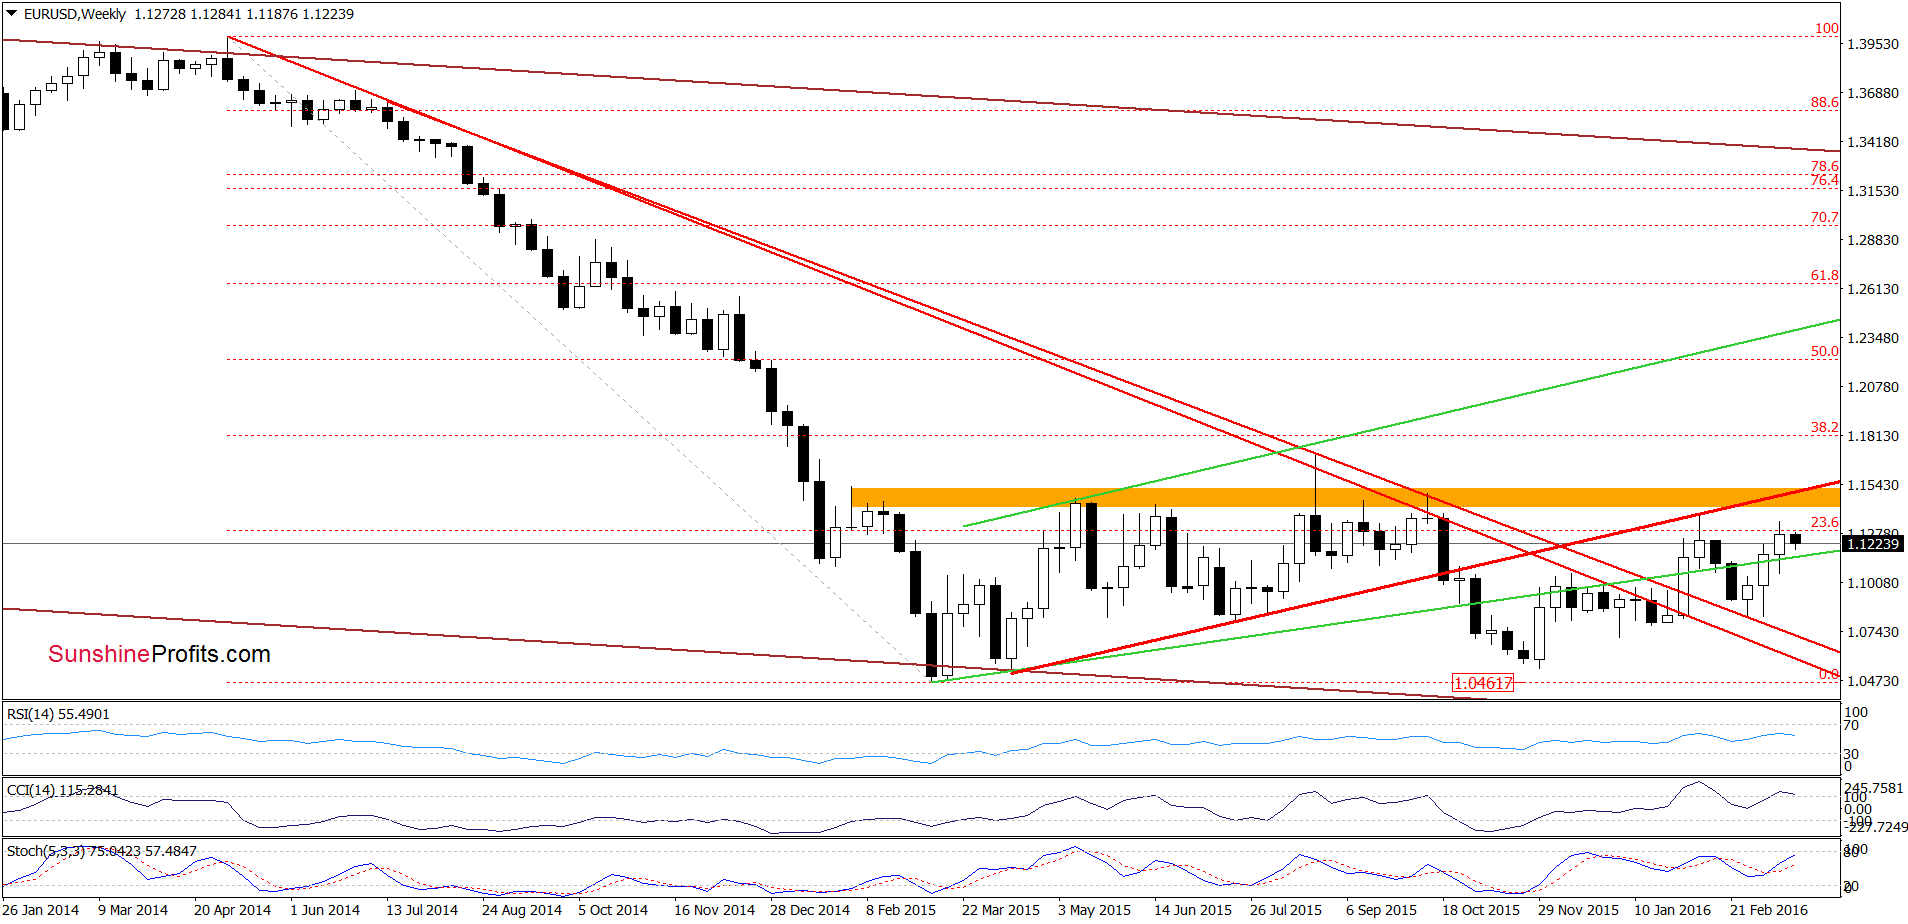
Looking at the weekly chart, we see that EUR/USD moved little lower, which means that what we wrote yesterday is up-to-date:
(…) the key resistance zone (marked with orange and reinforced by the red resistance line based on the Apr and Jul lows) continues to keep gains in check. Therefore, we believe that as long as there will be no breakout above this area lower values of the exchange rate are very likely.
Having said the above, let’s focus on the very short-term changes.
Yesterday, we wrote:
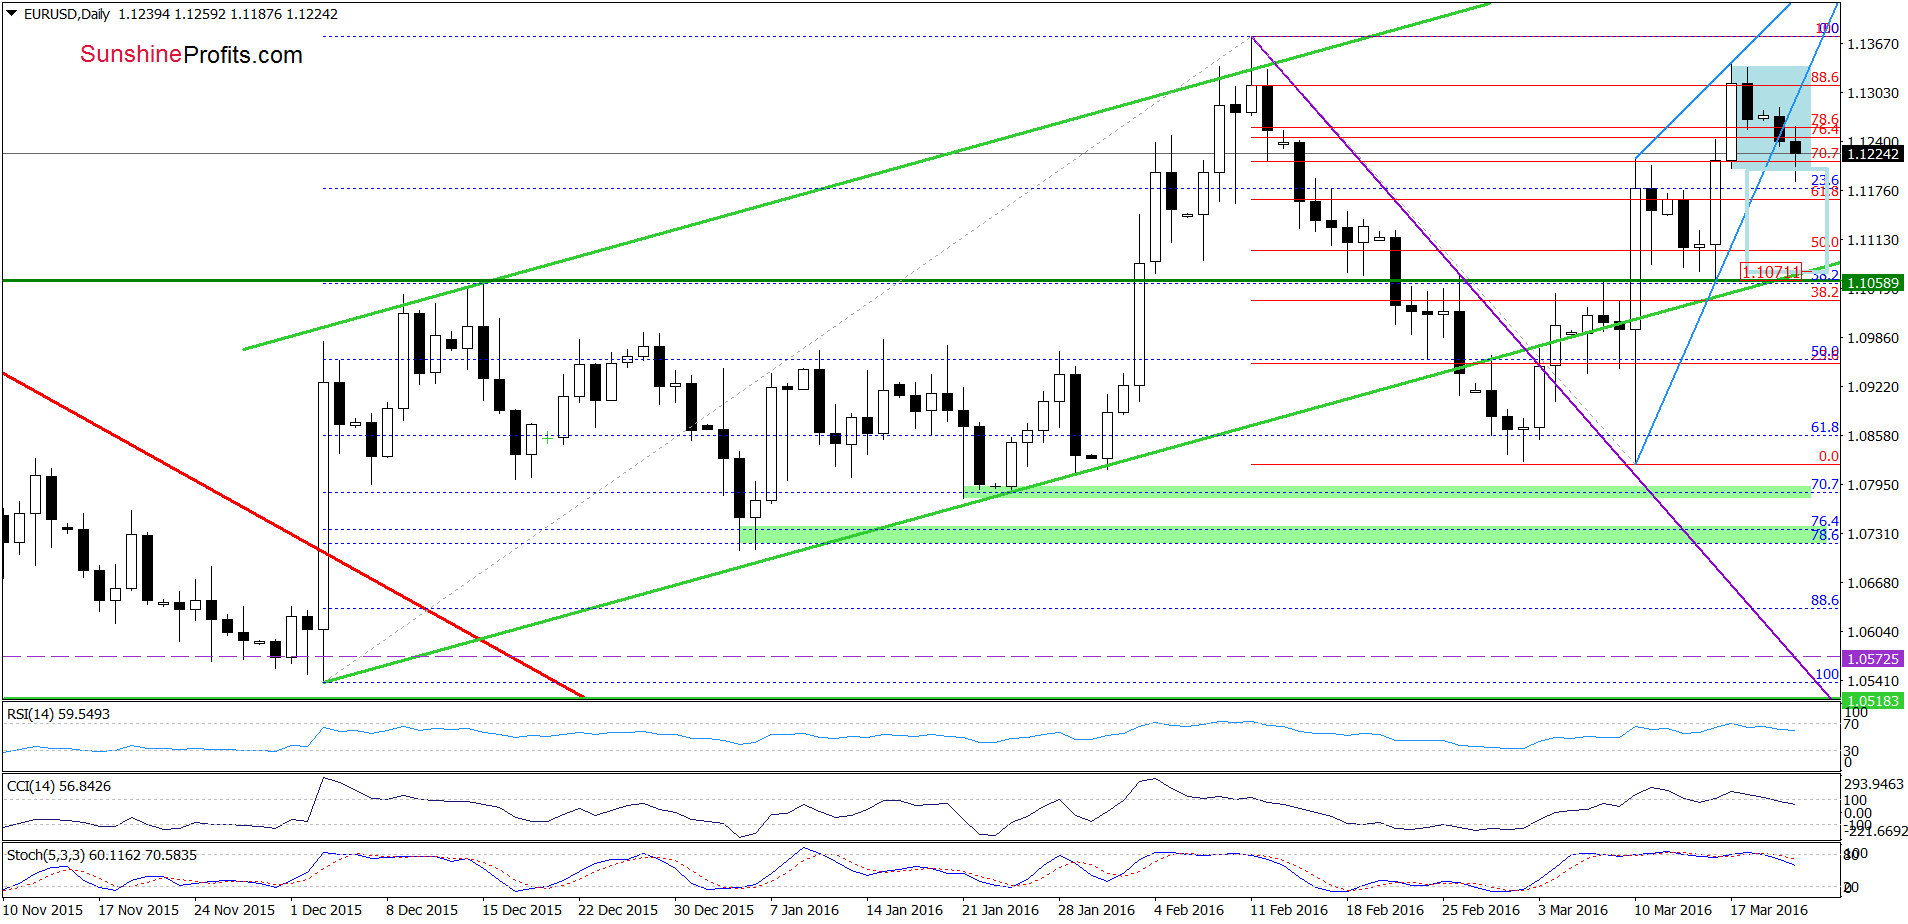
(…) the exchange rate is consolidating in a narrow range inside the blue rising wedge. This suggests that the breakdown under the lower border of the formation (or a breakout above the upper line) will trigger another bigger move. What’s next? Taking into account the proximity to the Feb high and the current position of the indicators (they generated sell signals), we believe that the next move will be to the downside and EUR/USD will re-test the lower border of the green rising trend channel in the coming week.
From today’s point of view, we see that currency bears pushed the pair lower as we had expected. With this move, EUR/USD declined not only under the lower border of the blue rising wedge, but also below the lower line of the blue consolidation, which suggests further deterioration and a drop to around 1.1071, where the size of the move will correspond to the height of the formation. In this area is also the lower border of the green rising trend channel and he green horizontal support line, which together could pause further declines.
Very short-term outlook: bearish
Short-term outlook: bearish
MT outlook: mixed with bearish bias
LT outlook: mixed
Trading position (short-term; our opinion): Short positions (with a stop-loss order at 1.1512 and the initial downside target at 1.0572) are justified from the risk/reward perspective. We will keep you informed should anything change, or should we see a confirmation/invalidation of the above.
GBP/USD
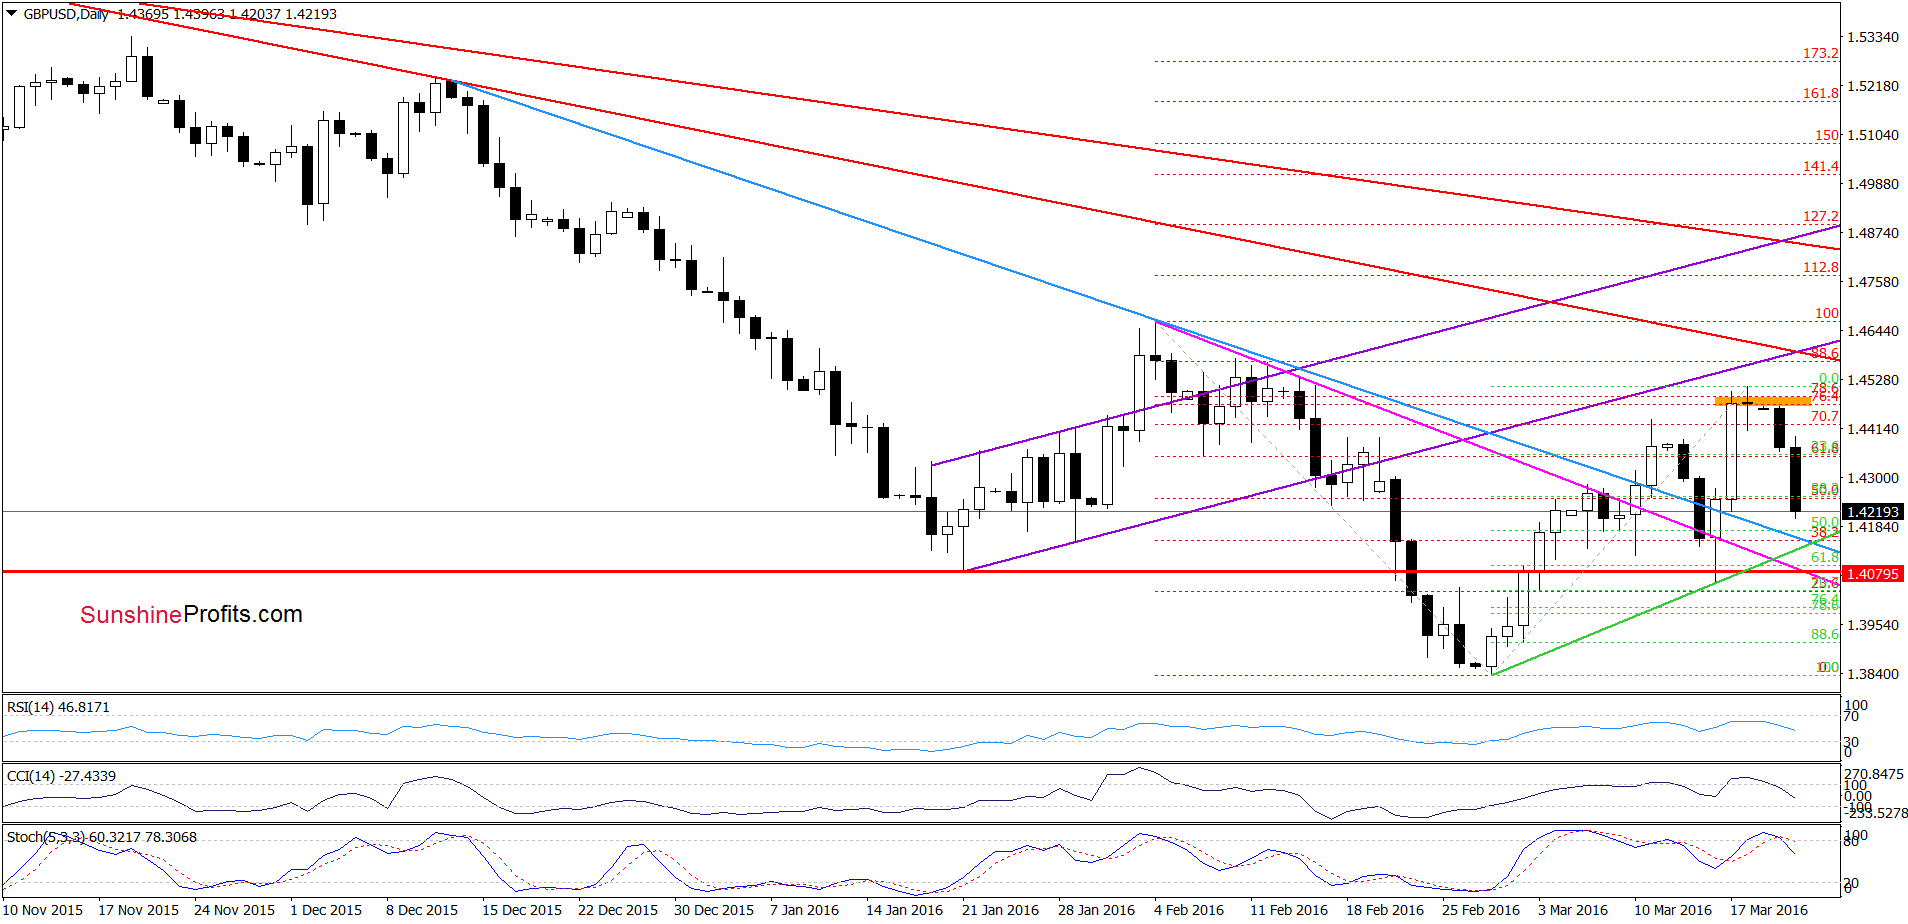
On the daily chart, we see that the orange resistance zone (created by the 76.4% and 78.6% Fibonacci retracement levels) encouraged currency bears to act, which means that our last commentary on this currency pair is up-to-date:
(…) the CCI generated a sell signal, while the Stochastic Oscillator is very close to doing the same, which suggests that further deterioration is just around the corner. If this is the case and GBP/USD declines from here, the initial downside target would be the blue declining line, which serves as the short-term support at the moment.
Very short-term outlook: bearish
Short-term outlook: mixed with bearish bias
MT outlook: mixed
LT outlook: mixed
Trading position (short-term; our opinion): No positions are justified from the risk/reward perspective at the moment. We will keep you informed should anything change, or should we see a confirmation/invalidation of the above.
USD/CHF
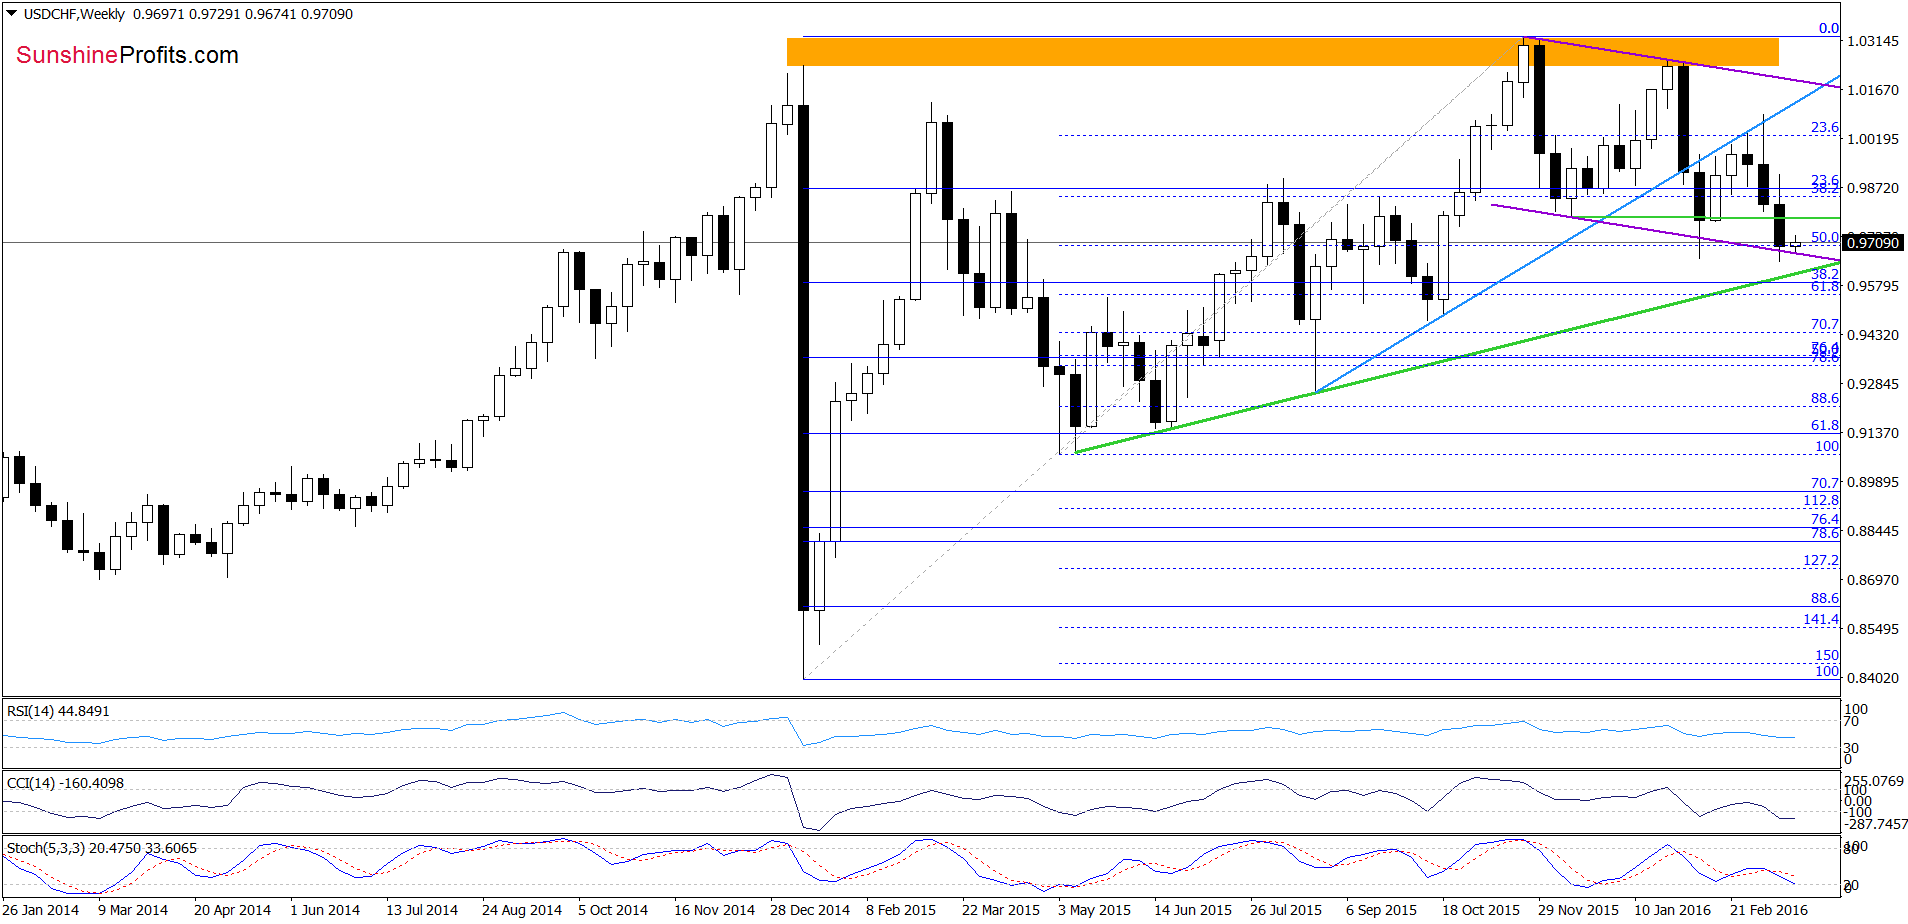
Quoting our previous alert:
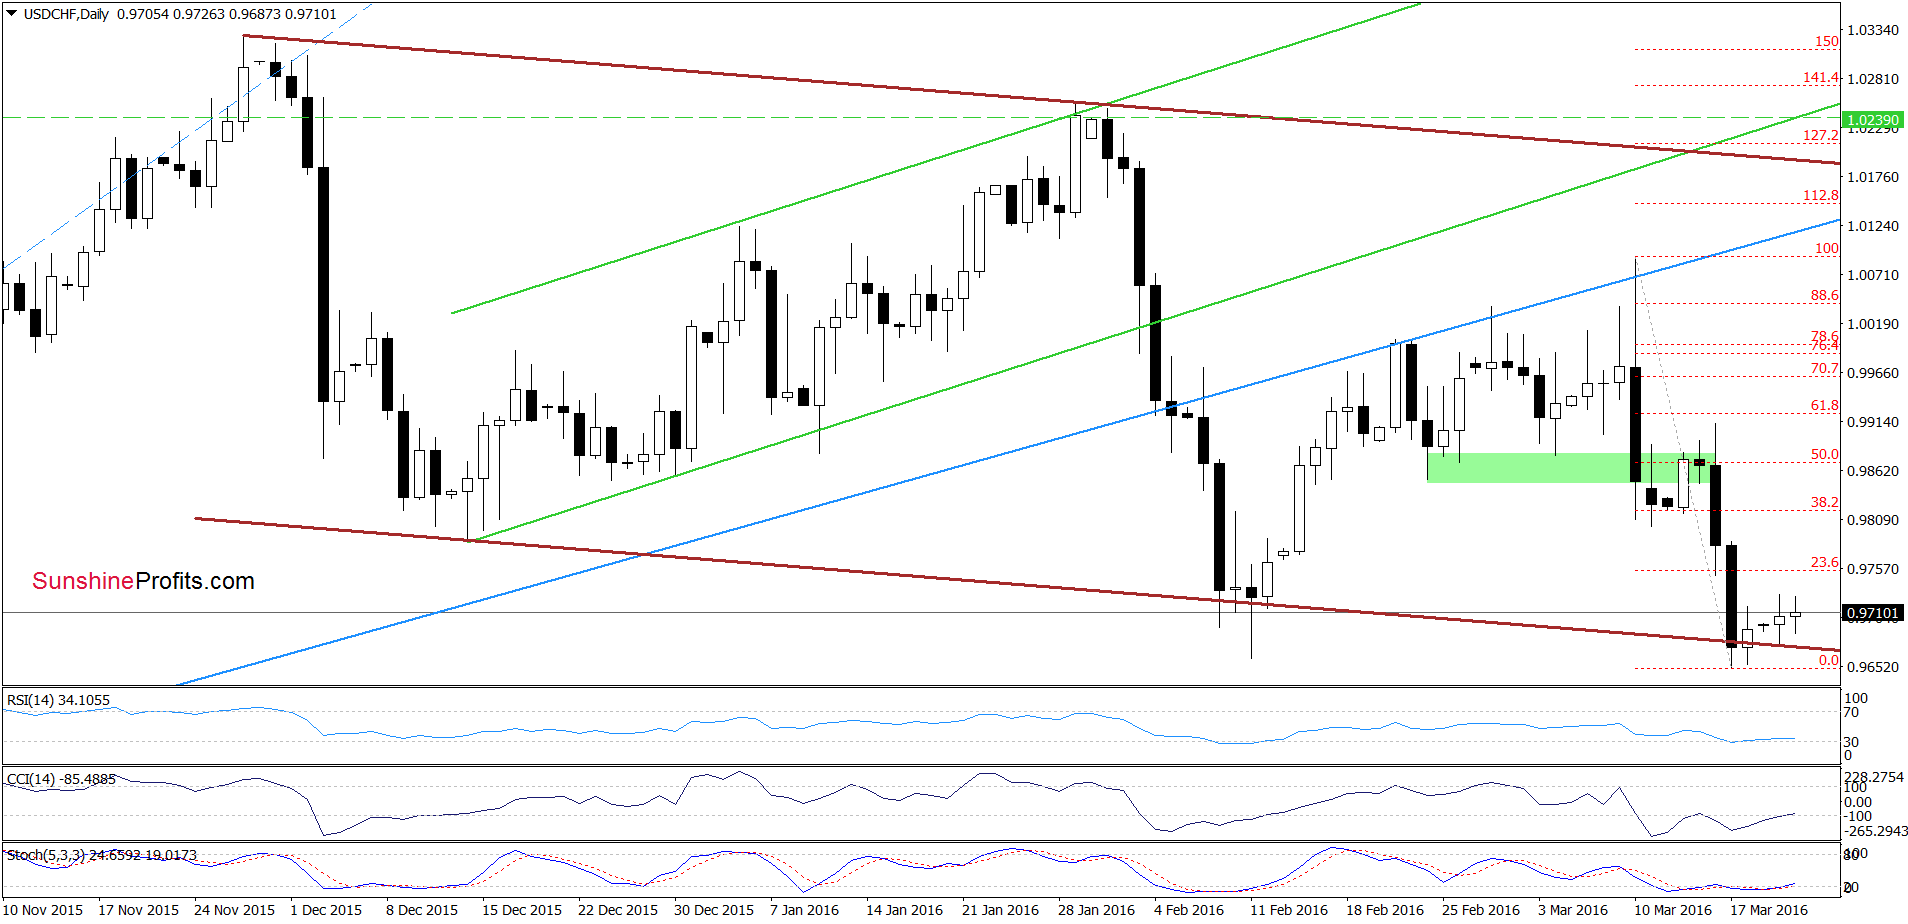
(…) USD/CHF extended losses and declined to the lower border of the brown declining trend channel at the end of the previous week. With this move that pair also reached the 50% Fibonacci retracement (based on the May-Nov upward move) and approached the medium-term green support line based on the May, Jun and Aug lows. When we take a closer look at the daily chart, we notice that we saw similar price action in the previous month. Back then, an invalidation of the breakdown under the lower line of the trend channel triggered an upward move to the blue resistance line, which suggests that we may see similar price action in the coming days.
As you see on the charts, USD/CHF remains slightly above the lower border of the brown declining trend channel, which means that an invalidation of the breakdown and its positive effect is still in play. Additionally, the CCI and Stochastic Oscillator generated buy signals, which increases the probability of further improvement. Nevertheless, we’ll wait for another daily closure inside the trade channel before we decide to re-open long positions.
Very short-term outlook: mixed with bullish bias
Short-term outlook: mixed
MT outlook: mixed
LT outlook: mixed
Trading position (short-term; our opinion): No positions are justified from the risk/reward perspective. We will keep you informed should anything change, or should we see a confirmation/invalidation of the above.
Thank you.
Nadia Simmons
Forex & Oil Trading Strategist
Przemyslaw Radomski, CFA
Founder, Editor-in-chief
Gold & Silver Trading Alerts
Forex Trading Alerts
Oil Investment Updates
Oil Trading Alerts
