

Forex Trading Alert originally sent to subscribers on December 15, 2015, 11:26 AM.
Although the U.S. Commerce Department showed that consumer prices were unchanged from a month earlier, year-over-year consumer prices increased by 0.5%, beating expectations for a 0.4% gain. Additionally, core CPI (without food and energy costs) increased by 0.2%, meeting expectations and supporting the greenback. As a result, the U.S. dollar moved higher against its Canadian counterpart, but will we see further rally?
In our opinion the following forex trading positions are justified - summary:
EUR/USD
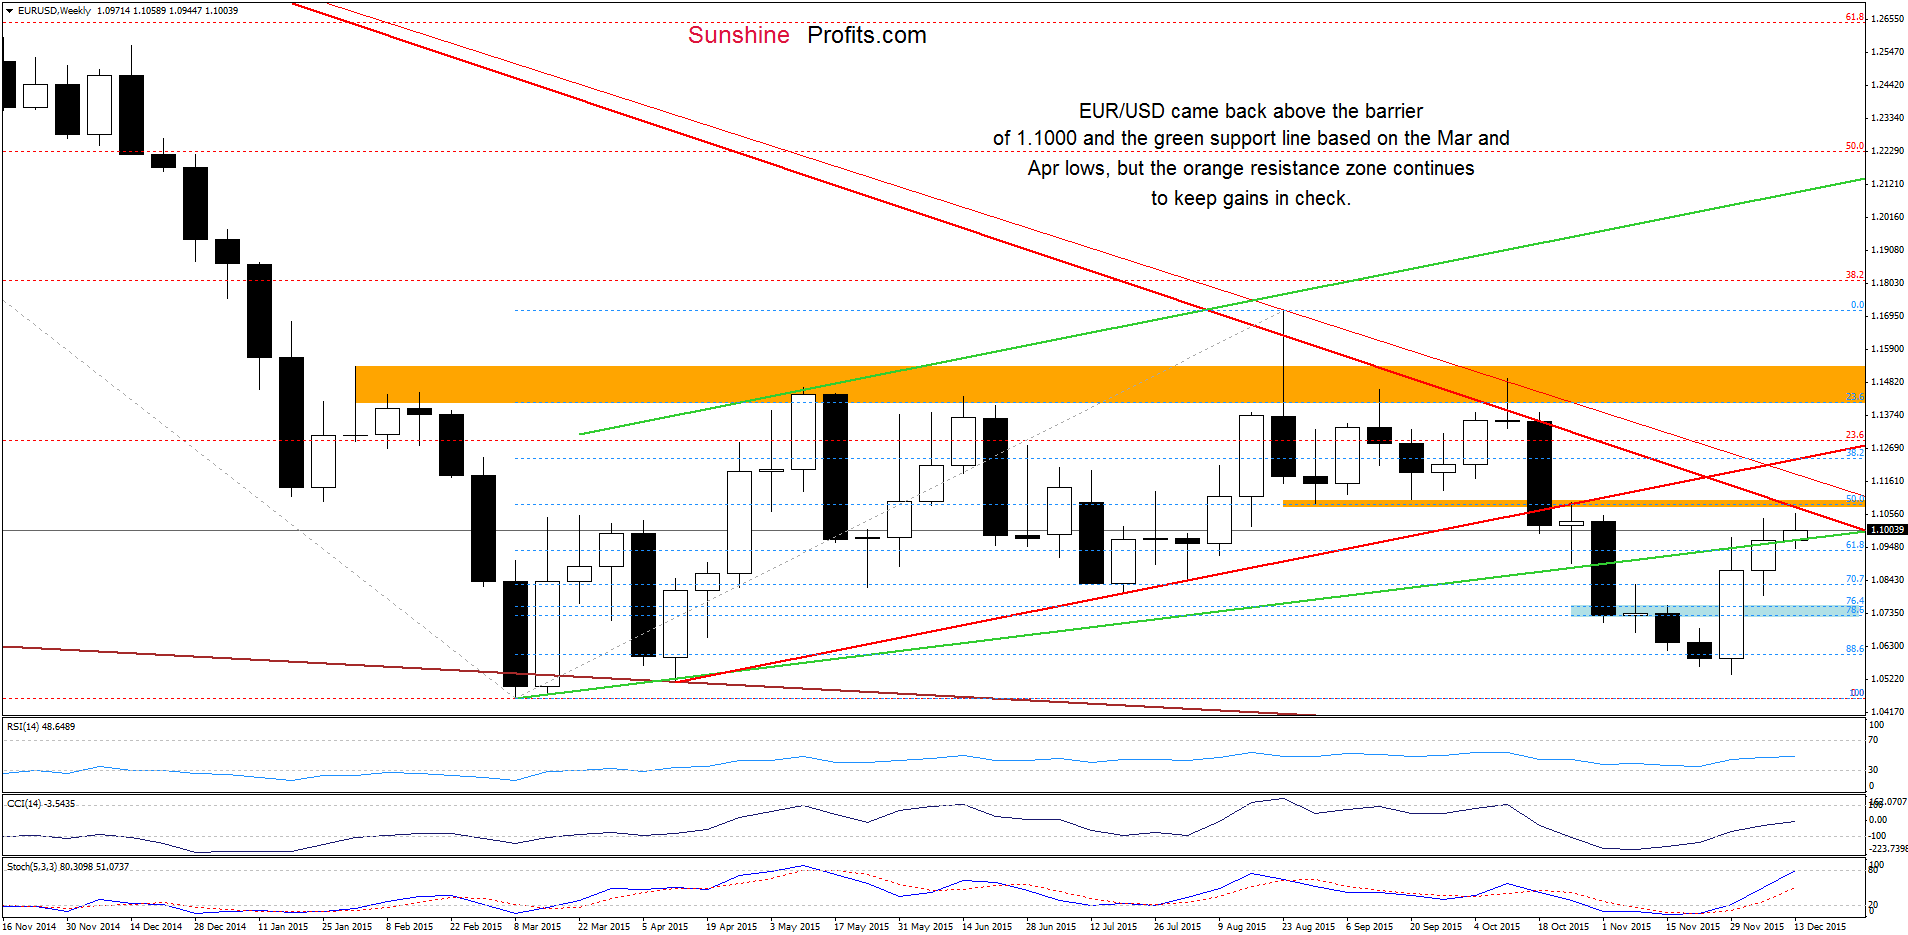
Looking at the weekly chart, we see that EUR/USD came back above the barrier of 1.1000 and the green line based on the Mar and Apr lows, but the orange resistance zone and the long-term red declining resistance line continue to keep gains in check.
Having said that, let’s examine the daily chart.
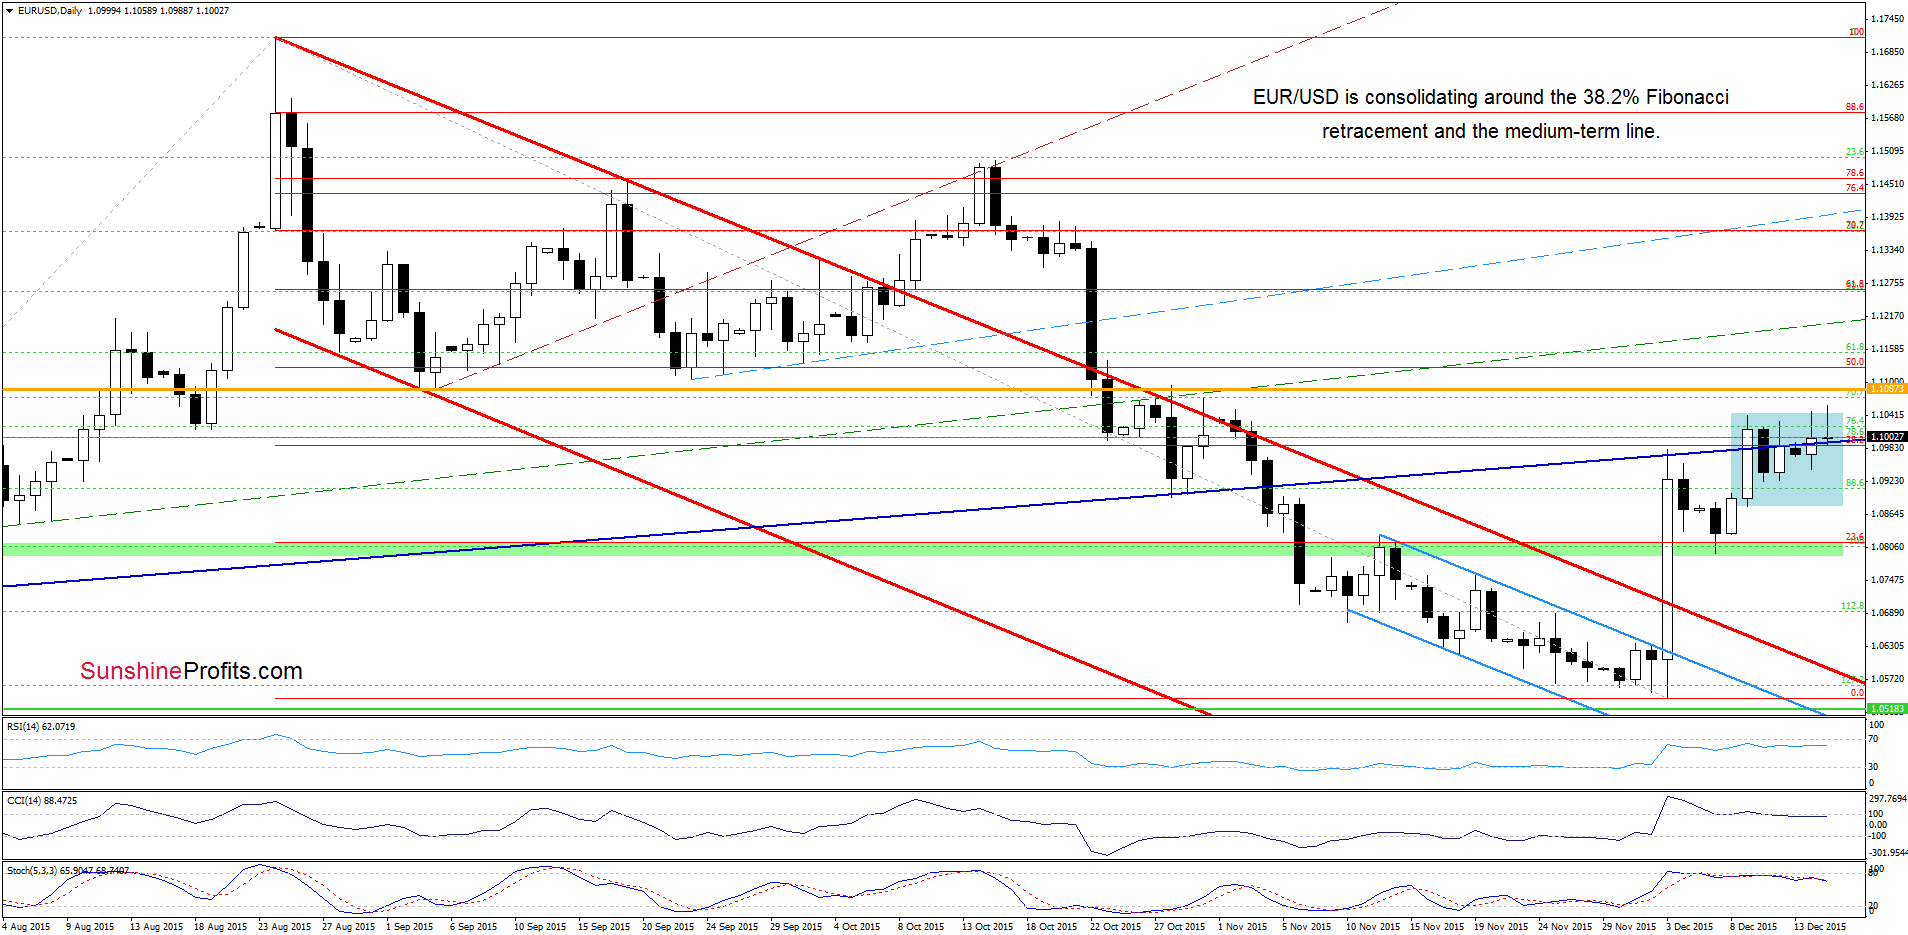
From this perspective, we see that EUR/USD is still consolidating around the 38.2% Fibonacci retracement and the navy blue support/resistance line. As you see although there were attempts to break above the upper line of the formation they all failed, which suggests that further deterioration is just around the corner – especially when we factor in the current position of the indicators.
Very short-term outlook: mixed with bearish bias
Short-term outlook: mixed
MT outlook: mixed
LT outlook: mixed
Trading position (short-term; our opinion): No positions are justified from the risk/reward perspective at the moment. We will keep you informed should anything change, or should we see a confirmation/invalidation of the above.
GBP/USD
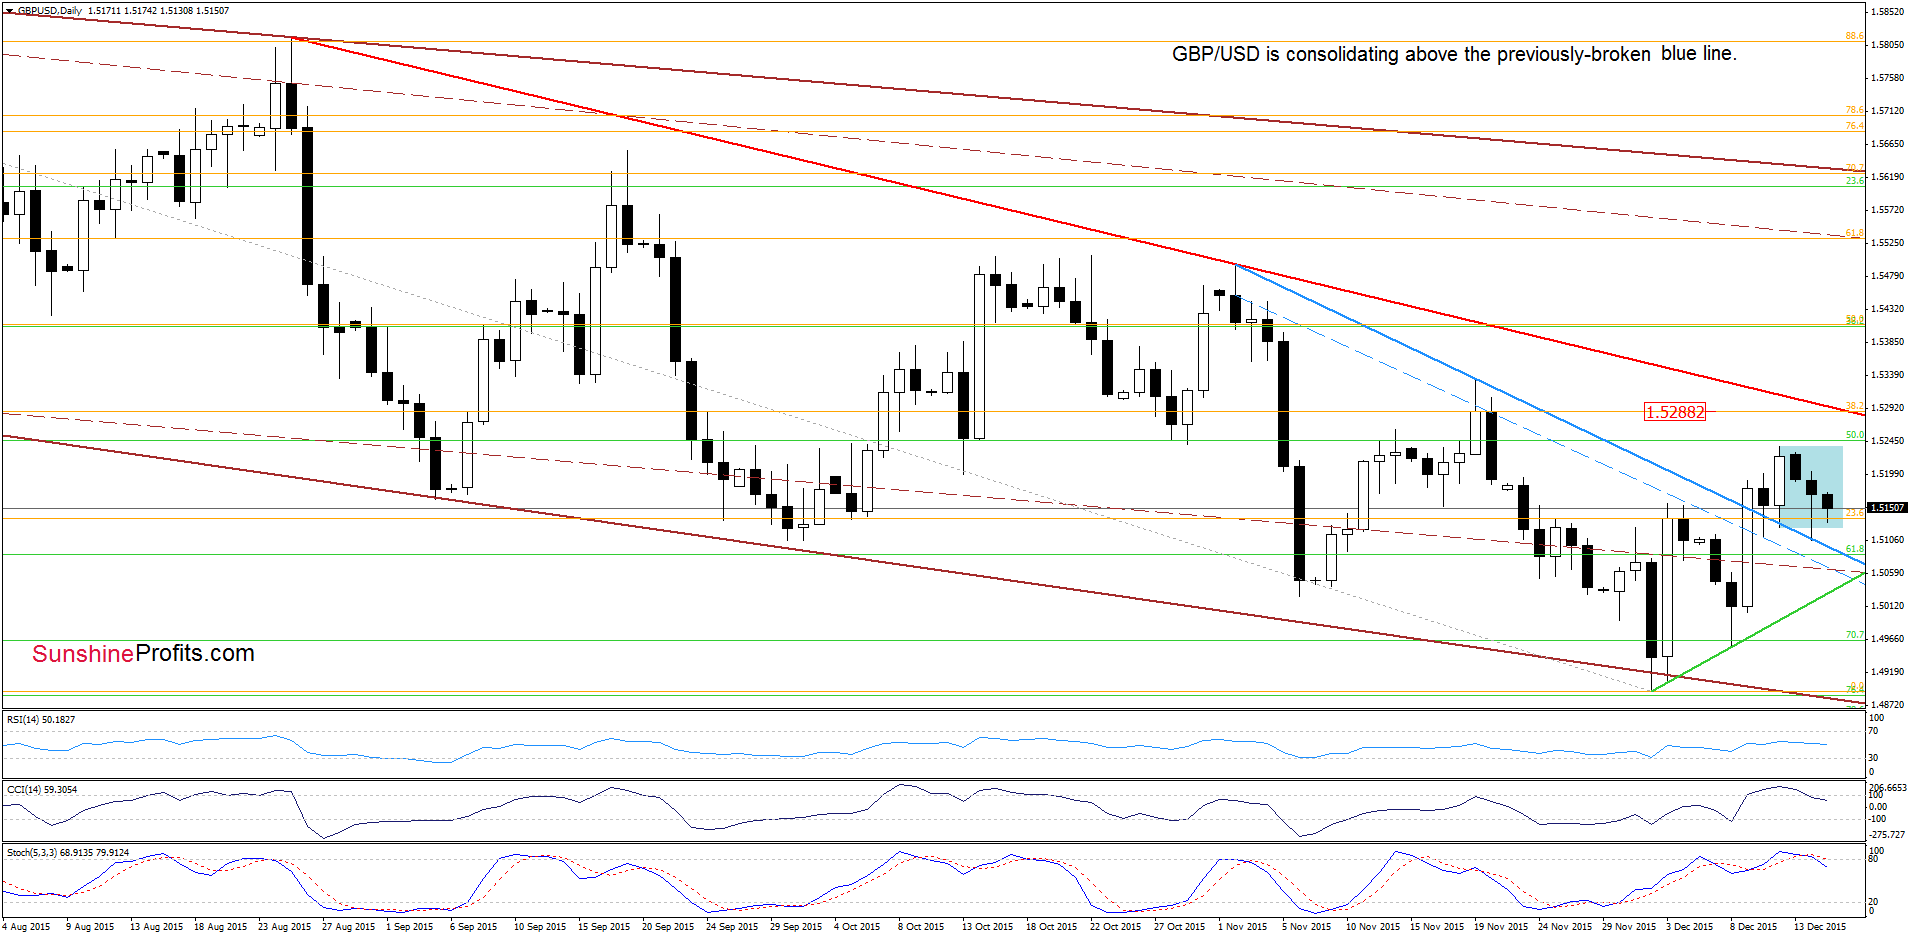
From today’s point of view we see that GBP/USD is consolidating above the previously-broken blue support/resistance line. Therefore, as long as there is no breakout above the upper line of the formation (or a breakdown under the lower border) another sizable move is not likely to be seen. However, we should keep in mind that indicators generated sell signals, suggesting lower values of the exchange rate. If this is the case and the pair invalidates earlier breakout above the blue line, we’ll see a drop to the green support line (based on the previous lows) or even another test of the 70.7% Fibonacci retracement in the coming week.
Very short-term outlook: mixed with bearish bias
Short-term outlook: mixed
MT outlook: mixed
LT outlook: mixed
Trading position (short-term; our opinion): No positions are justified from the risk/reward perspective at the moment. We will keep you informed should anything change, or should we see a confirmation/invalidation of the above.
USD/CAD
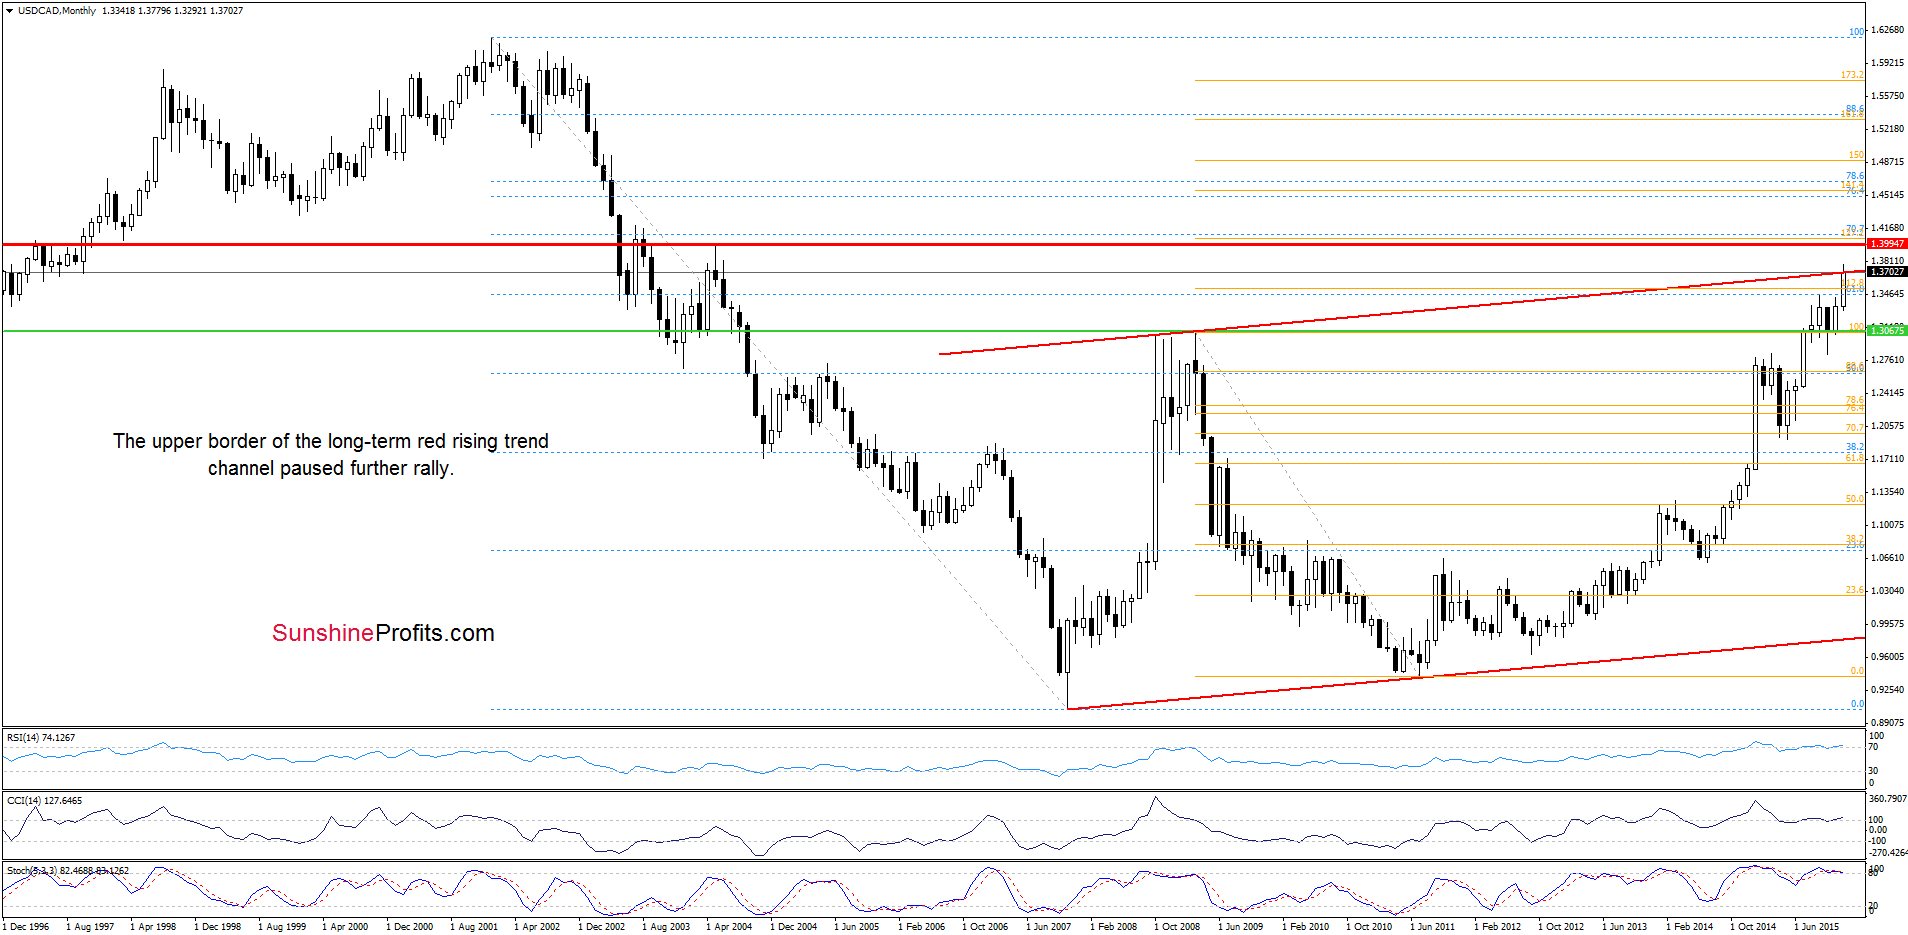
Looking at the long-term chart we see that the upper border of the red rising trend channel encouraged currency bears to act, which paused further rally.
What impact did it have on the daily chart? Let’s check.
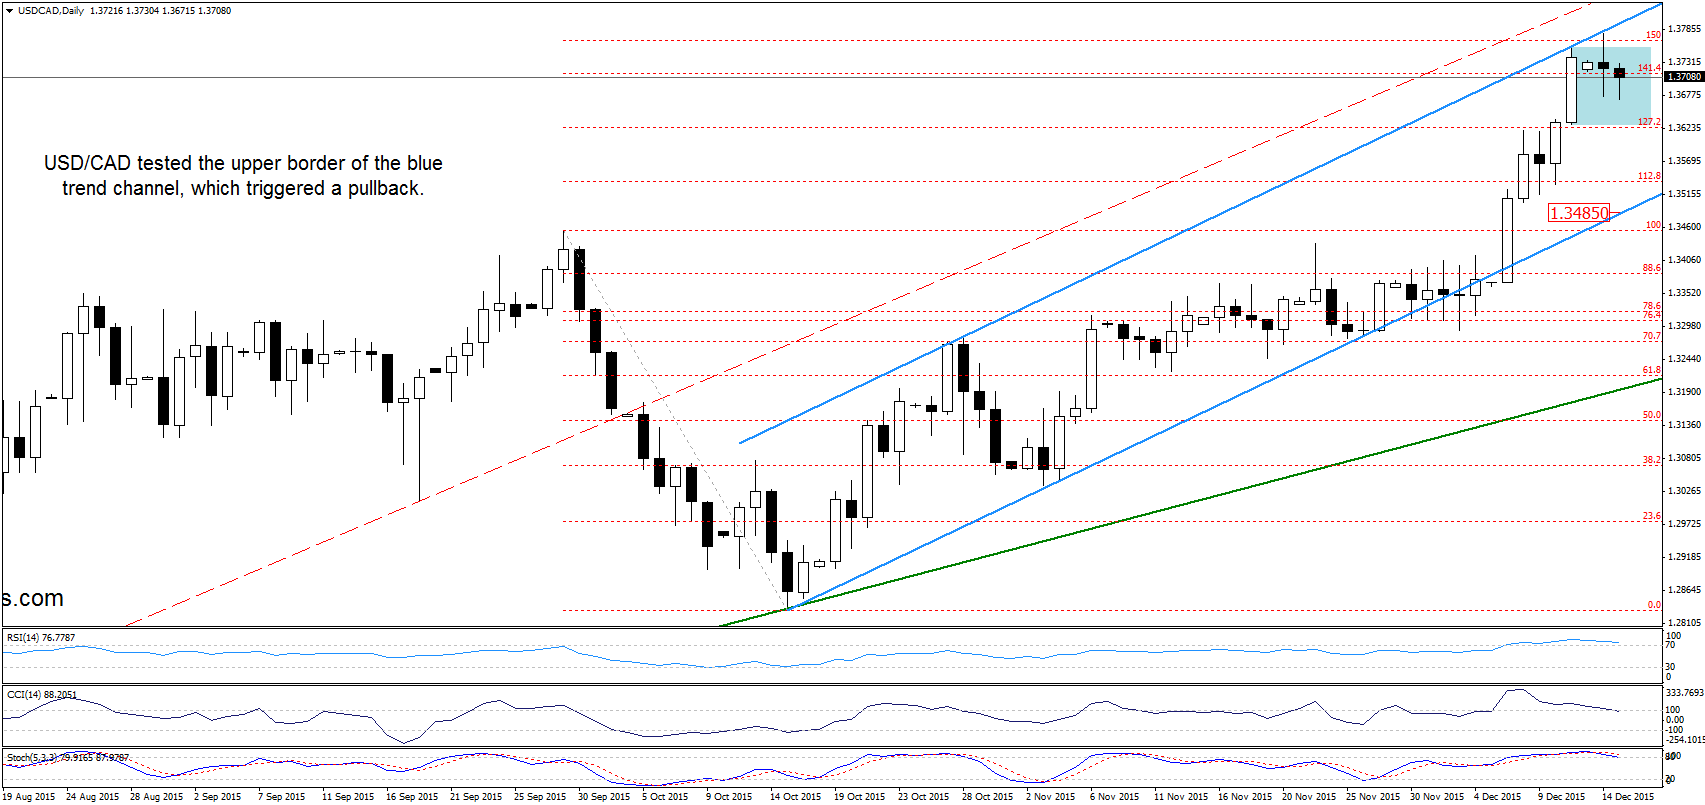
Quoting our Friday’s alert:
(…) With today’s upswing, USD/CAD broke above the upper border of the consolidation and the 127.2% Fibonacci extension, which suggests further improvement and an increase to around 1.3740, where the size of the move will correspond to the height of the formation. Nevertheless, before we see such price action the initial upside target would be the barrier of 1.3700, where the upper border of the red rising trend channel (marked on the weekly chart) is.
On the daily chart, we see that currency bulls not only took the pair to our upside target, but also pushed USD/CAD to the upper border of the blue rising trend channel. As you see this solid resistance in combination with the red resistance line (marked on the monthly chart) triggered a pullback yesterday. Earlier today, the exchange rate moved little lower, but we think that as long as there is no drop under the lower border of the blue consolidation, further decline is not likely to be seen. Nevertheless, the current position of the indicators suggests that currency bears will try to push the pair lower in the coming day(s). If this is the case, and USC/CAD drops under 1.3630, we may see a decline to the lower border of the blue trend channel.
Very short-term outlook: mixed
Short-term outlook: mixed
MT outlook: mixed
LT outlook: mixed
Trading position (short-term; our opinion): No positions are justified from the risk/reward perspective at the moment. We will keep you informed should anything change, or should we see a confirmation/invalidation of the above.
Thank you.
Nadia Simmons
Forex & Oil Trading Strategist
Przemyslaw Radomski, CFA
Founder, Editor-in-chief
Gold & Silver Trading Alerts
Forex Trading Alerts
Oil Investment Updates
Oil Trading Alerts
