

Since the beginning of the month all battles between bulls and bears run in a fairly narrow area, which unfortunately doesn’t create good investment opportunities. In today's alert, we looked at the broader perspective of EUR/USD and the USD Index itself, and we already have our own types where we will likely open next positions. If you do not want to miss the levels that we think about, take a look at our today's analysis.
EUR/USD
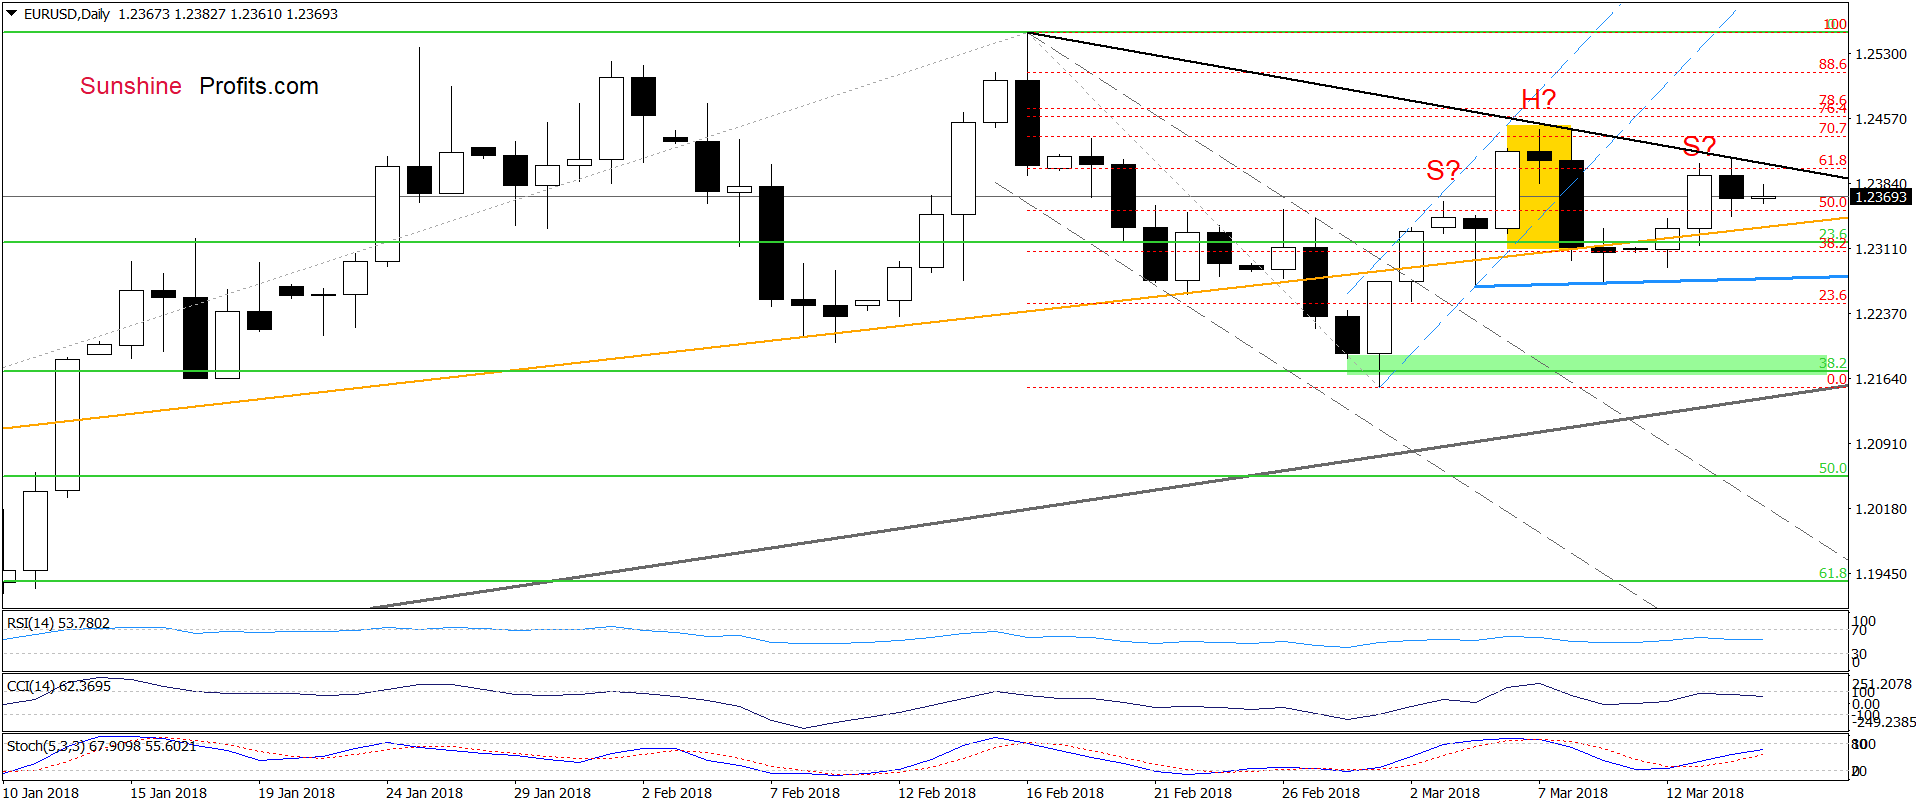
From today’s point of view, we see that the situation in the very short term hasn’t changed much as EUR/USD is currently trading inside yesterday’s black candle under the black declining resistance line.
This means that our last commentary on this currency pair remains up-to-date:
(…) On one hand, the buy signal generated by the Stochastic Oscillator is still active, supporting currency bulls and higher values of the exchange rate.
On the other hand, the probability of the head and shoulders formation remains in the cards – especially when we factor in the fact that EUR/USD reversed and decline after a climb to the black declining resistance line based on the previous highs.
Such price action suggests that despite the support from the site of the Stochastic, the pair could move lower and test the blue support line (the neck line of the above-mentioned pattern) in the coming day(s).
If we see a breakdown under this line, we’ll consider opening short positions.
Nevertheless, when we zoom out our picture, we’ll find the answer to the major question: why the hell the euro is not falling yet?
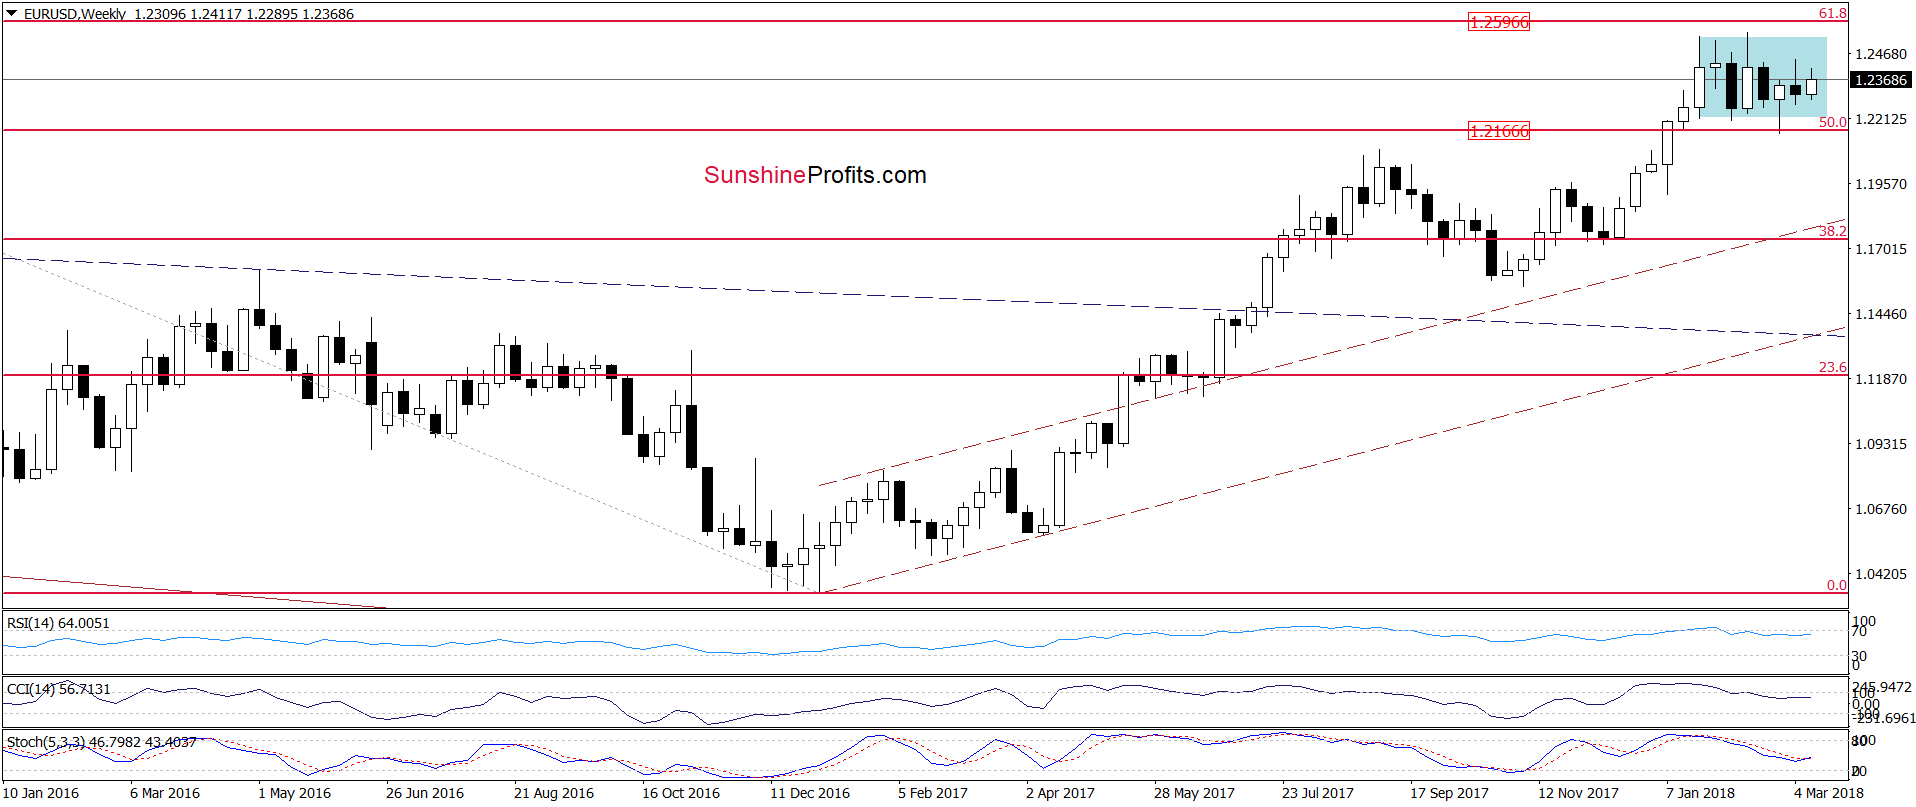
As you see on the weekly chart, the exchange rate is still trading inside the blue consolidation, which suggests that as long as there is no confirmed breakout above the upper border of the formation (or a breakdown under the lower line) another significant move is not likely to be seen.
Nevertheless, when we zoom out the chart once again, we’ll see what the long-term picture suggests.

On the monthly chart, we see that EUR/USD is still trading under the 38.2% Fibonacci retracement and the long-term brown declining resistance line (the upper border of the long-term declining wedge), which together with the current position of the indicators (the CCI and the Stochastic Oscillator generated the sell signals) indicate that the space for gains is limited.
In other words, the likelihood that the next bigger move will be to the downside is more likely than the pro-bullish scenario at the moment of writing these words. Nevertheless, it seems that we will have to wait a little longer for the decreases below 1.2000.
Focus on the USD Index
Why? Because the USD Index stuck between the support zone and the resistance line.
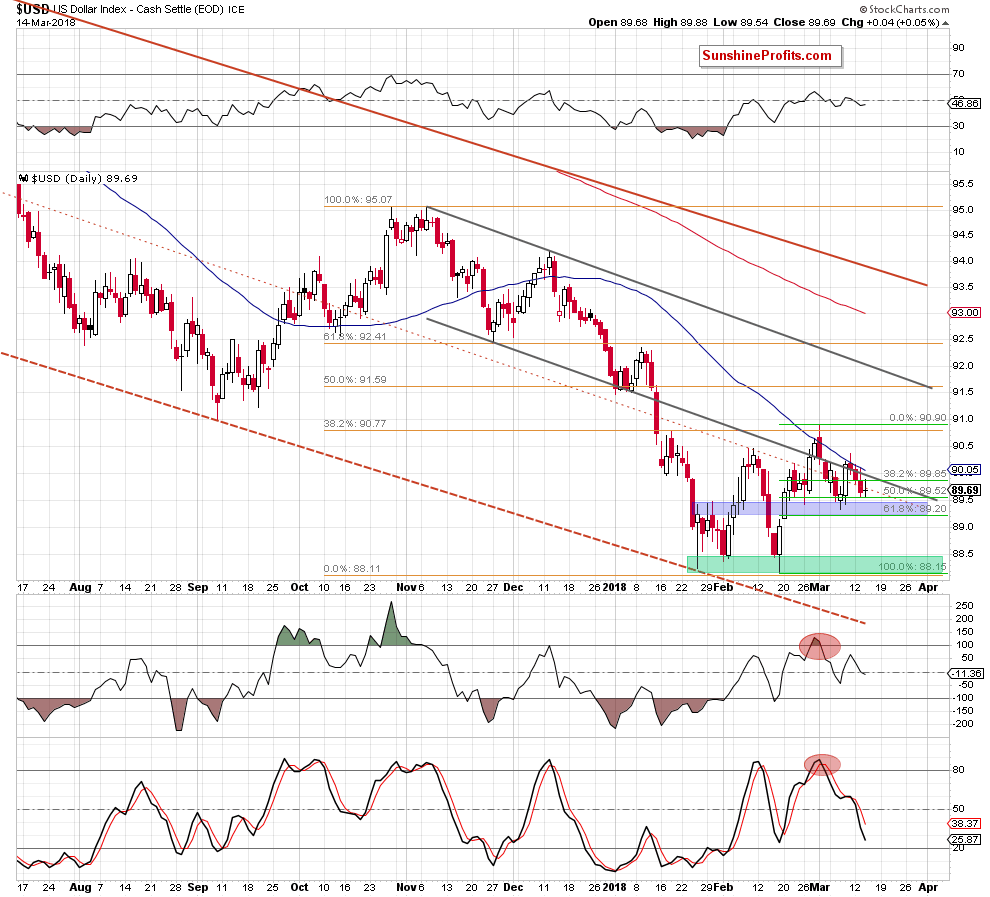
Since the beginning of the month, the index is trading in a narrow range between the lower border of the black declining trend channel and the blue support zone based on the late January highs, late February lows and two Fibonacci retracements (the 50% and 61.8%). This means that as long as there is no breakout above the March peak or a breakdown under the blue zone another bigger move is not likely to be seen and short-lived moves in both directions should not surprise us.
However, what could happen if we see a breakout or a breakdown?
Let’s consider both scenarios.
If currency bulls win, and the index climbs above the March peak, we’ll see an upward move to the upper border of the black declining trend channel (currently around 92) in the following days. Such price action would likely translate into a test of the early January highs in EUR/USD.
On the other hand, if currency bears push the index under the blue support zone, we’ll see a re-test of the green support zone created not only by the January and February lows, but also by the 50% and 61.8% Fibonacci retracements (we wrote about this area in our article posted on February 23, 2018).
We will monitor the forex market and the situation in the greenback in the coming days and if we see reliable signals, we’ll likely open positions.
USD/CHF
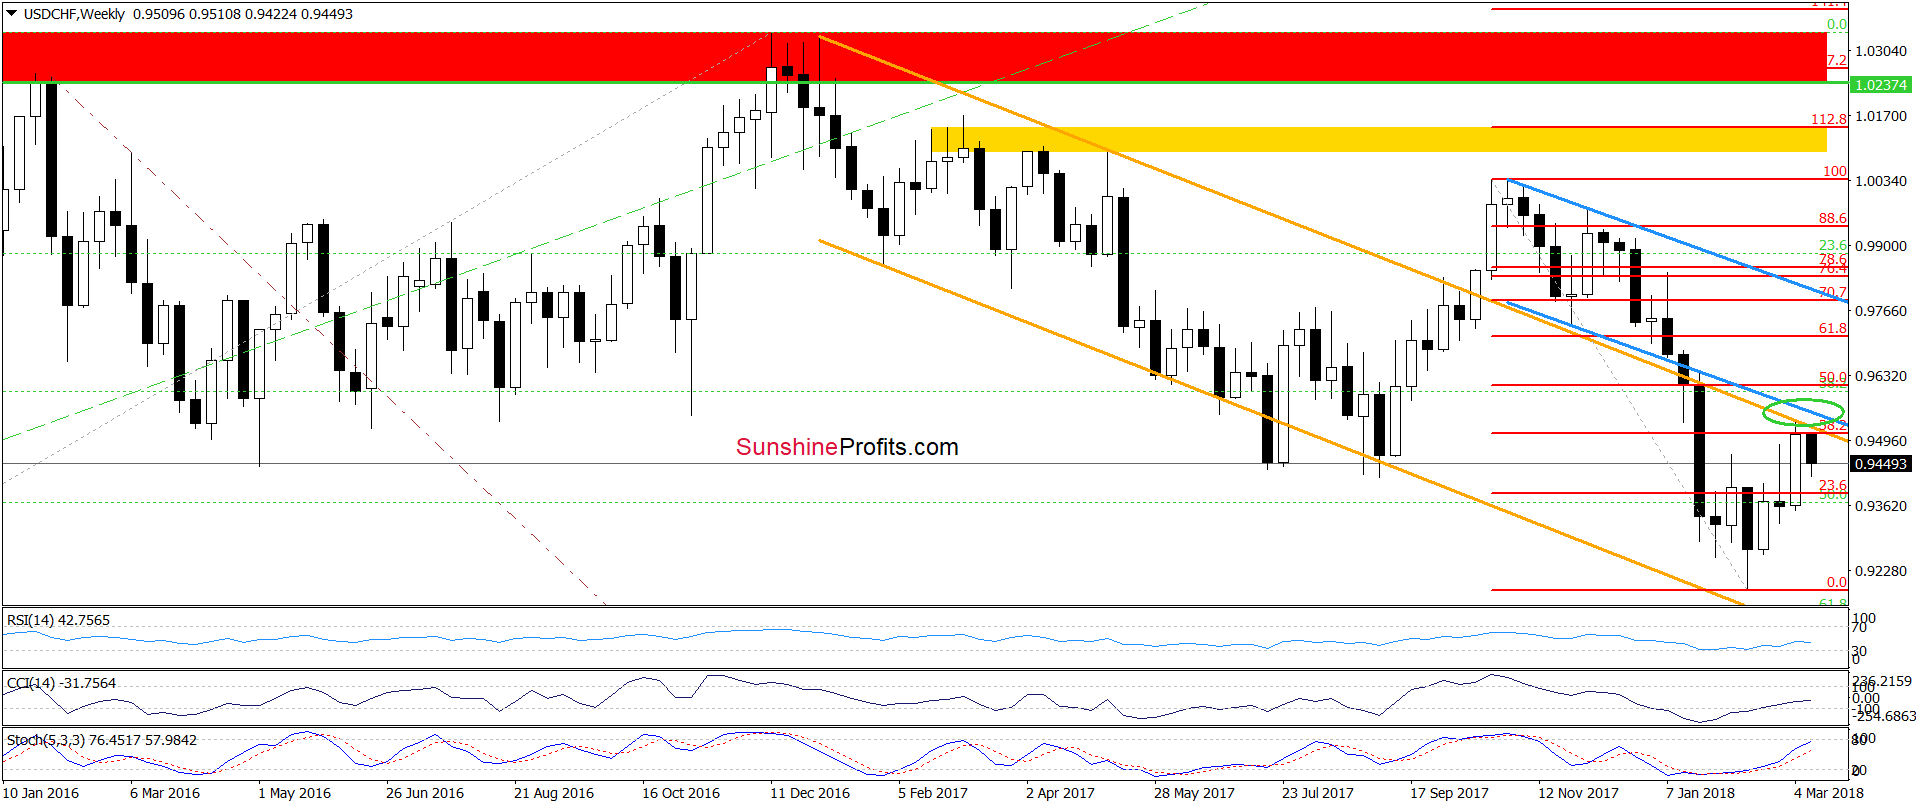
In the previous alerts, we wrote that USD/CHF climbed to the resistance area created by the 38.2% Fibonacci retracement, the upper line of the orange declining trend channel and the previously-broken lower line of the blue declining trend channel (we marked this resistance area with the green ellipse), which could pause or even stop further improvement.
As you see on the medium-term chart, the situation developed in tune with our assumptions and the exchange rate moved away from the above-mentioned resistance zone earlier this week. If you're wondering how this drop affected the very short-term picture of USD/CHF take a look at the daily chart below.
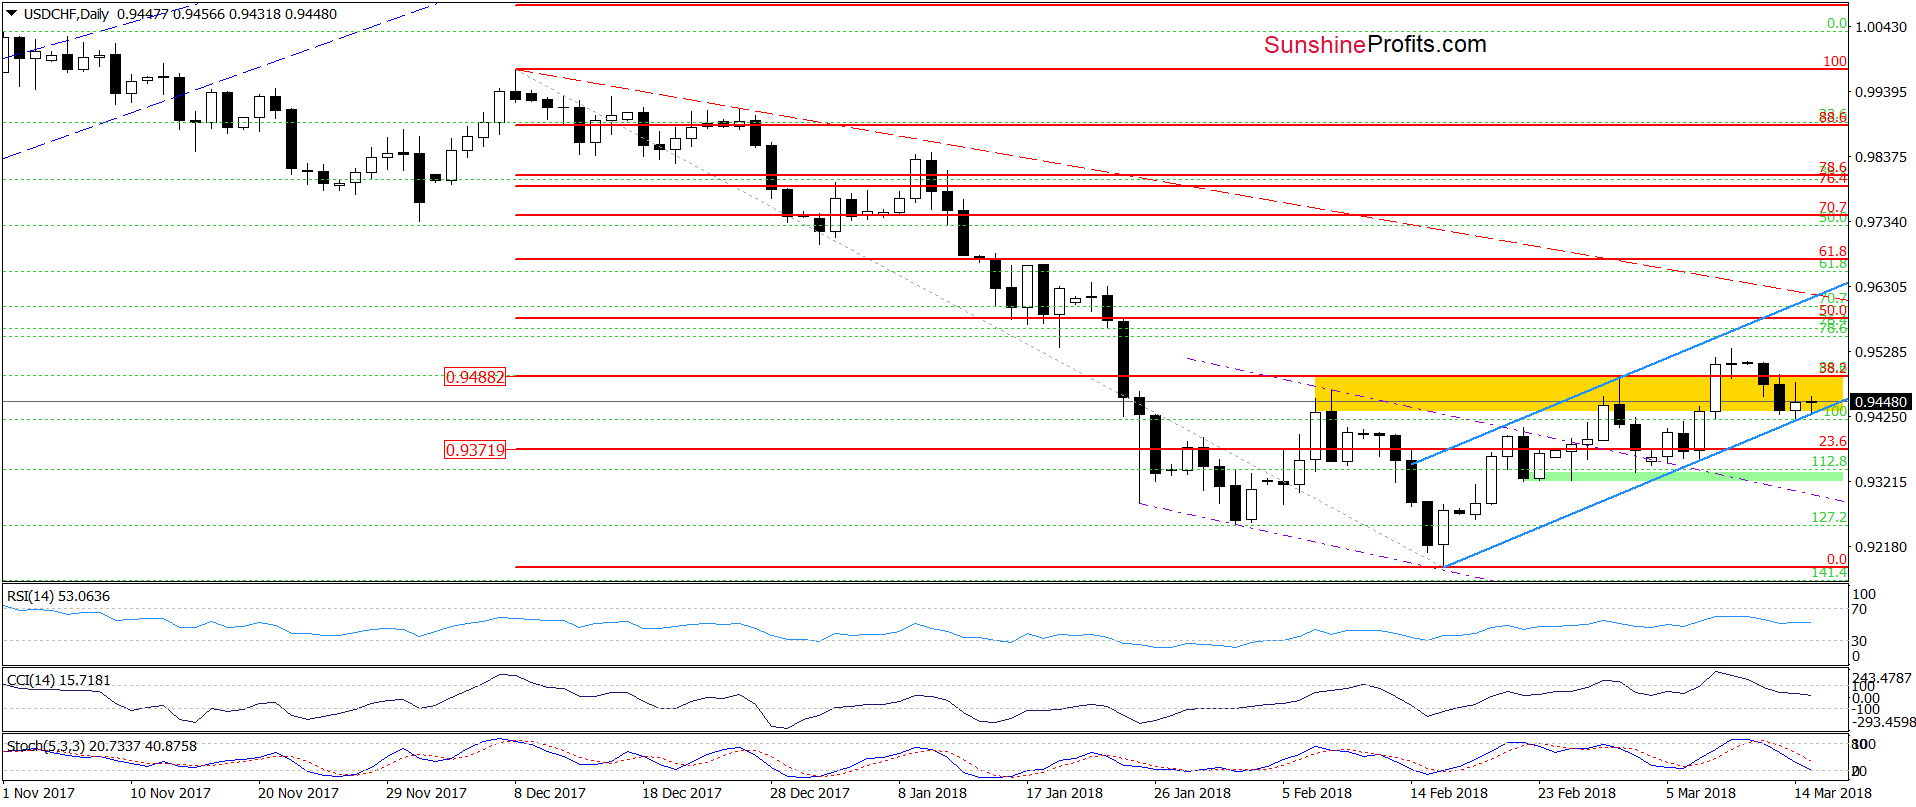
Before we go to the analysis, let’s recall what we wrote on Tuesday:
(…) How low could USD/CHF go? In our opinion, the first downside target will be around 0.9413, where the lower border of the blue rising trend channel currently is. If this support is broken, the next target for the bears will be around 0.9336-0.9370, where the early March lows are.
Yesterday, the exchange rate slipped to our downside target and re-tested it earlier today, but there was no breakdown under the lower border of the blue rising trend channel, which is a positive event.
Nevertheless, the sell signals generated by the daily indicators remain in the cars, suggesting another attempt to move lower. Can we trust them? Well, in our opinion, today’s initial jobless claims data will likely have more influence on the fate of both currency pairs than just the reading of the indicators. Therefore, waiting at the sidelines for a clear and indisputable sign from the USD index (as we mentioned earlier, the breakout or the breakdown) seems to be the best investment decision at the moment.
AUD/USD

The medium-term picture od AUD/USD remains quite stable as the exchange rate came back to the green consolidation. Will we see further improvement or rather another downswing? Let’s examine the daily chart and try to find the answer to this question.
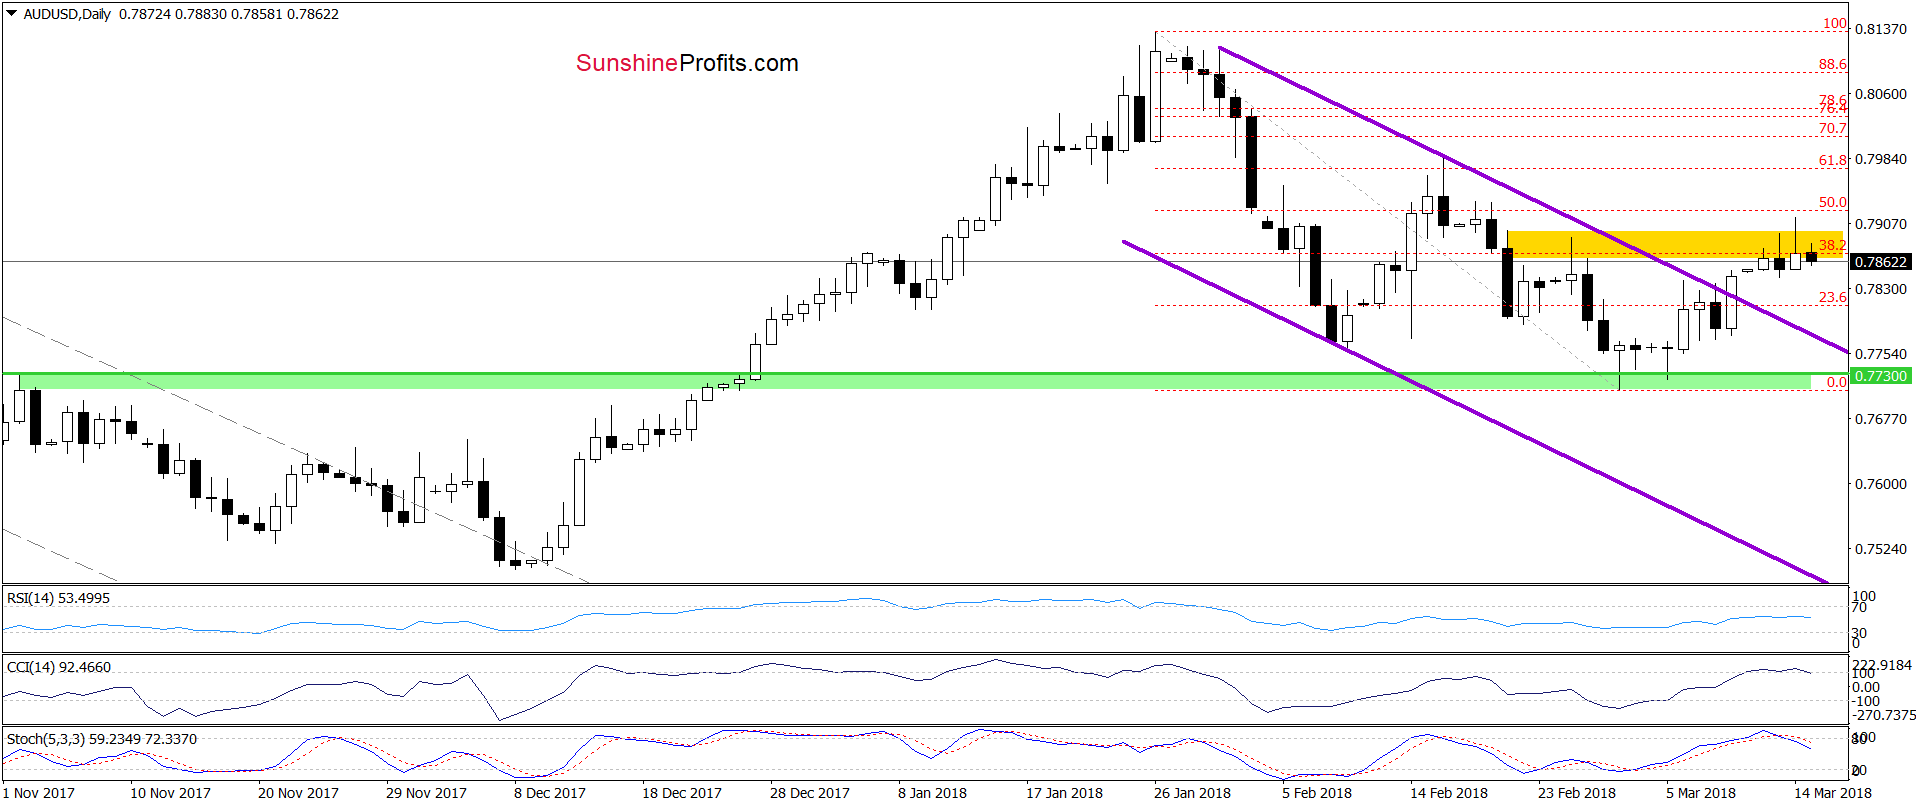
In our last commentary on this currency pair, we wrote:
(…) although AUD/USD broke above the upper border of the purple declining trend channel on Friday, we didn’t see a sharp or significant upward move, which raises doubts about currency bulls’ strength.
Additionally, the exchange rate climbed to the yellow resistance area, which together with the current position of the daily indicators suggests that reversal may be just around the corner.
From today’s point of view, we see that currency bulls tried to push the pair higher yesterday, but their efforts failed, and their opponents created a candle with an elongated upper shadow, which shows an increased activity of sellers in this area.
Earlier today, the pair extended losses which in combination with the sell signals generated by the indicators (they look more reliable in the case of this exchange rate) suggests that we’ll see a realization of the pro-bearish scenario in the coming day(s):
(…) If this is the case and the pair declines from here, the first downside target for currency bears will be around 0.7793, where the previously-broken upper purple line currently is.
If you enjoyed the above analysis and would like to receive free follow-ups, we encourage you to sign up for our daily newsletter – it’s free and if you don’t like it, you can unsubscribe with just 2 clicks. If you sign up today, you’ll also get 7 days of free access to our premium daily Oil Trading Alerts as well as Gold & Silver Trading Alerts. Sign up now.
Thank you.
Nadia Simmons
Forex & Oil Trading Strategist
Przemyslaw Radomski, CFA
Founder, Editor-in-chief, Gold & Silver Fund Manager
Gold & Silver Trading Alerts
Forex Trading Alerts
Oil Investment Updates
Oil Trading Alerts
