
This essay is based on the Premium Update posted on April 9th, 2010. Visit our archives for more gold articles.
In our previous essay, we've stated that a small correction [in gold] may be likely very soon, and since that his is what we've seen very recently, you might be wondering if this means that gold is likely to move much lower from here. Although gold didn't move in the opposite direction to the U.S. Dollar during the last several days, the negative correlation between these two markets has been visible during the whole bull market, which means that it may be worthwhile to analyze the USD index even if one is interested only in gold.
Therefore, let's begin with the long-term U.S. Dollar chart (charts courtesy of http://stockcharts.com.)
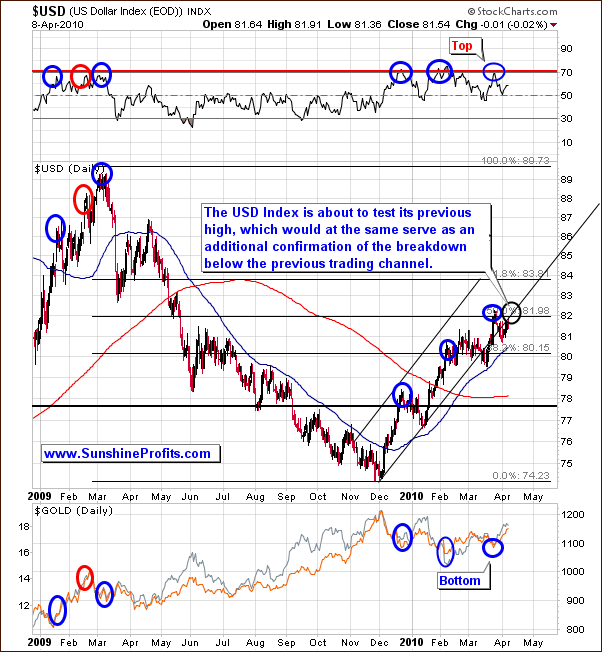
In our previous report we wrote the following:
Consequently, the U.S. Dollar moved considerably lower - visibly below the trading channel. This non-confirmation of a breakout is a bearish sign for the USD Index, and a bullish one for the PMs. Please note that once again the RSI at 70 meant a local top in the U.S. Dollar and a local bottom in gold and silver.
The bearish implications of the breakdown are still in place as far as medium term is concerned, as we have just seen the USD move lower once again (not visible on the chart), which serves as a confirmation.
Moving to the short-term chart, the cyclical confirm that we have just seen a local top.
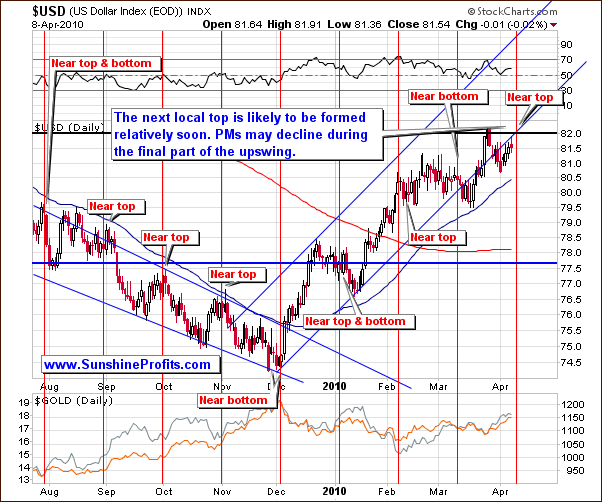
This week, we have seen the U.S. Dollar sliding lower after which it paused at the 50-day moving average. Once this level is taken out we may see more weakness in the dollar, but at this point we may not rule out a minor rally during the next few days.
Therefore, expect the USD to show little strength upward, and then to slide. Consequently, the outlook for PMs is still bullish in the medium terms though the short-term is a different story. Moving on the analysis of the PM sector, this week we would like to provide you with our thoughts regarding the precious metals stocks.
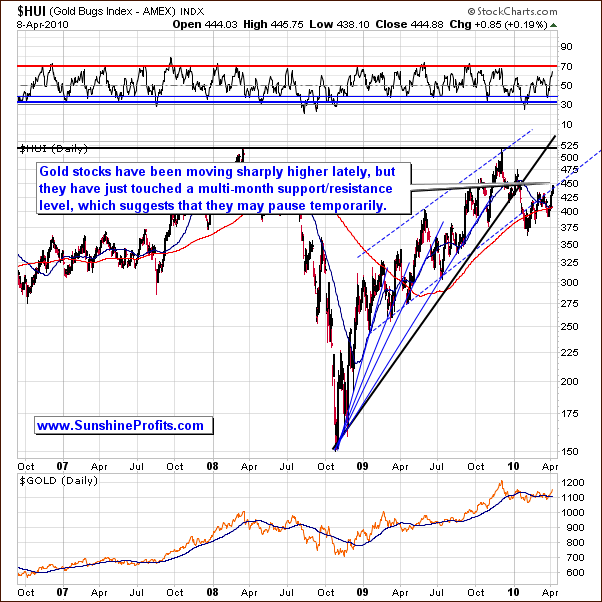
HUI - the Gold Bugs Index now has an RSI near 70 for the first time in six months. What this means is that though sharply moving higher recently, it appears to be ready to pause, especially, as the multi-month support level has been touched The close today is nearly 12% above the Jan-Feb bottom when the RSI was also briefly below 30. The bottom, as mentioned last week is surely in now and a strong rally may follow the soon to be seen pause.
Therefore, the pause here is a normal development, and does not mean that the whole rally is over. Let's take a look on the short-term chart for more details.
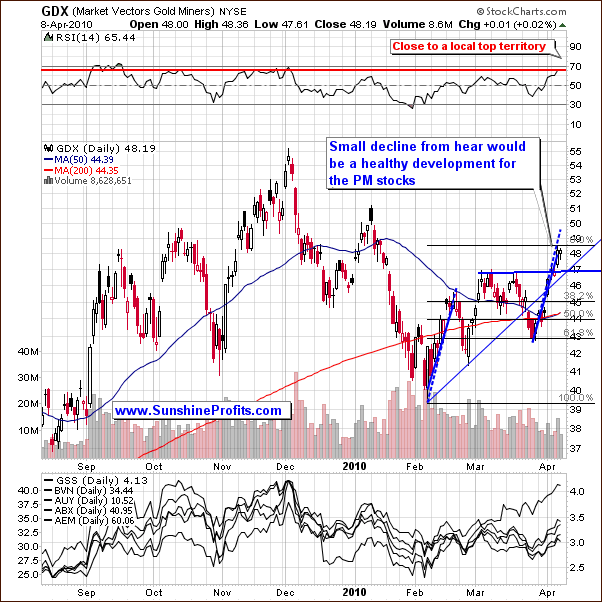
GDX - Market Vectors Gold Miners - the proxy for the PM stocks, which allows us to analyze volume - currently rests at a three month high. A small decline that we've just seen is healthy for the PM stocks and it provides another favorable buying opportunity.
While, we will leave the short-term details for our Subscribers, please note that the RSI indicator is currently getting close to the 70 level which is traditionally a "sell zone" for this indicator. However, taking a look at its previous performance we see that PM stocks often topped out along with RSI at 65 or so, and this is where we just had this indicator. Again - a pause is a normal reaction following a strong rally, and it does not automatically mean that the market is to move much lower soon.
Moreover, based on the sizes of the previous rallies, and especially the February one, it is no wonder that we've just seen a pause after reaching the $49 level. Additional confirmation comes from the use of the 1.618 Phi number. Multiplying the Feb - mid-Feb rally by 1.618 we get the target for the next local top (around the $49 level). If we multiply the difference between two important bottoms - the February, and the March ones - by 2.618 (1 + Phi, or Phi * Phi) we also get target for the GDX ETF around the $49 level.
Summing up, the rally in the precious metals sector might appear to have ended, but so far we don't have any evidence that PMs are to plunge from here. Yes, the momentum is not that strong as it was just a few days ago, but consolidations from time to time are imminent. As always, we will let our Subscribers know when we believe this pause is going to end.
To make sure that you are notified once the new features are implemented, and get immediate access to my free thoughts on the market, including information not available publicly, I urge you to sign up for my free e-mail list. Sign up today and you'll also get free, 7-day access to the Premium Sections on my website, including valuable tools and charts dedicated to serious PM Investors and Speculators. It's free and you may unsubscribe at any time.
Thank you for reading. Have a great weekend and profitable week!
P. Radomski
--
Please note that charts from this essay have been available to our Subscribers on Friday, April 9th 2010 several hours before the end of the session.
In the latest update we've featured detailed analysis of 3 USD charts, 4 charts measuring the general stock market, 3 gold charts, 2 silver charts, 2 charts dedicated to PM stocks. Additionally, we've analyzed the platinum chart, which had just flashed an important signal for the whole PM sector. We also provided a follow-up regarding last week's Market Alert and explained if points made earlier were still up-to-date. We encourage you to Subscribe to the Premium Service today and read the full version of this week's analysis right away.
