
This essay is based on the Premium Update posted on April 9th, 2010. Visit our archives for more gold articles.
In the March 31st 2010 commentary, we've analyzed the general stock market along with the price of gold, and one of the things that we wrote was that a significant decline is not very likely at this point and the general market could rally further.
This is what we've seen since that time, but stocks have been recently rising on a relatively low volume, so you might wonder if it made us change our mind as far as the situation on the general stock market is concerned, and how it would affect the PM sector.
Let's begin with the long-term SPY ETF chart (charts courtesy of http://stockcharts.com.)
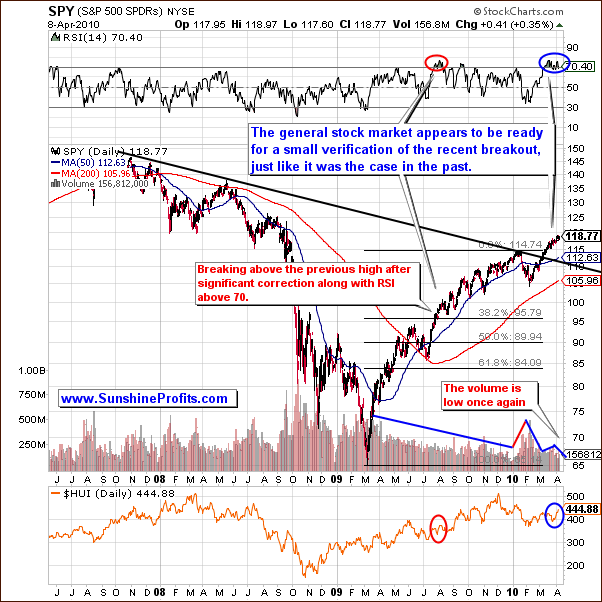
In the March 31st 2010 commentary we also wrote that it might be the case that stocks move above this level and then verify it as support.
Based on the above chart it seems that the general stock market appears to be ready for a small verification of its recent breakout. This situation is unchanged from last week as far as price is concerned. The RSI has maintained its solid 70 level with more time slightly above than below.
However, the volume has decreased visibly during the very recent upswing, which is a bearish signal. Therefore, based on the above chart a move lower from here appears very likely in the short term. Additional confirmation comes from the DIA ETF and from the Nikkei 225 index.
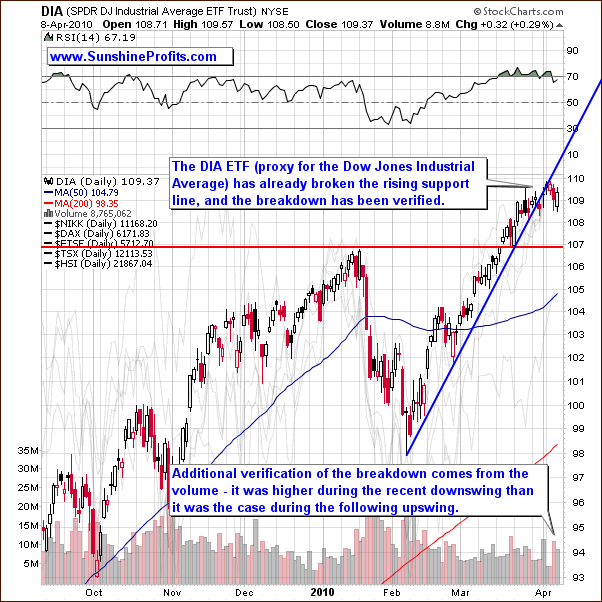
A glance at the DIA Dow Jones ETF Trust shows that it has already broken its rising support line and this has been verified. Note the increased volume as this downswing unfolded - this is a strong verifying signal that the correction has already begun.
Given today's level of globalization and mobility of capital we can expect many market indices to move at the same time. This does not mean that they would perfectly reflect each other, but the turning points are the main directions in which the main stock indices go are very often in tune. Let's take a look at the Japanese stocks to see what may be waiting just around the corner.
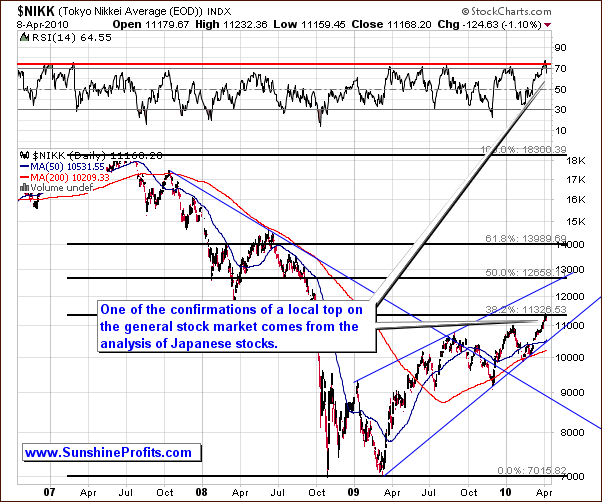
As you may see on the above chart, the Nikkei 225 index (Japanese stocks) suggest that the stock markets around the world are to take a breather here, as it has just moved to the strong long-term resistance level created by the 38.2% Fibonacci retracement of the huge 2007 - 2009 decline. This is a strong resistance level, because the decline that the retracement is based on is also a very important - not to mention that it is a multi-year one.
Therefore, consistent with last week's observations, we might need to see a verification of the previous high before stocks rally further. As you read in the following section, this may trigger a small consolidation in PMs.
So, what does this mean for PM Investors and Traders? Let's take a look at our correlation matrix for guidance.
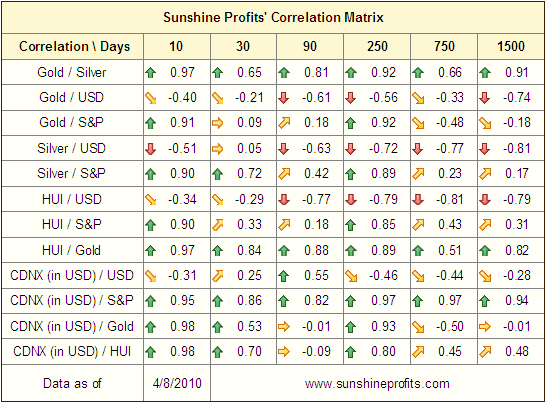
The correlations of the U. S. dollar with gold and gold stocks have become less negative. We were looking to see an alignment here and this is exactly what is taking shape, although the strength of the correlation has weakened. The 30-day values which were negatively correlated last week have nearly all become less correlated, i.e. closer to 0 or no correlation of any kind. Gold and its corresponding equities are indeed mostly USD driven for the short run.
However, what is really interesting is the 10-day column and very high readings for the PM sector and the general stock market. Although this does not necessarily mean that the main stock indices will once again become the main driver of the PM prices, it should make you cautious as far as short-term is concerned.
Silver held its high steady correlation with the general stock market. This is due to its multiple industrial uses as compared to other metals.
Therefore,the USD and PM's continue to have negative correlations, a fact that has us hold onto previous expectations of a move up soon to be imminent. Gold increased it correlation with the general market as well which continues to support our view of the weeks ahead for PM's. Speaking of gold, let's take a look at the long-term gold chart.
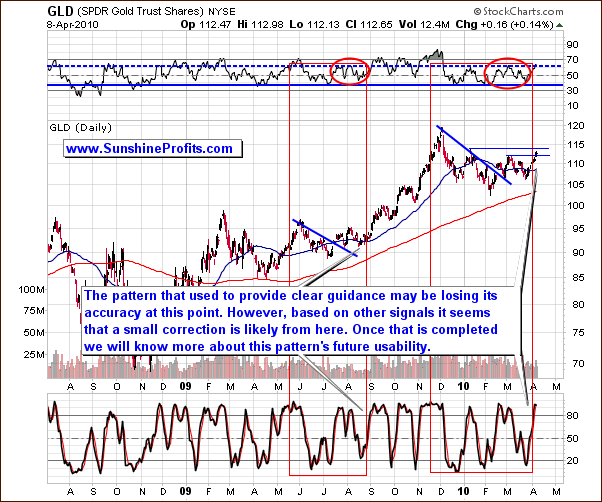
Gold has and will most likely continue to trend upwards in the coming weeks. Though a small correction may be likely very soon, it is probable that the upward trend will be delayed only for a very short period of time. Look for the volume to increase after this brief correction and expect the upward trend to resume probably no later than at the end of this month, most likely sooner than that.
The big news this week is that the self-similar pattern which we were referring to in many previous reports may be losing its accuracy. At this point it is unclear which part of the upswing are we currently in, it the current move up is to look just like the September - December 2009 one. Therefore, we need to use other techniques and wait for the situation to crystallize before we can once again use the self-similar pattern that we referred to in the past. The short-term chart and many more timing details are available to our Subscribers.
Summing up, we are still bullish on gold in the medium term; a brief pause or correction is likely to occur short-term but the rally is to resume relatively soon. The way gold behaves during the next several days will also let us know if the previously analyzed self-similar pattern is still in place, and if so, what does it suggest for gold in the following days/weeks.
To make sure that you are notified once the new features are implemented, and get immediate access to my free thoughts on the market, including information not available publicly, I urge you to sign up for my free e-mail list. Sign up today and you'll alsoget free, 7-day access to the Premium Sections on my website, including valuable tools and charts dedicated to serious PM Investors and Speculators. It's free and you may unsubscribe at any time.
Thank you for reading. Have a great weekend and profitable week!
P. Radomski
--
The rally in the general stock market may be running out of steam, while the U.S. Dollar is moving slowly higher even though it is still trading below its resistance level. What does this mean for Precious Metals Investors and what does it mean for PM Traders? The full version of this week's commentary includes price targets as well as timing details.
In this week's update we feature detailed analysis of 3 USD charts, 4 charts measuring the general stock market, 3 gold charts, 2 silver charts, 2 charts dedicated to PM stocks. Additionally, we feature the platinum chart, which has just flashed an important signal for the whole PM sector. We also provide you with a follow-up regarding this week's Market Alert and explain if points made earlier are still up-to-date. We encourage you to Subscribe to the Premium Service today and read the full version of this week's analysis right away.
