
This essay is based on the Premium Update posted on April 30th, 2010. Visit our archives for more gold articles.
Three weeks ago we've commented on the link between the general stock market and gold, but since the situation has changed significantly since that time, we would like to provide you with a follow-up.
Let's begin with the very-long-term chart (charts courtesy by http://stockcharts.com) of the S&P 500 Index, and then we'll move to implications for gold.
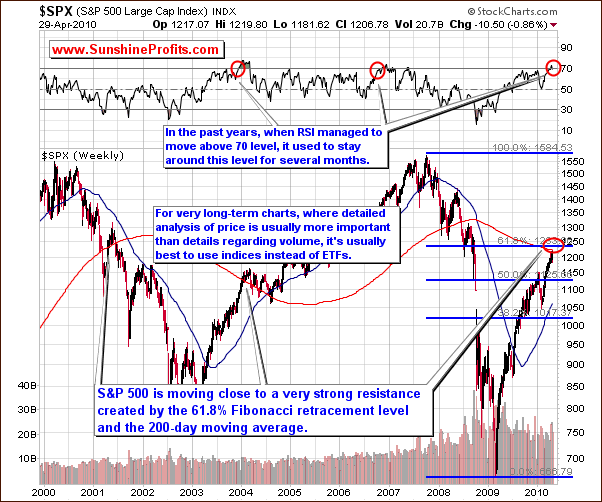
In short - we still expect to see a general stock market correction in the not too distant future, but not right away. This week there was very little change in the S & P Large Cap index chart. The recent decline meant nothing with respect to the long-term picture although it was clearly visible on a day-to-day basis.
As we stated in a previous update, in past years, when RSI levels [based on weekly closing prices] was in the 70 range, it normally remained there for months. In the past, we have also seen stocks forming a temporary top above the 200-week moving average. Since we are not presently above it, we would expect the rally to continue until we have seen the index in or slightly above the area marked on the above chart with red ellipse. Until this takes place, it is likely that we will see the RSI fluctuate near the 70 level.
Let's zoom in for more details.
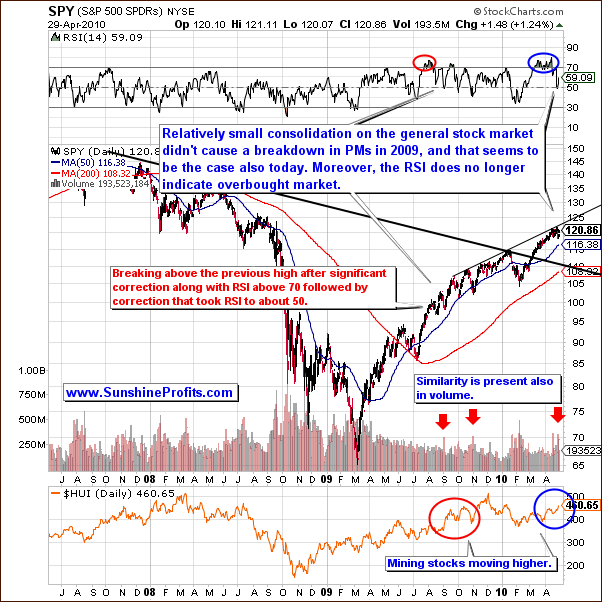
Moving to the long-term SPY ETF chart, we do see some changes as compared to last week. The market has been consolidating for several days and this has caused the RSI (based on daily closing prices) to move much lower, actually touching the 50 level. This indicates that we are no longer in an overbought situation. We are therefore presently bullish as the trend surely appears to be upward. A further rally is likely given that the overbought situation is behind us.
Looking back to 2009, we see similarities. An overbought period was followed by an RSI plunge to 50 (marked on the chart with red ellipse) which quickly resulted in a stock market rally. Several weeks ago, we mentioned that this was likely to take place and we see it now (marked on the chart with blue ellipse). This has been confirmed by volume levels recently, thus validating that our analogy with 2009 is still intact. During the final part of the decline, we also saw a decline in the high volume levels. We saw this twice in 2009, during periods of consolidation and slight decline. Perhaps, our current consolidation interval is coming to an end.
The likely implications for precious metals can be surmised from a look at previous periods with similar trends. We saw PM's rally in very similar situations and we expect to see this once again. Consequently, we remain medium term bullish on gold. Still, in order to provide you with details, we need to further elaborate on the values from our correlation matrix.
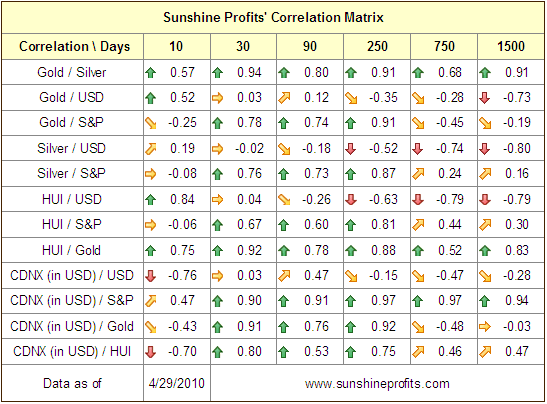
There is virtually no change to the correlation matrix for this week. Once again, the USD and precious metals are uncorrelated and the high correlation readings are seen between PM's and the general stock market. Gold continues to be highly correlated with the general stock market and therefore our previous bullish points apply here as well. The lack of correlation with the US dollar resulted from a situation where gold continued to rise in spite of the recent strength shown by the USD. We expect this trend to continue in week ahead and once again reaffirm our bullish outlook for the yellow metal.
The gold chart provides us with details.
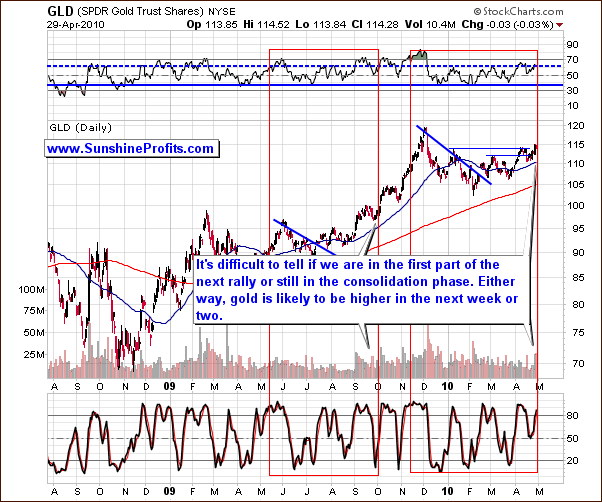
Gold prices moved higher this week. Today the question is have we reached a local top or would we call this a pause in the rally? We feel more strongly that the latter is true. The gold rally most likely will continue over the next week or three with short periods of sideways movement possible. The situation is to some extent unclear mainly due to the lack of clarity in the self-similar pattern. In October 2009, we saw a similar period to what we've seen recently followed by a rally. We also have seen consolidation patterns come to an end. In either case, a downward movement occurred first followed by a rally. We do not feel at this time that one should bet on a downward movement in the short term. All signs point to higher gold prices in a week or three regardless of what happens in the next few days.
The short-term bullish analysis is confirmed by the GDX:SPY ratio.
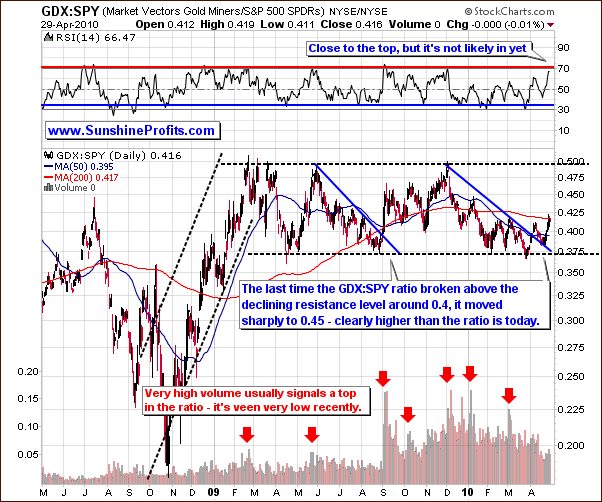
The GDX:SPY ratio measures precious metal stocks outperformance vs. the general stock market. It is a useful tool for estimating when a top or bottom is in for PM stocks as this ratio usually tops out along with PMs and PM stocks.
Please note that virtually each time we've seen a top in the ratio, it was accompanied by big volume. Presently, it is obvious that the daily volume is relatively low. This indicates the top is not yet in. We see that the RSI is approaching 70, which usually means that a top is near, but this level has not yet been reached.
Additionally, when the ratio moved above the declining resistance line near the 0.4 level, it quickly moved upwards to the 0.45 range. We haven't seen a rally this big so far, which - once again - suggests that the rally is not over yet.
Summing up, although the general stock market has been rallying strongly since February, we again state that the correction, which we still feel is inevitable, may still be some time away. The market appears to have gained some strength of late, which should hold off a short-term correction for the near future, which has bullish implications for the gold market. Additionally,the analysis of ratios reassures us that the final top for this rally is not yet in. Targets and short-term details are available to our Subscribers.
To make sure that you are notified once the new features are implemented, and get immediate access to my free thoughts on the market, including information not available publicly, I urge you to sign up for my free e-mail list. Sign up today and you'll also get free, 7-day access to the Premium Sections on my website, including valuable tools and charts dedicated to serious PM Investors and Speculators. It's free and you may unsubscribe at any time.
Thank you for reading. Have a great weekend and profitable week!
P. Radomski
--
This week we have seen further strength in the precious metals sector and the second most important question is - is this a top? Naturally, we provide our views on this topic. Still, the most important question is how you should position yourself given the answer to the previous question, and we also comment on that point providing details for Investors and Speculators.
This week's Premium Update includes 3 gold charts (including gold from the non-USD perspective), 2 silver charts, and 2 charts dedicated directly to PM stocks. Additionally we feature 3 charts dedicated to the general stock market, 2 USD charts, our correlation matrix, the GDX:SPY ratio, and the silver:gold ratio.
Moreover, this essay includes our comments regarding the current situation in Greece. We encourage you to Subscribe to the Premium Service today for immediate access to the full version of this week's analysis.
Back