

Are you feeling lucky? We all should. Whether you’re short or long gold (or you’re waiting on the sidelines), the additional day of signals is truly a blessing. That is, if you know what to look at. The previous days and weeks provided us with multiple signs and yesterday’s price action served as the – likely final – sign before the big price move. Were you listening?
Let’s start today’s analysis with something that we didn’t feature so far this week – the short-term look at the gold stocks to gold ratio (chart courtesy of http://stockcharts.com).
Slide Continues
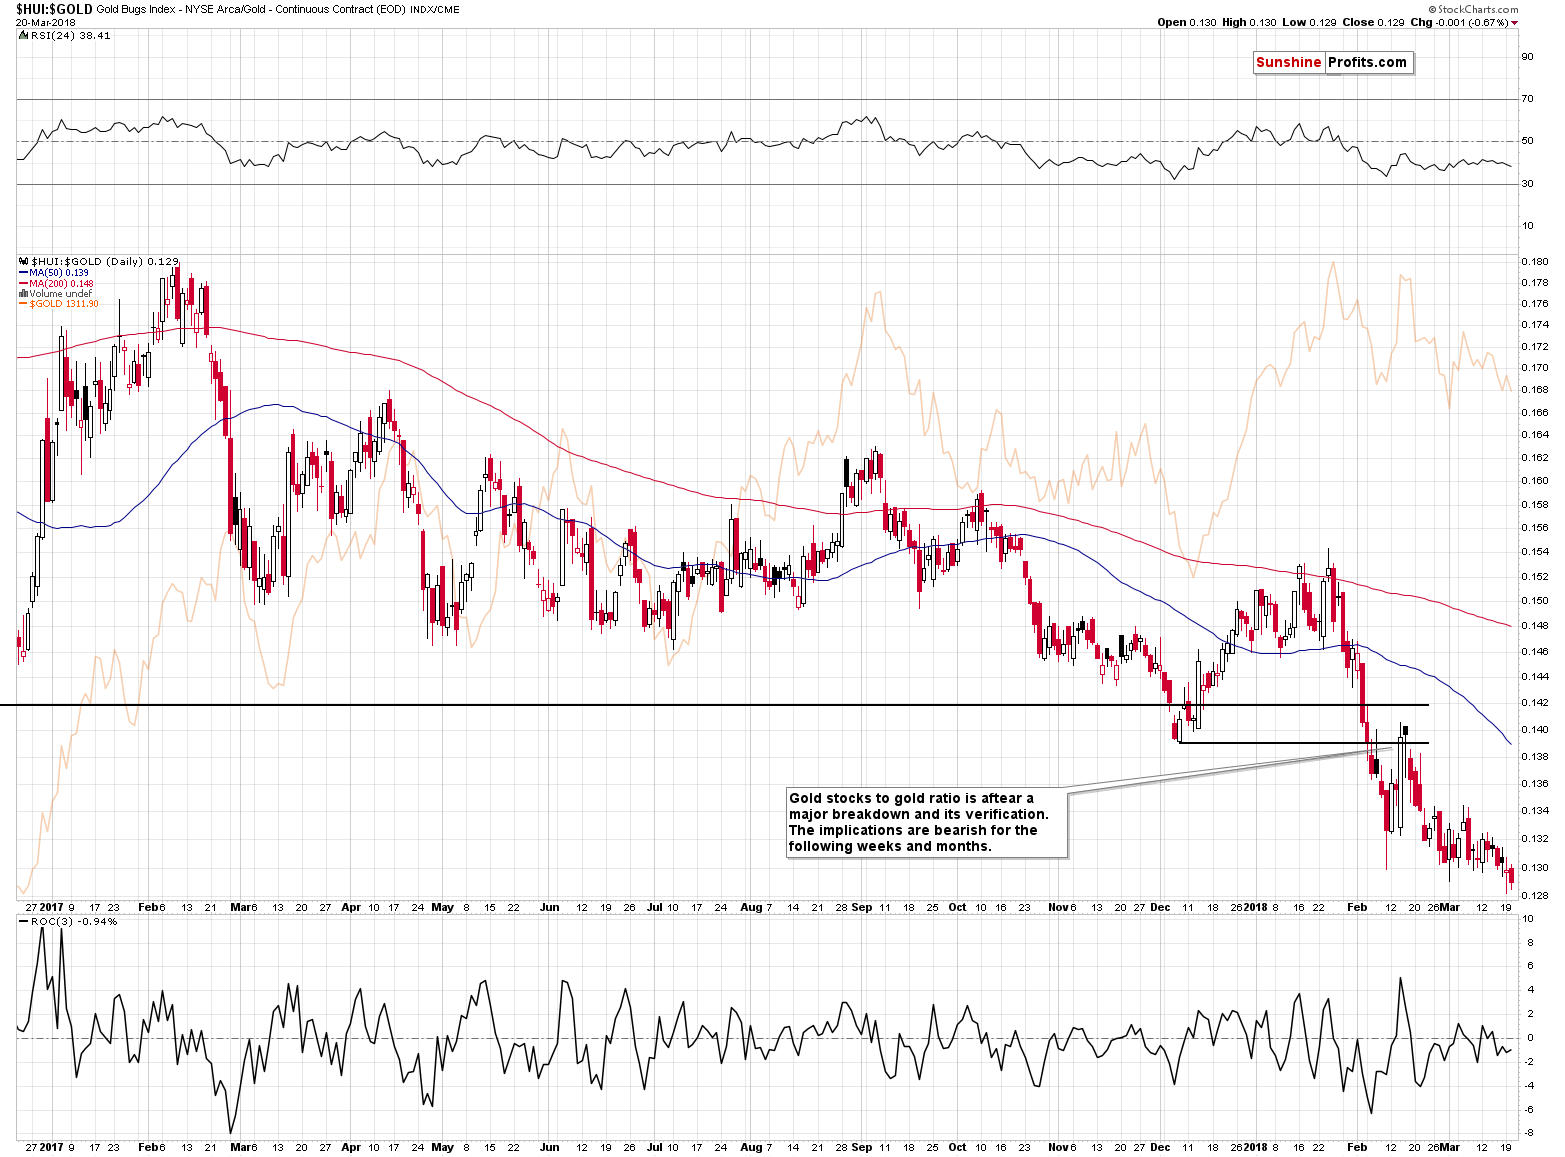
After moving back and forth close to the February intraday low, the gold stocks to gold ratio simply… Broke and closed below it. This may seem like an insignificant event from the day-to-day perspective as the ratio moved down just a little. However, the fact that it was a first decisive move below the previous February and March lows makes it important indeed. The dam was broken in early February when the ratio moved below the 2017 and 2016 lows. Now we have seen a sign that the post-breakdown consolidation is over and that the decline can continue. The implications are bearish for the ratio and for the entire precious metals sector.
Gold Confirmed Its Breakdown
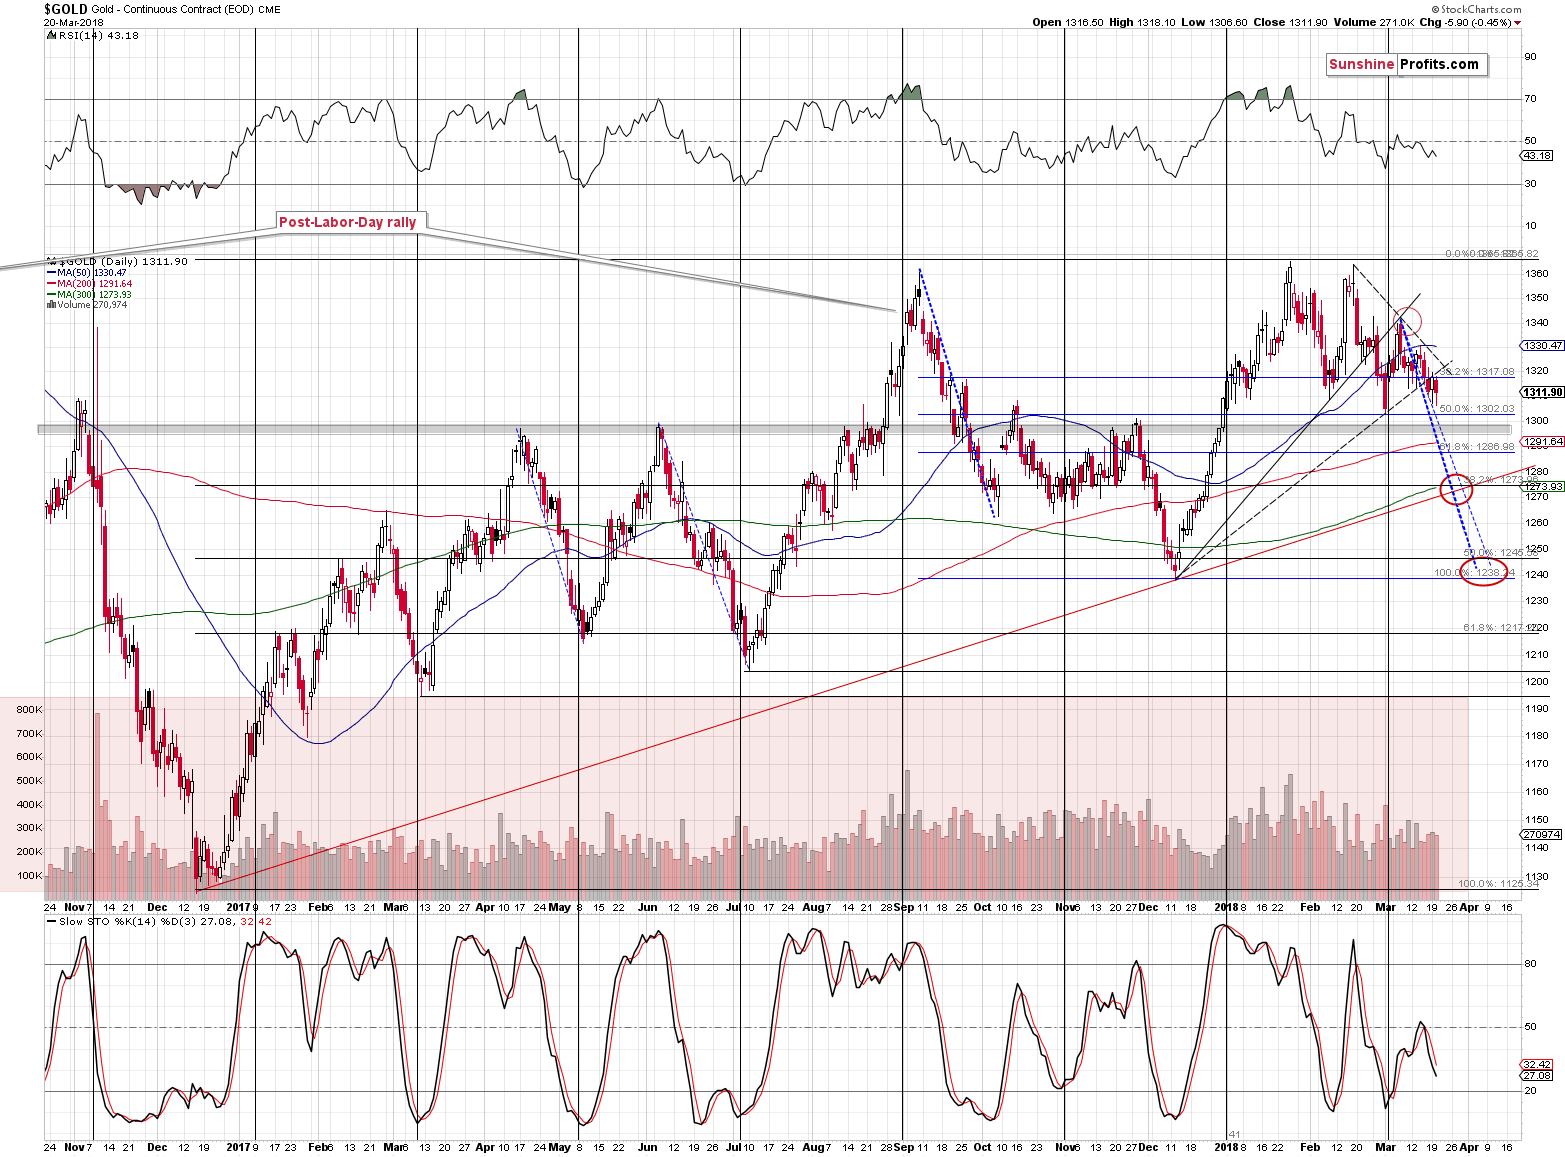
Gold just closed below the rising support line for the third consecutive trading day, which is a classic way of confirming a breakdown. The implications are therefore bearish, and it seems that gold is about to decline in the way that we described previously.
In our Monday’s analysis, we discussed the analogy to the “triple top and the one extra pop-up” by writing the following:
First of all, the 2012-2013 decline and the 2016 decline have both started in the similar way. Similarly to what we recently described in case of the euro, gold formed a triple top (each top being below the previous one) that was followed by an extra move up.
In both cases, after the breakdown below the previous low (the low that preceded the extra move up) gold continued to decline until it doubled the size of the decline between the first top and the final low. It’s easier to understand the relationship by looking at it on the above chart. The 50% retracement in early 2013 and in mid-2016 is the middle of the pattern. The 0% on the retracement tool is the bottom that one can predict and the 100% on the retracement tool is the first top.
Why is this interesting at this time? Because that’s exactly what gold formed recently.
The particularly interesting thing is how gold declined. In early October, 2016, after months of back and forth movement above $1,300, gold broke below the previous local lows and declined over $40 in just one day. Can we see something similar also this time? Of course, after all, history tends to repeat itself to a considerable extent.
With a confirmed breakdown, it seems that we’ll see another – perhaps very volatile – downswing shortly.
Silver Declines Once Again
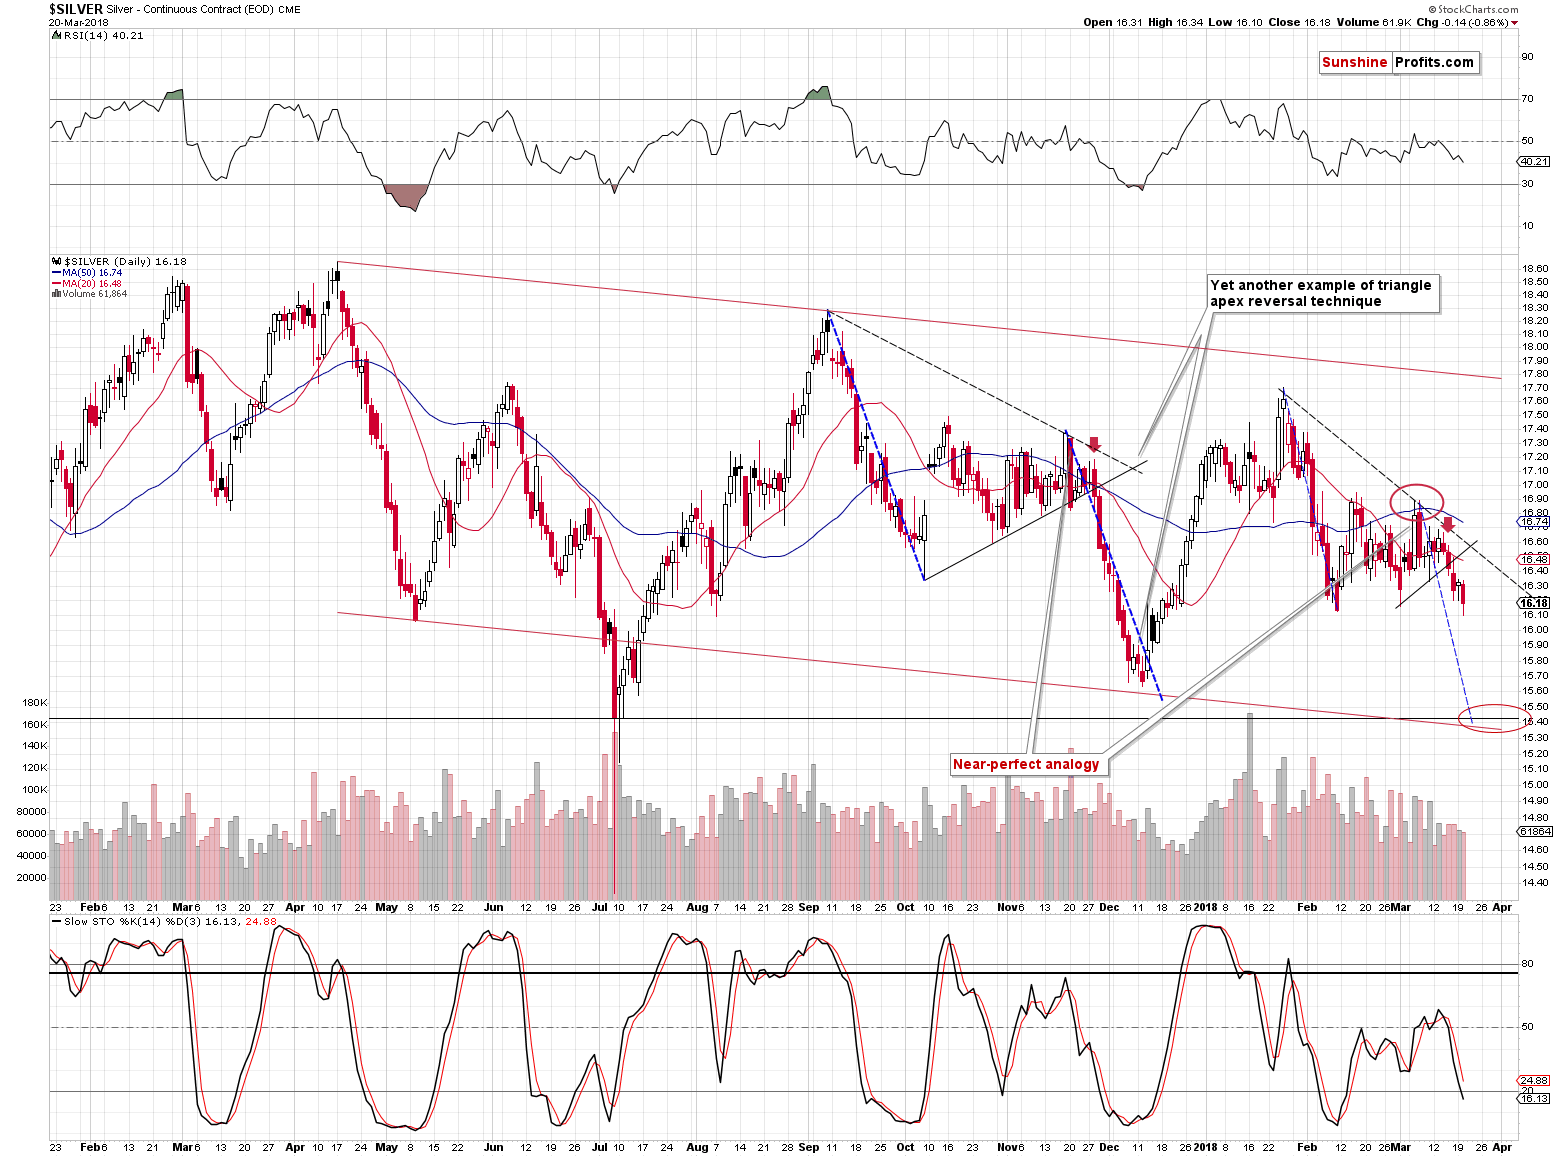
Based on the self-similar pattern in the white metal and the breakdown below the rising support line, we were of the opinion that silver was about to move to $15.30 - $15.50, likely before the end of March. Perhaps even this week. This remains likely based on what we saw yesterday. Even though it was not particularly dramatic, silver’s daily decline is in tune with the mentioned pattern and our expectations. Silver moved briefly below the previous low, but finally closed the session above the lowest closing price of February.
There was no breakdown just yet, which can explain why there was no volatile slide so far. The breakdown will be a significant technical development, with which practically all traders are familiar, so that could be the moment after which the volatility increases. This would be in tune with what we described as a possibility for the price of gold. If the latter is about to decline sharply then it’s very likely that the white metal will slide in a volatile manner as well.
Another Day, Another Breakdown in Gold Stocks
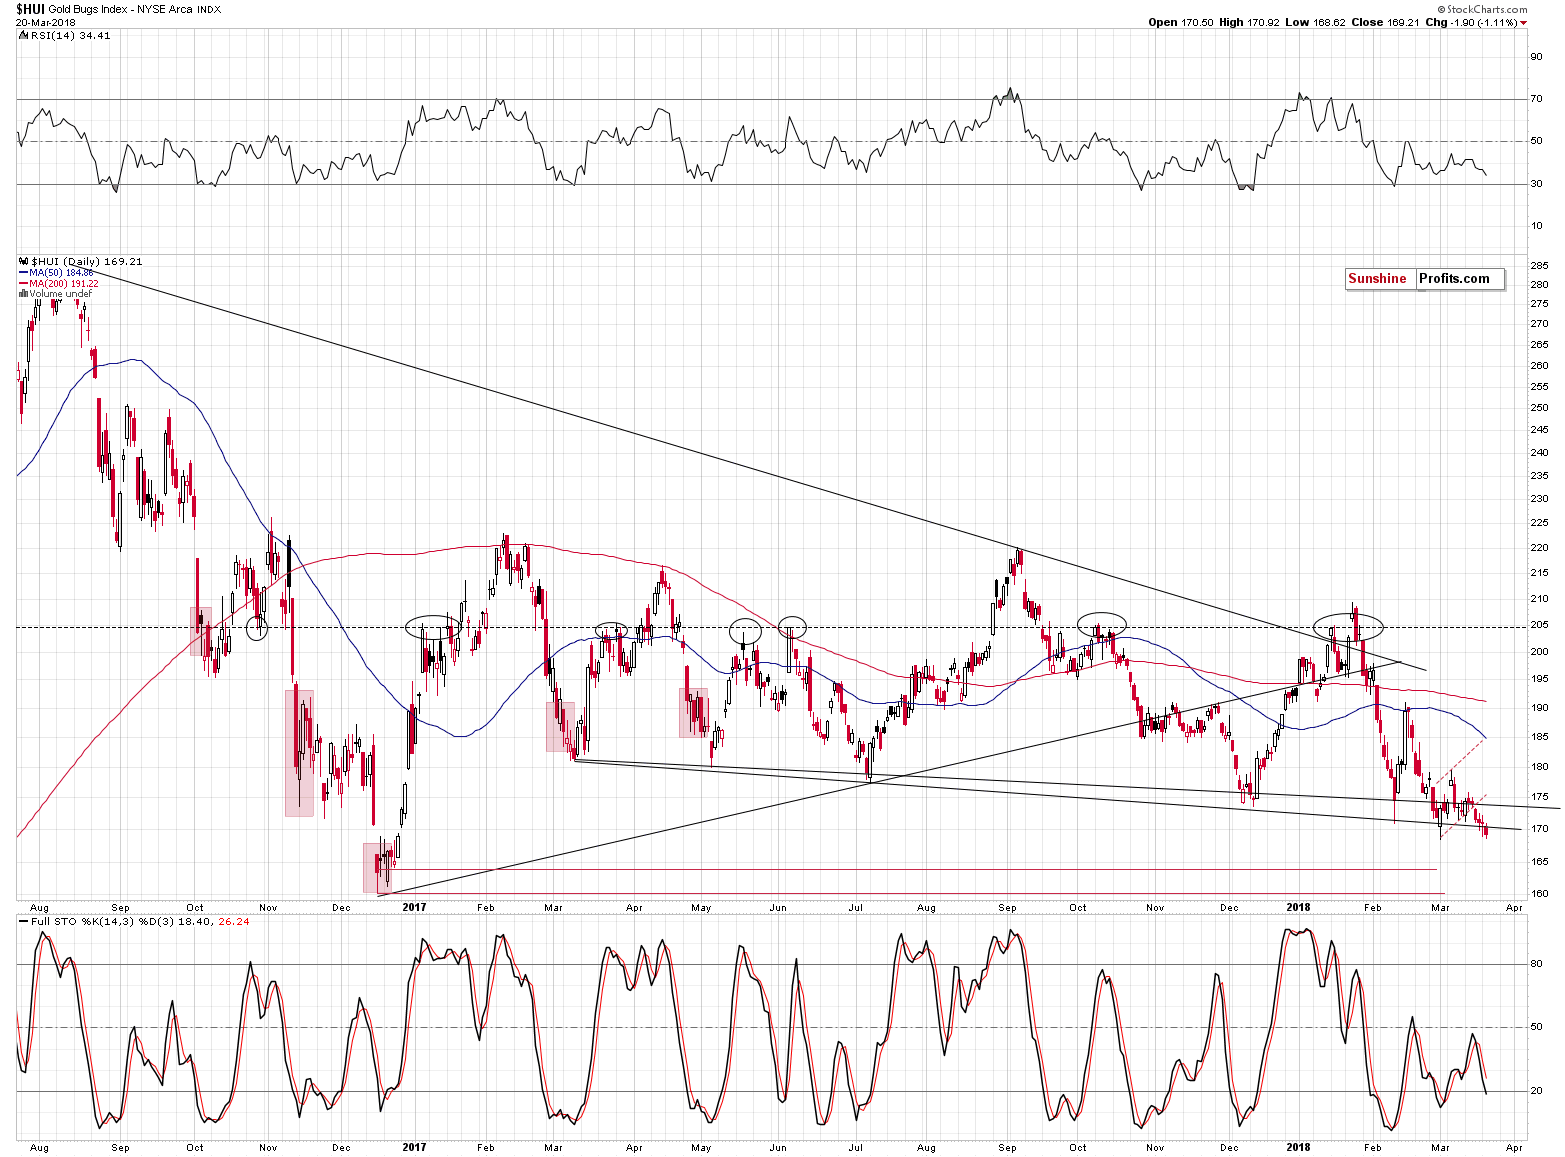
Monday was the third subsequent day on which the HUI Index closed below the February 2018 low. This means that the breakdown is now fully confirmed and the bearish implications are fully present.
The thing that made the bearish picture even more bearish is the fact that gold stocks declined below the declining support line based on the March and July intraday lows. That was the final of the near-term support levels. After breaking the final barrier, gold miners are very likely to decline further. How low? As we explained on Monday, the target levels for the HUI Index are at approximately 160 and 150.
Before summarizing, let’s take a look at the forex market.
USD’s Sign of Strength
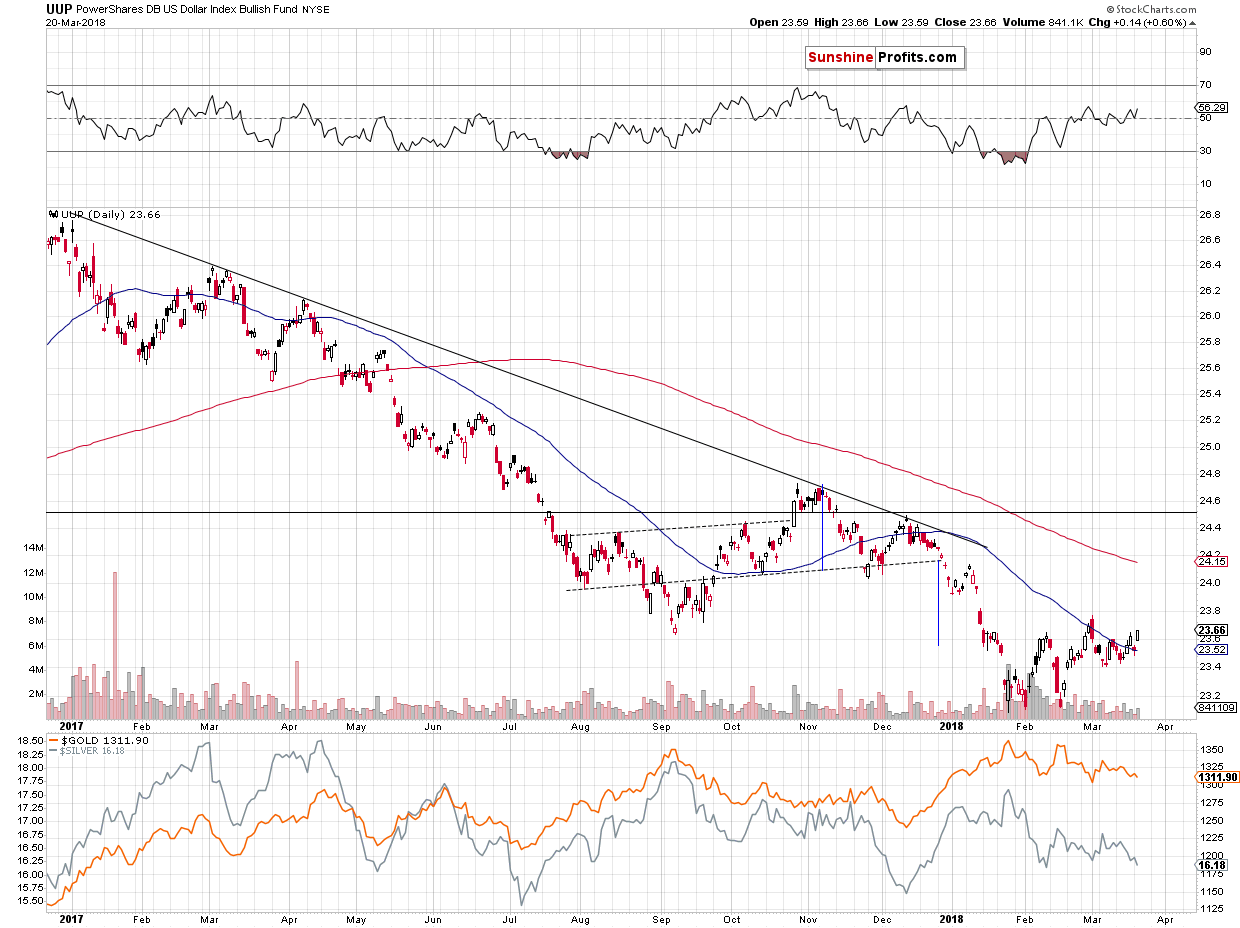
The data for the USD Index on Stockcharts seems to be rather incoherent, so we’ll use UUP as a proxy. The above chart clearly shows that something new has indeed happened. One thing is that yesterday’s closing price was the highest one this month, but that’s not what we want to emphasize. The fact that indicates higher prices ahead is the breakout above the 50-day moving average (marked in blue). The breakout took place on Friday and based on yesterday’s session, the move is now verified.
To be honest, this moving average is not a very strong support or resistance, so the breakout is not critical, but still, it’s a bullish factor and in light of all the other breakdowns in the precious metals sector that we discussed today, the above serves as a good confirmation of the bearish outlook for the PMs.
Interest Rate Decision vs. Tension
Today is the day when we get to know the Fed’s decision regarding interest rates. The rates will most likely be increased once again, but this may not be the key thing that happens today. The questions and answers during the follow-up conference could be more important if the markets are surprised in any way, but the thing that will definitely be an important factor is something different.
It’s the decrease in the tension regarding the decision. This time, the tension is particularly big as it will be the first meeting that Powell will chair. Once tensions subside, the market will be free to react to “everything else” that it was supposed to react. This includes both fundamental and technical factors, so the volatile decline that we’ve been expecting to see might start based on the decrease in tensions. The tricky part is that the tensions could trigger a very short-term upswing initially and it would be tempting to go long. In fact, at the moment of writing these words, gold is up by about $7, so it seems that the tension-based-rally is already here. Multiple factors hint against such a position, but it’s easy to get caught up in the moment and buy based on “breaking news” that turns out to be something quite normal in hindsight. If things get even hotter today, please keep the above in mind.
Summary
Summing up, we have just seen a few additional reasons that make a decline in the precious metals sector likely to be seen before the end of the month – perhaps even before the end of the week. The self-similarity in silver and the breakdown to new 2018 lows in gold stocks and their ratio to gold all suggest that the wait for start of the decline is almost or completely over. Based on the way gold and silver declined in the past, it seems that the next 2-5 trading days will be quite volatile and that we’ll see new 2018 lows shortly.
The volatility, however, may be affected by today’s rate decision and the FOMC press conference – we could see it beforehand or shortly thereafter. Either way, the outlook – regarding the big moves – remains bearish. There were quite a few cases when gold and silver rallied right before the rate announcement and/or during the conference only to disappoint later.
Naturally, the above is up-to-date at the moment of publishing it and the situation may – and is likely to – change in the future. If you’d like to receive follow-ups to the above analysis (including the intraday ones, when things get hot), we invite you to subscribe to our Gold & Silver Trading Alerts.
Thank you.
Sincerely,
Przemyslaw Radomski, CFA
Founder, Editor-in-chief, Gold & Silver Fund Manager
Gold & Silver Trading Alerts
Forex Trading Alerts
Oil Investment Updates
Oil Trading Alerts
