

Although the U.S. dollar declined against the Swiss franc recently, USD/CHF reversed and rebounded, which suggests a verification of the earlier breakout. Will currency bulls be strong enough to push the pair above this resistance?
In our opinion the following forex trading positions are justified - summary:
- EUR/USD: short (a stop-loss order at 1.2250; the initial downside target at 1.1510)
- GBP/USD: short (a stop-loss order at 1.3773; the next downside target at 1.3000)
- USD/JPY: none
- USD/CAD: none
- USD/CHF: none
- AUD/USD: none
EUR/USD
Yesterday, we wrote:
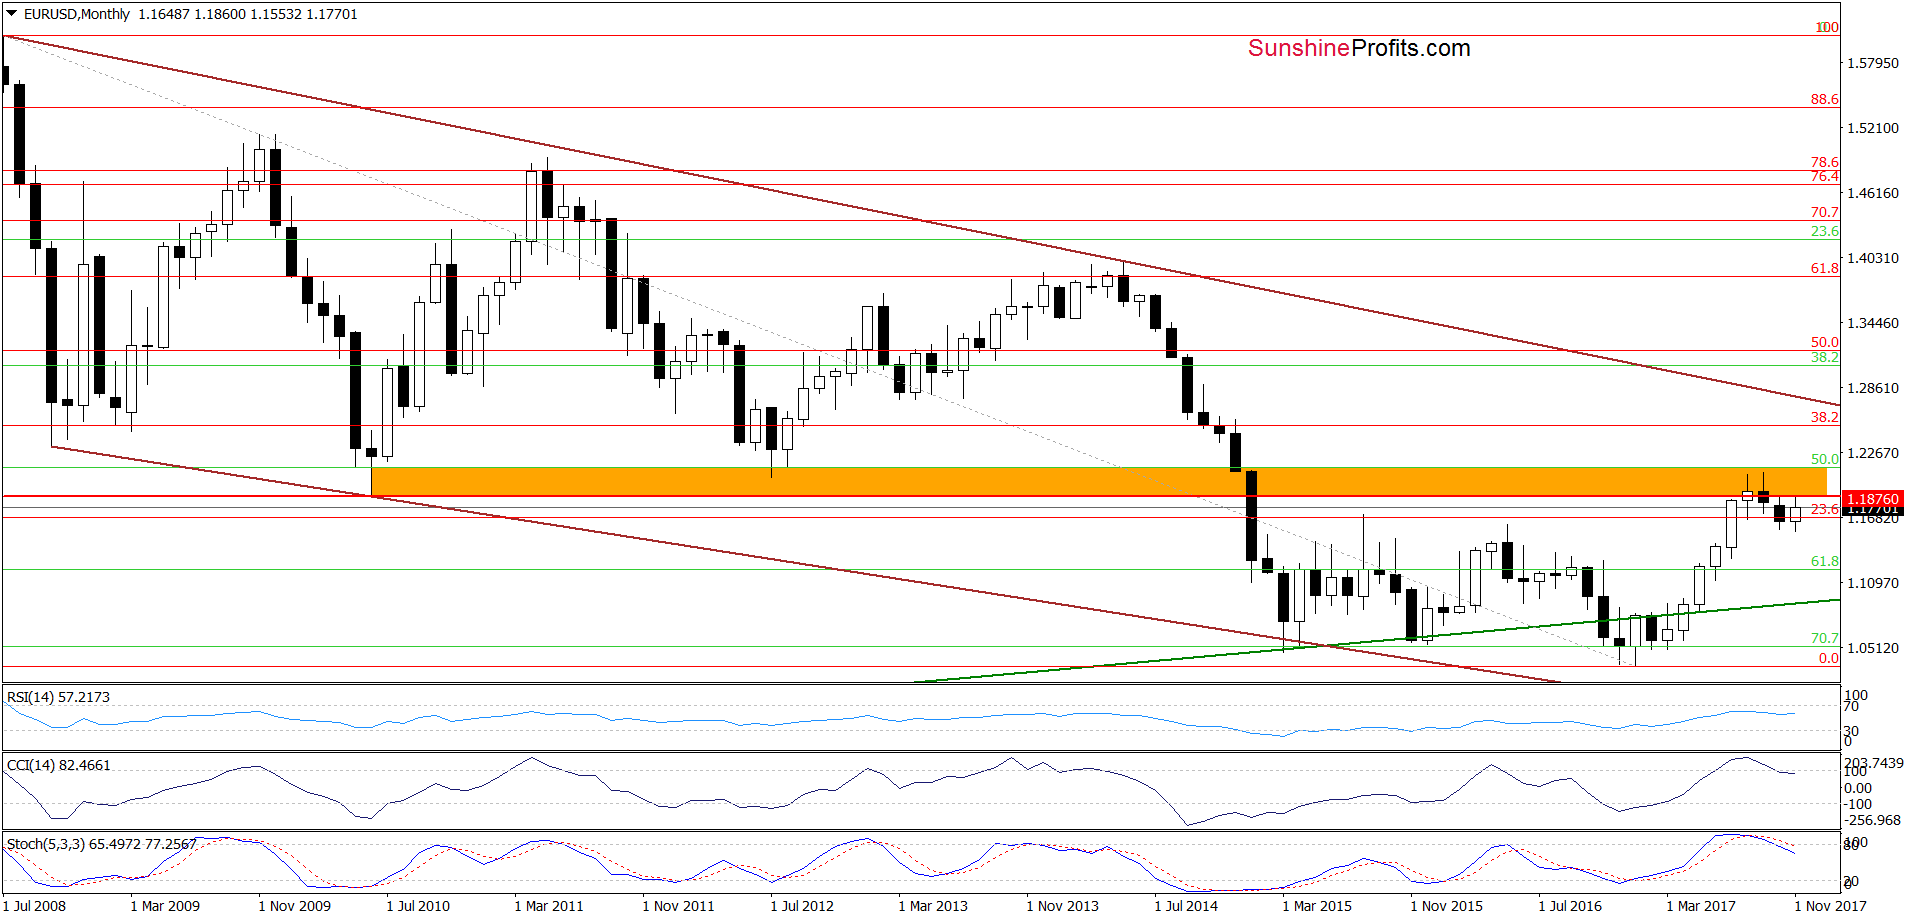
(…) the exchange rate extended gains and approached October highs (and the orange resistance zone marked on the long-term chart), but there was no breakout above them, which resulted in a reversal and a comeback below the 50% retracement.
What’s next? The current position of the CCI and Stochastic Oscillator (they are overbought and very close to generating sell signals) suggests that further declines are just around the corner.
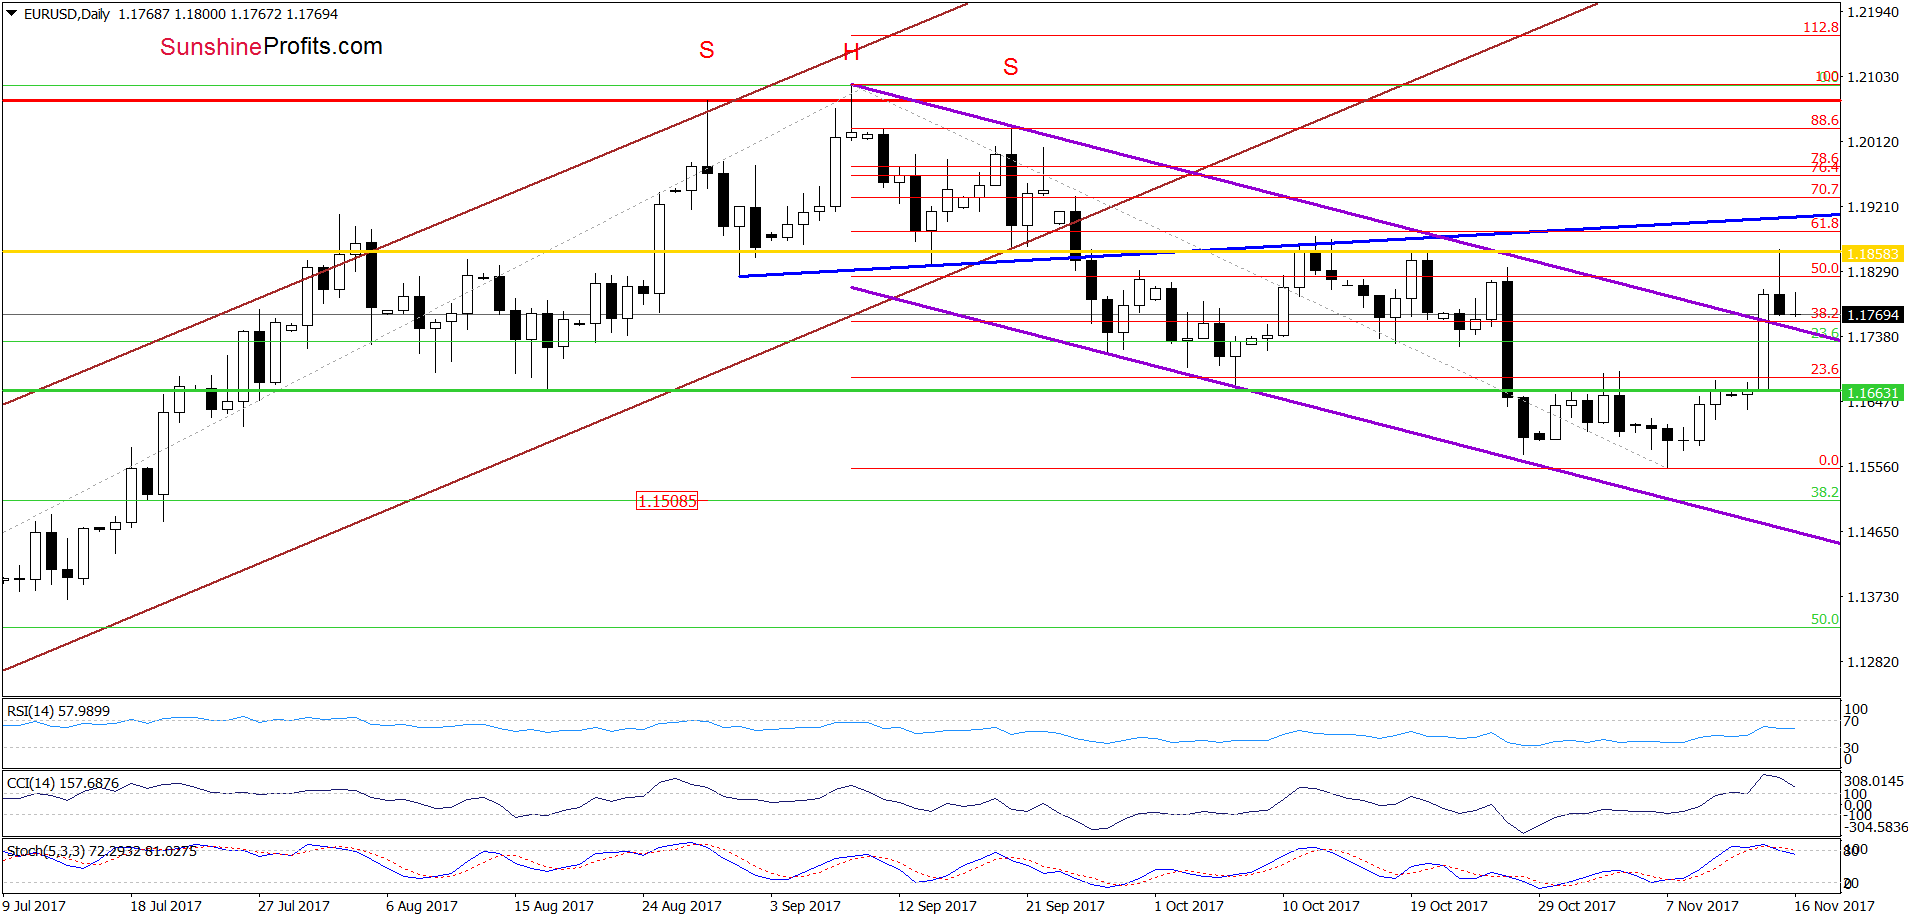
From today’s point of view, we see that currency bears pushed EUR/USD lower as we had expected. As a result, the exchange rate closed yesterday session below the 50% retracement, invalidating the earlier breakout. Taking this negative development into account and combining it with the sell signal generated by the Stochastic Oscillator (as a reminder, the CCI is very close to doing the same), we think that the pair will extend declines in the coming days. The pro bearish scenario will be even more likely if EUR/USD invalidates the breakout above the upper border of the purple declining trend channel in the following day(s).
If we see such price action, we think that currency bears will not only test the green horizontal line, but also push the pair to the 38.2% Fibonacci retracement.
Very short-term outlook: mixed with bearish bias
Short-term outlook: bearish
MT outlook: mixed
LT outlook: mixed
Trading position (short-term; our opinion): Profitable short positions (with a stop-loss order at 1.2250 and the initial downside target at 1.1510) are justified from the risk/reward perspective. We will keep you informed should anything change, or should we see a confirmation/invalidation of the above.
USD/CAD
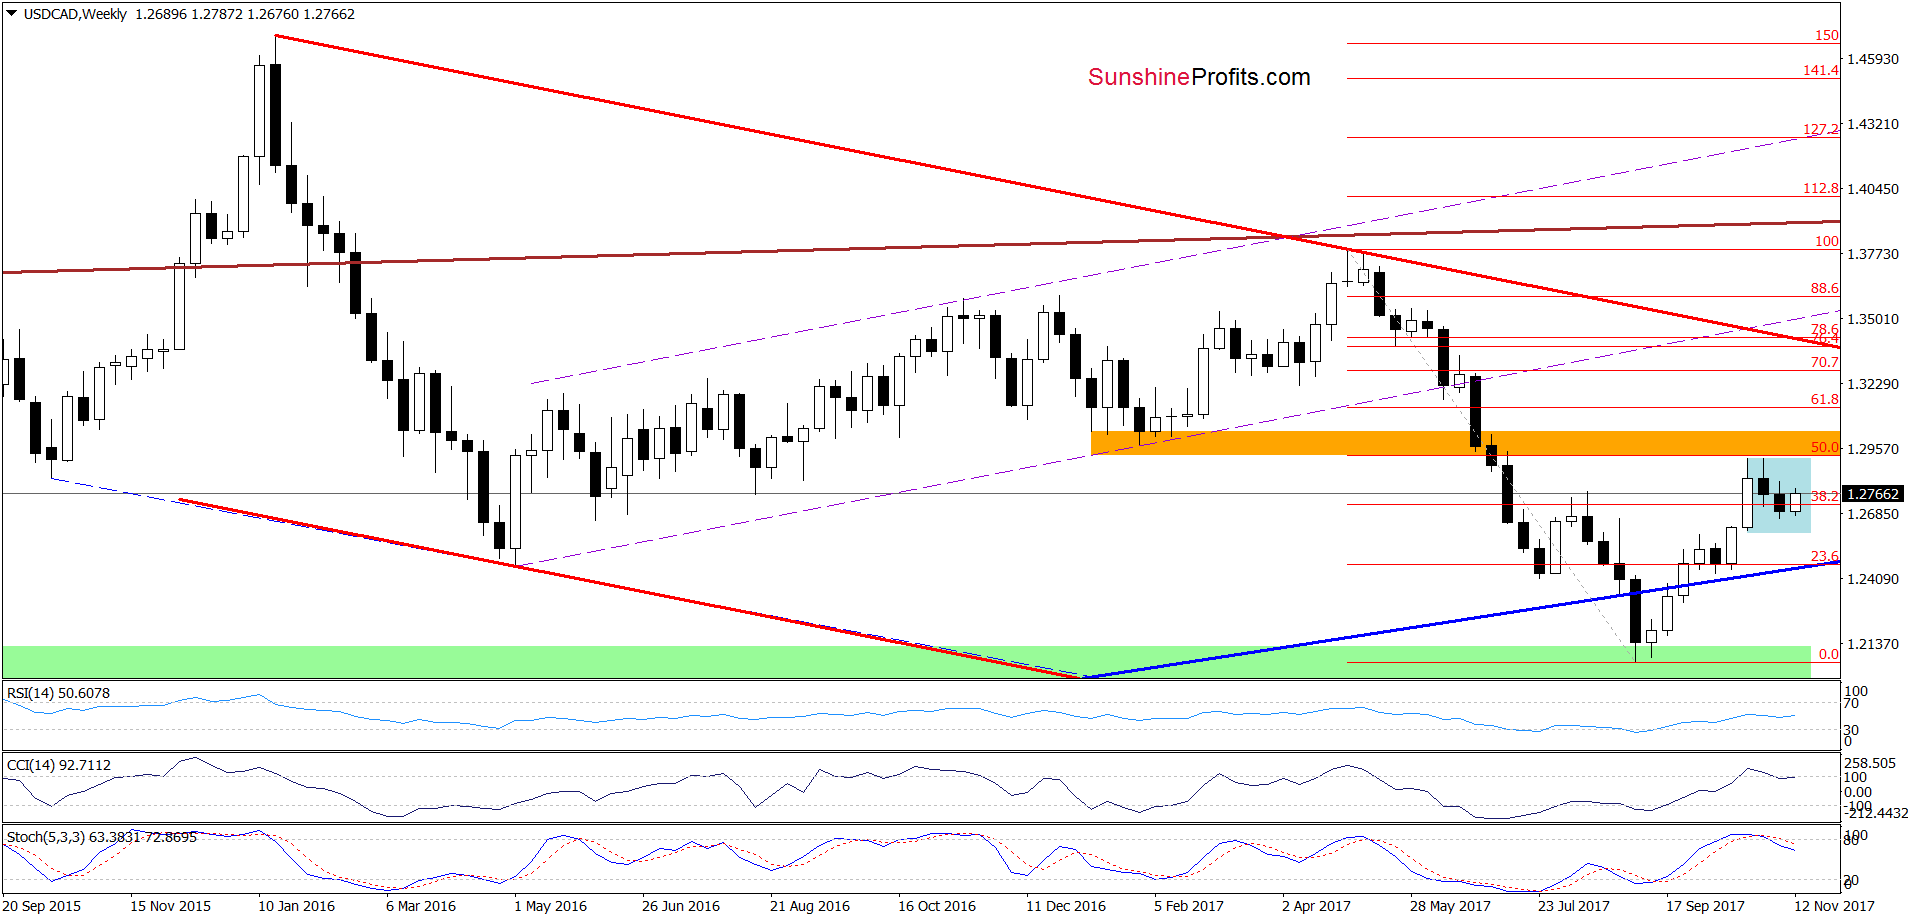
On the weekly chart, we see that USD/CAD remains in the blue consolidation, which suggests that as long as there is no breakout above the upper border of the formation or a breakdown under the lower line, the situation will remain a bit unclear and short-lived moves in both directions should not surprise us.
Will the very short-term chart give us more clues about future moves? Let’s check
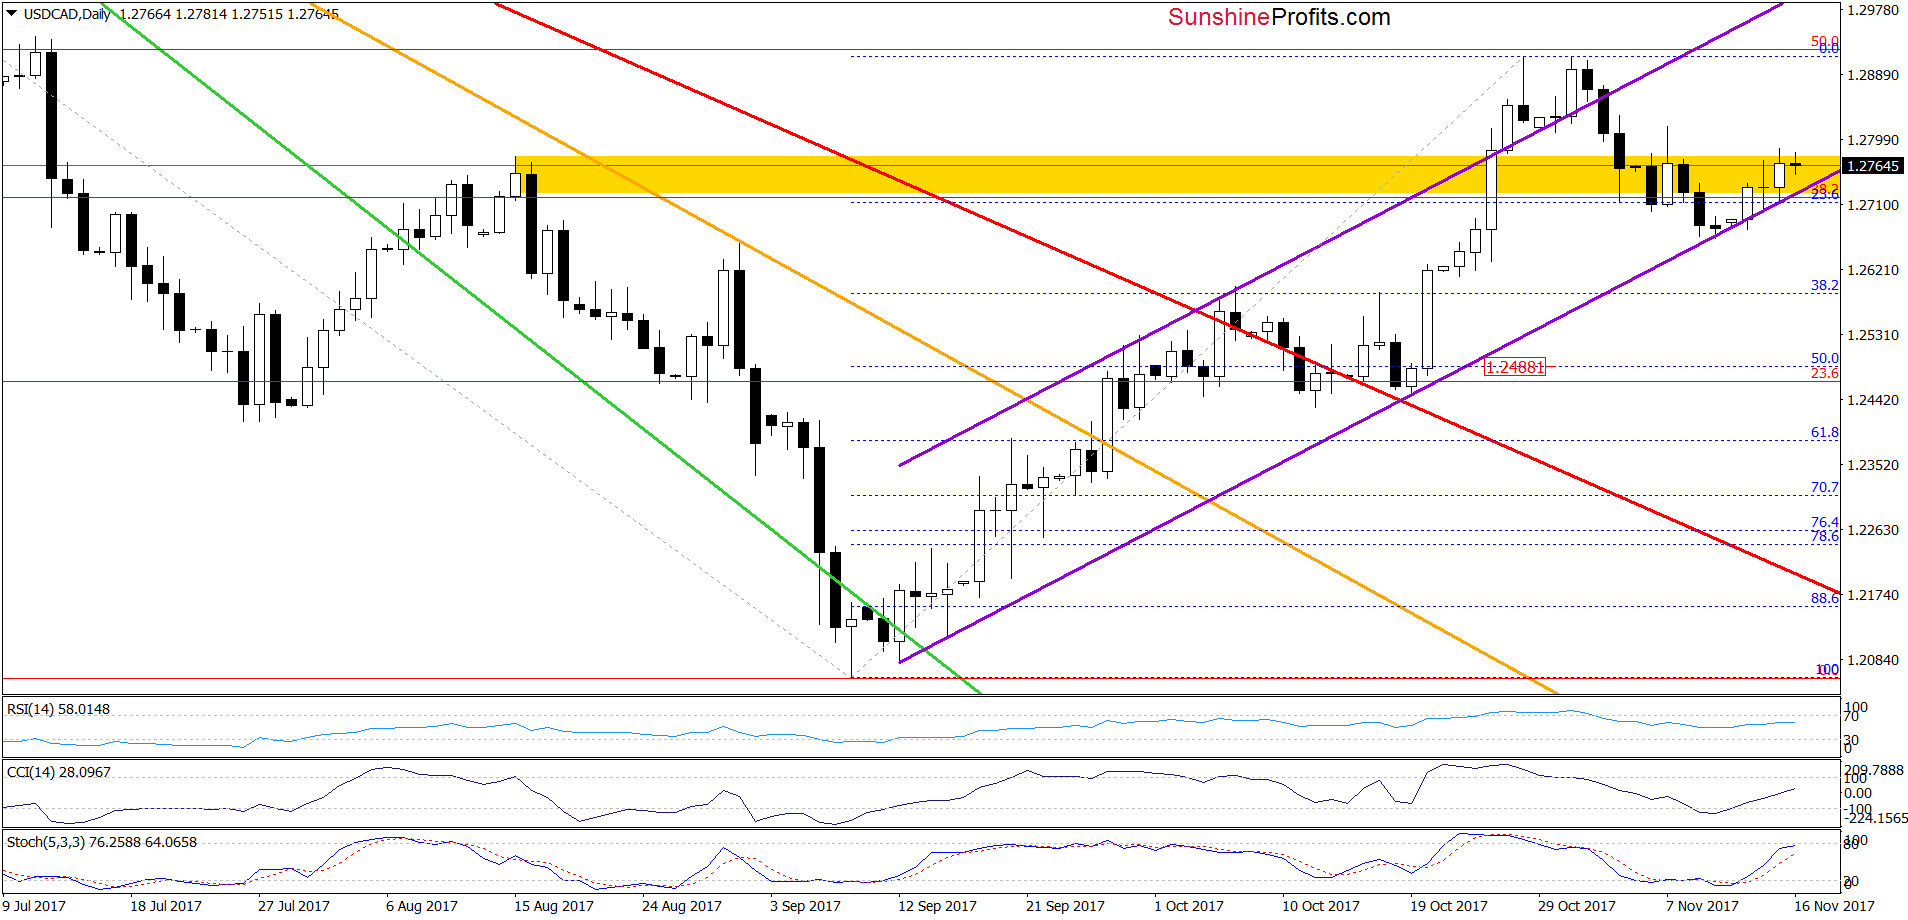
Looking at the daily chart, we see that USD/CAD bounced off the lower border of the purple rising trend channel and came back to the yellow resistance zone. Although the pair reversed from similar levels in the previous week, the buy signals generated by the indictors remain in play, suggesting that further improvement (and even a test of the October highs) should not surprise us.
Very short-term outlook: mixed with bullish bias
Short-term outlook: mixed
MT outlook: mixed
LT outlook: mixed
Trading position (short-term; our opinion): No positions are justified from the risk/reward perspective at the moment. We will keep you informed should anything change, or should we see a confirmation/invalidation of the above.
USD/CHF
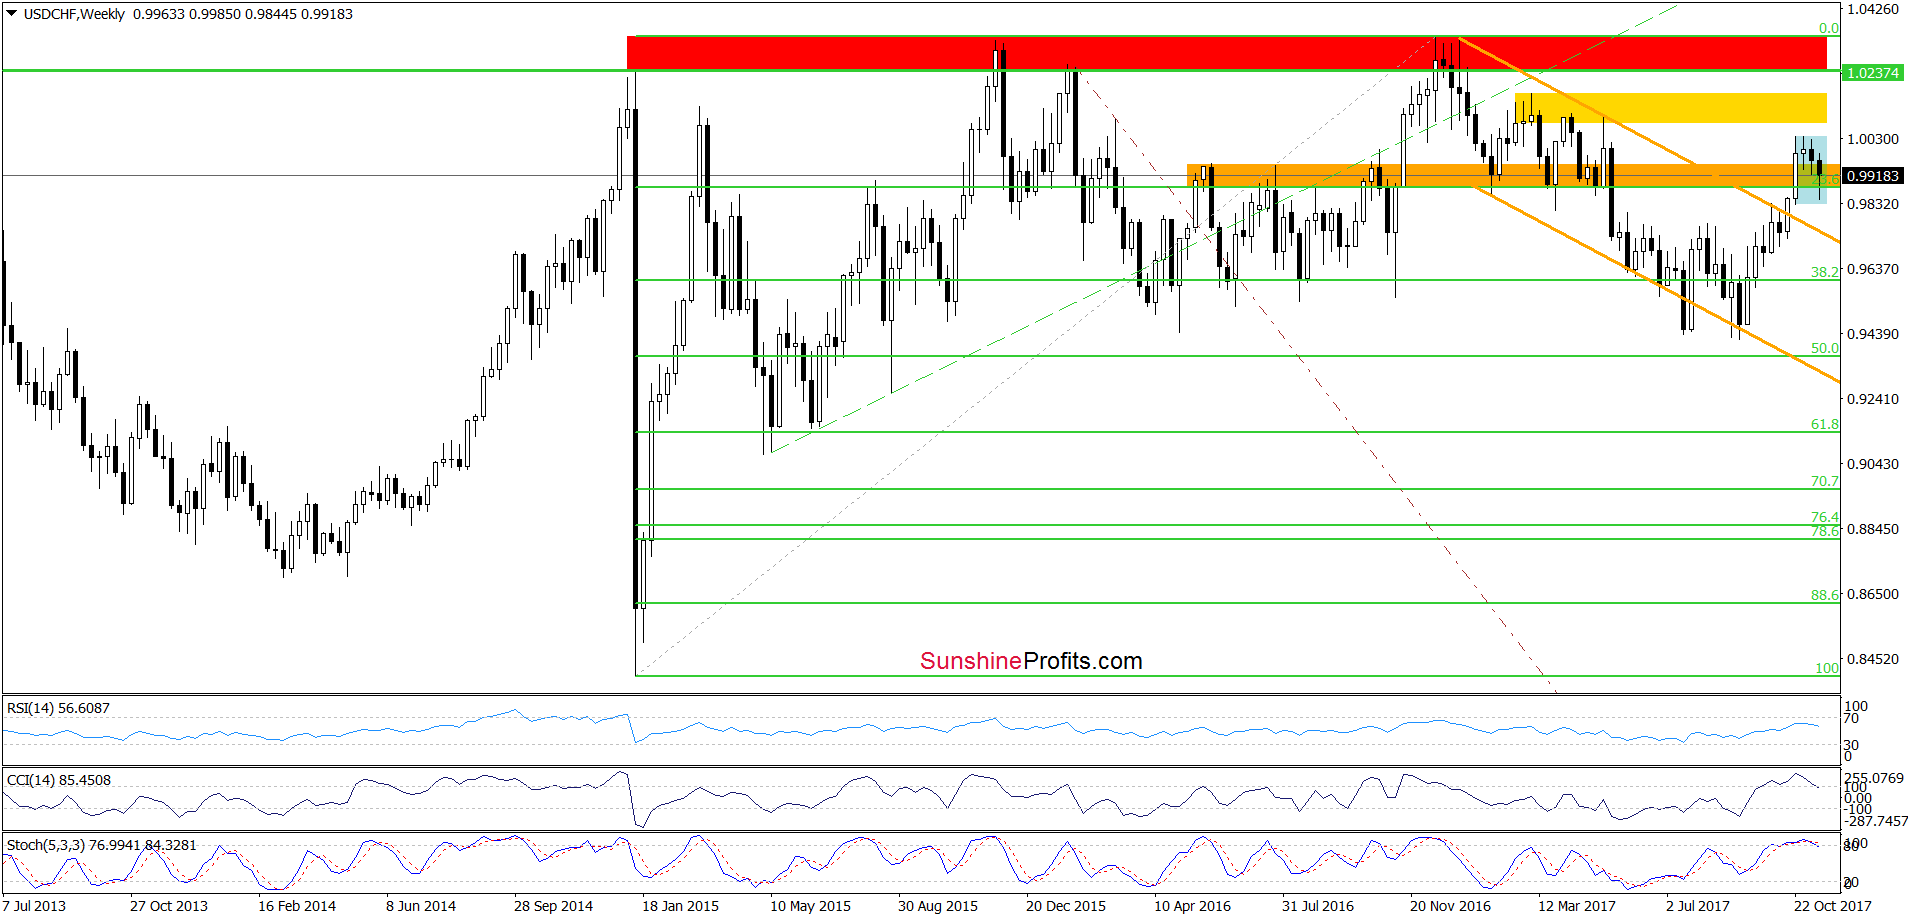
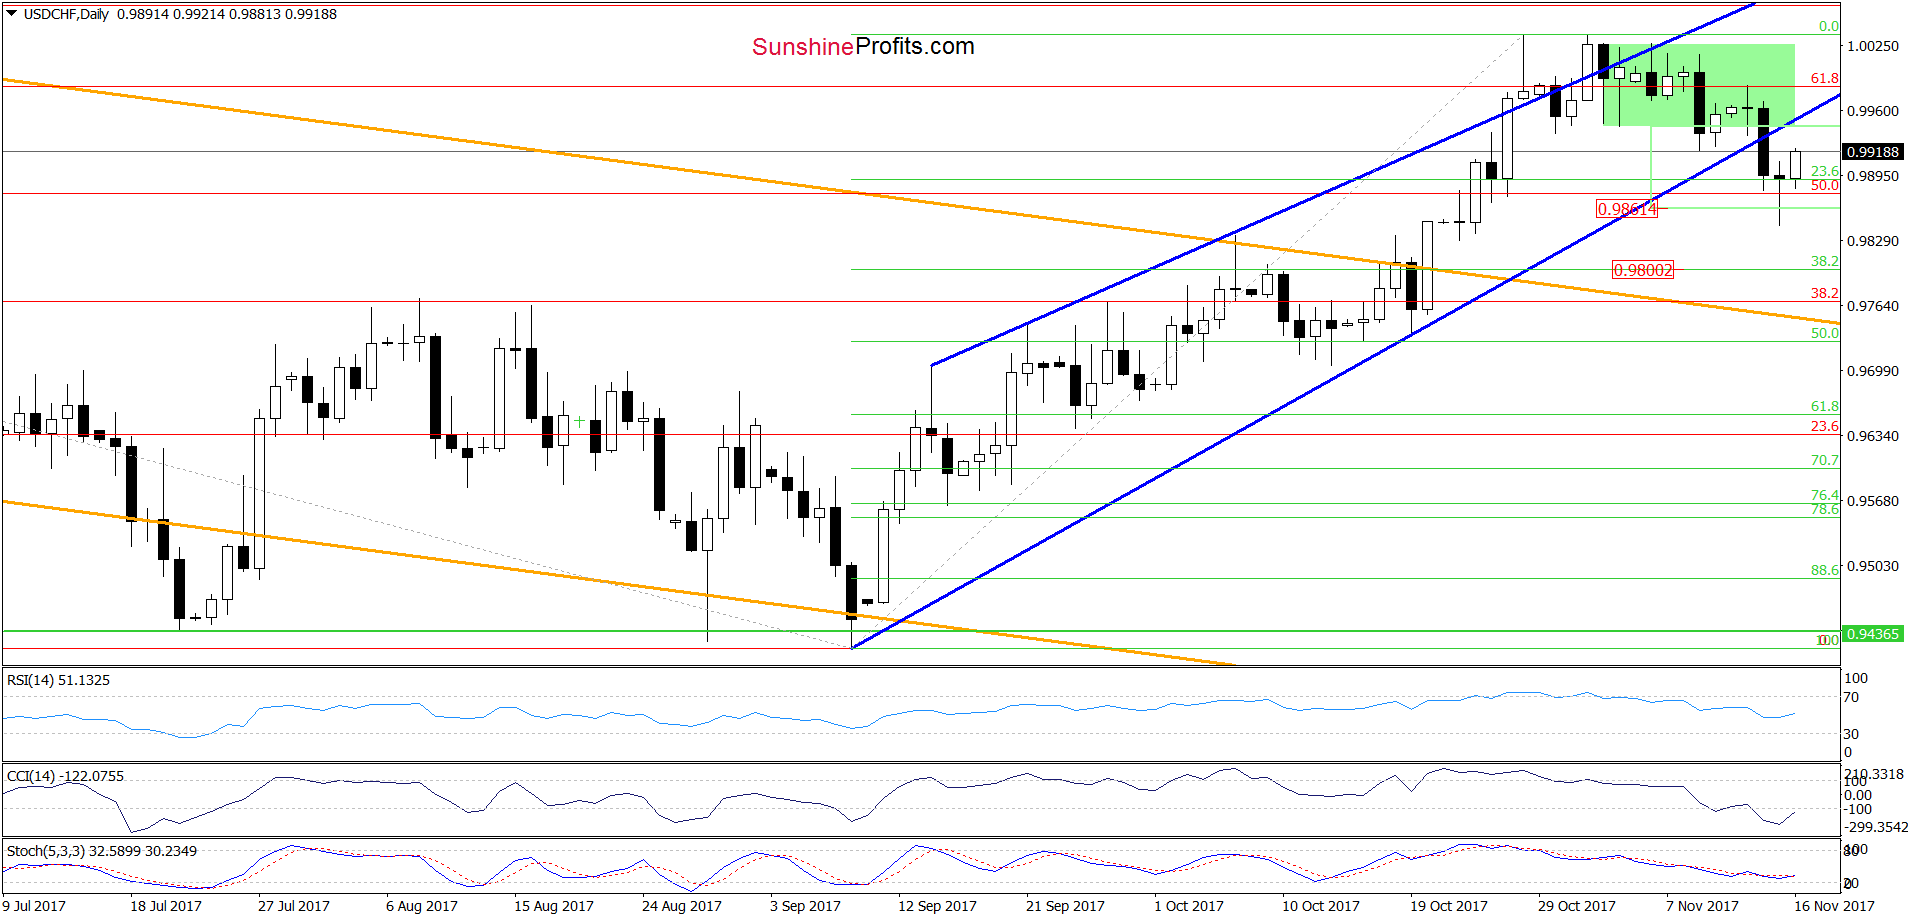
Quoting our last commentary on this currency pair:
(…) the pair dropped under the lower border of the blue rising wedge, which doesn’t bode well for higher values of the exchange rate in the coming days. Why? Because if the pair closes today’s session under this line, we could see a drop to around 0.9861 (in this area the size of the move will correspond to the height of the green consolidation) or even to the 38.3% Fibonacci retracement around 0.9800 in the following days.
From the very short-term perspective, we see that the situation developed in line with the above scenario as USD/CHF slipped under our first downside target. As you can see on the weekly chart, yesterday drop approached the exchange rate to the lower border of the blue consolidation, which encouraged currency bulls to act. Additionally, the CCI and the Stochastic Oscillator are very close to generating buy signals, which increases the probability of further improvement and a test of the previously-broken lower border of the blue rising wedge. What could happen if this resistance is broken? In our opinion, the exchange rate will extend upward move and test October highs in the following days.
Very short-term outlook: mixed with bullish bias
Short-term outlook: mixed
MT outlook: mixed
LT outlook: mixed
Trading position (short-term; our opinion): No positions are justified from the risk/reward perspective at the moment. We will keep you informed should anything change, or should we see a confirmation/invalidation of the above.
Thank you.
Nadia Simmons
Forex & Oil Trading Strategist
Przemyslaw Radomski, CFA
Founder, Editor-in-chief, Gold & Silver Fund Manager
Gold & Silver Trading Alerts
Forex Trading Alerts
Oil Investment Updates
Oil Trading Alerts

