

Yesterday, the greenback extended losses against the Canadian dollar, which resulted in a drop below the May 2016 low. Does it mean that the way to lower levels is open?
In our opinion the following forex trading positions are justified - summary:
- EUR/USD: short (a stop-loss order at 1.1803; the initial downside target at 1.1408)
- GBP/USD: short (a stop-loss order at 1.3232; the initial downside target at 1.2375)
- USD/JPY: none
- USD/CAD: none
- USD/CHF: none
- AUD/USD: none
EUR/USD
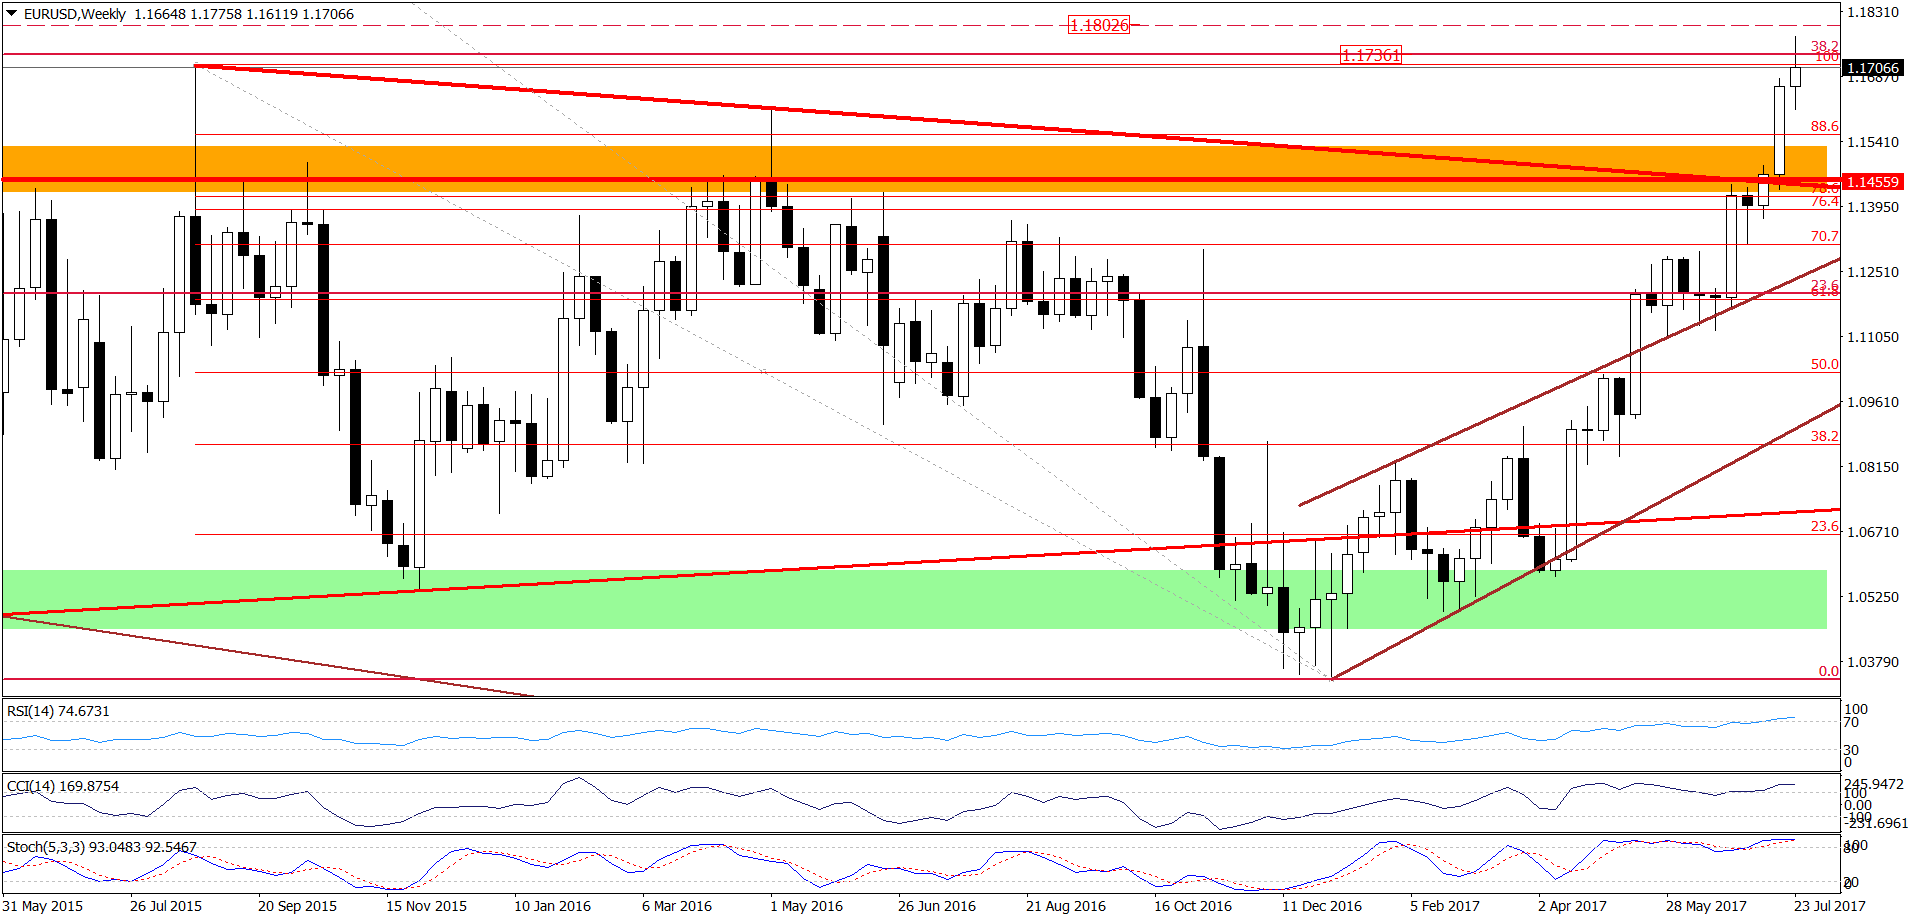
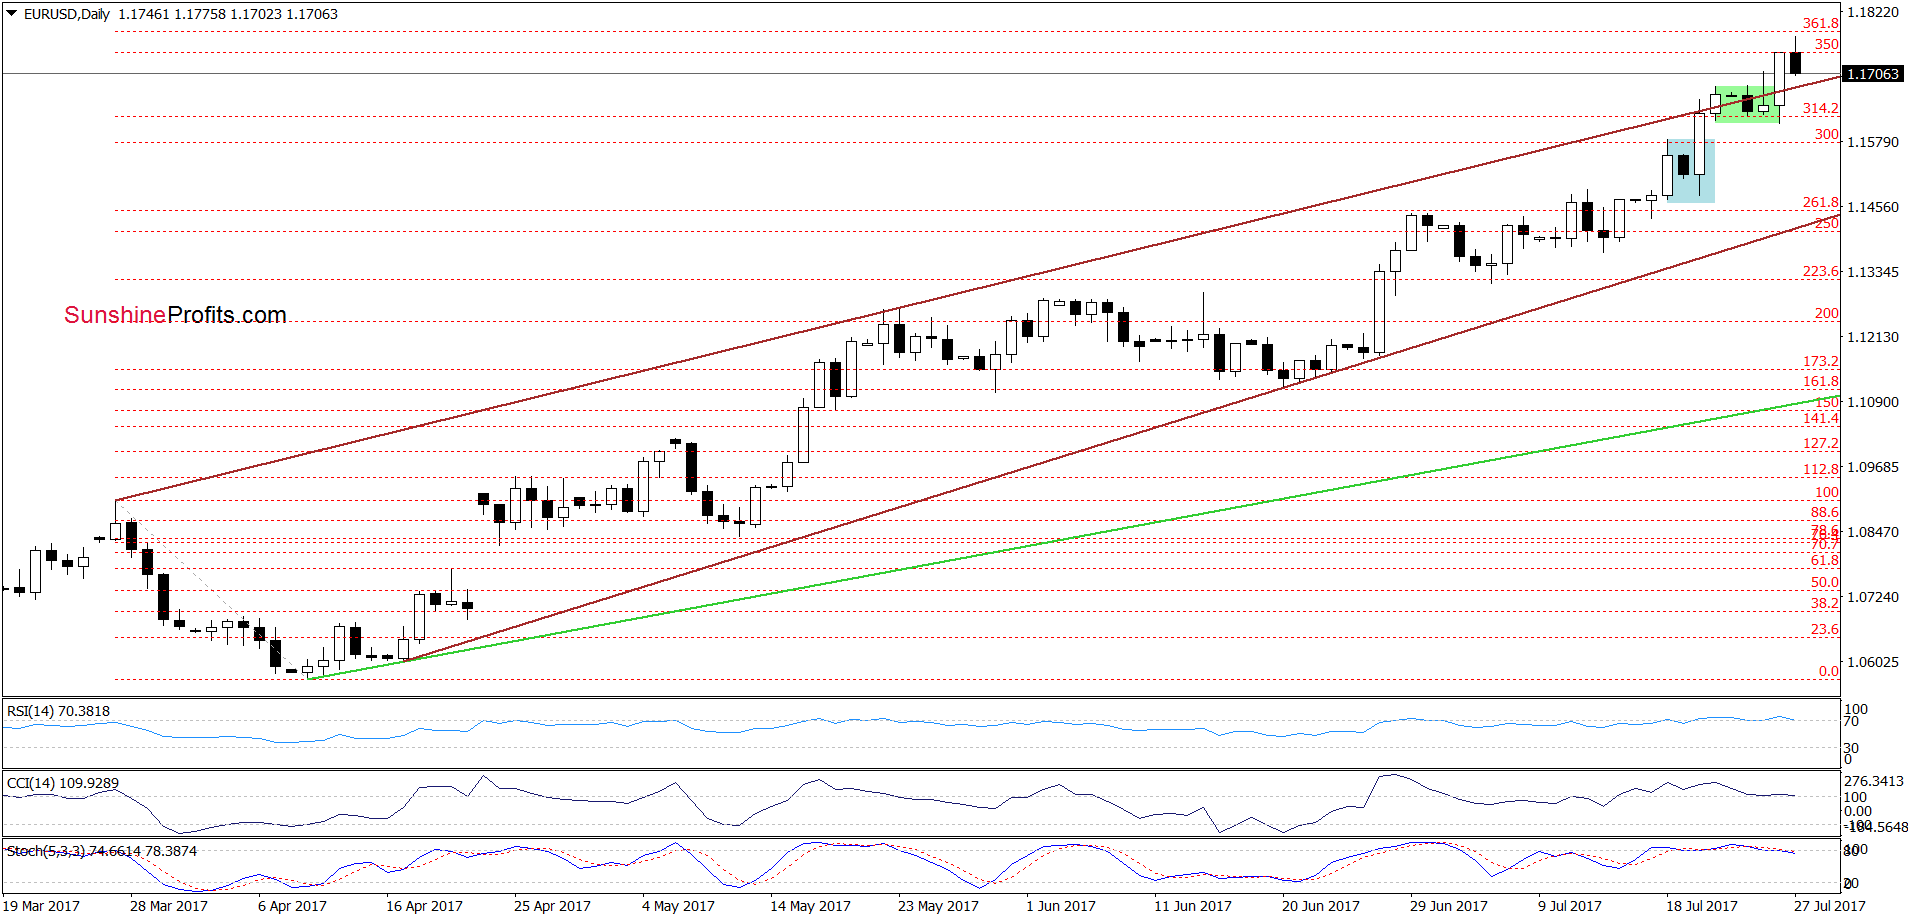
Yesterday, EUR/USD came back above the upper border of the green consolidation and the upper border of the brown rising trend channel, invalidating the earlier breakdown under these lines. Thanks to this move the exchange rate also climbed above the August 2015 peak and the 38.2% Fibonacci retracement (both seen on the weekly chart). Despite this improvement, currency bulls didn’t manage to hold these levels, which encouraged their opponents to act earlier today. As a result, the pair pulled back and slipped under the August 2015 peak and the 38.2% Fibonacci retracement, invalidating the earlier breakout. Although this is a negative development, it will turn into bearish if EUR/USD closes this week under these two major resistance levels. If additionally, the exchange rate invalidates the breakout above the upper border of the green consolidation and the upper border of the brown rising trend channel currency bears will receive important reasons to act. In this case, we’ll likely see an acceleration of declines and EUR/USD will drop to its first downside target around 1.1408, where the lower border of the brown rising trend channel currently is. If this support is broken, the way to lower levels will be open.
Very short-term outlook: mixed with bearish bias
Short-term outlook: bearish
MT outlook: mixed
LT outlook: mixed
Trading position (short-term; our opinion): Short positions (with a stop-loss order at 1.1803 and the initial downside target at 1.1408) are justified from the risk/reward perspective. We will keep you informed should anything change, or should we see a confirmation/invalidation of the above.
USD/JPY
On Friday, we wrote the following:
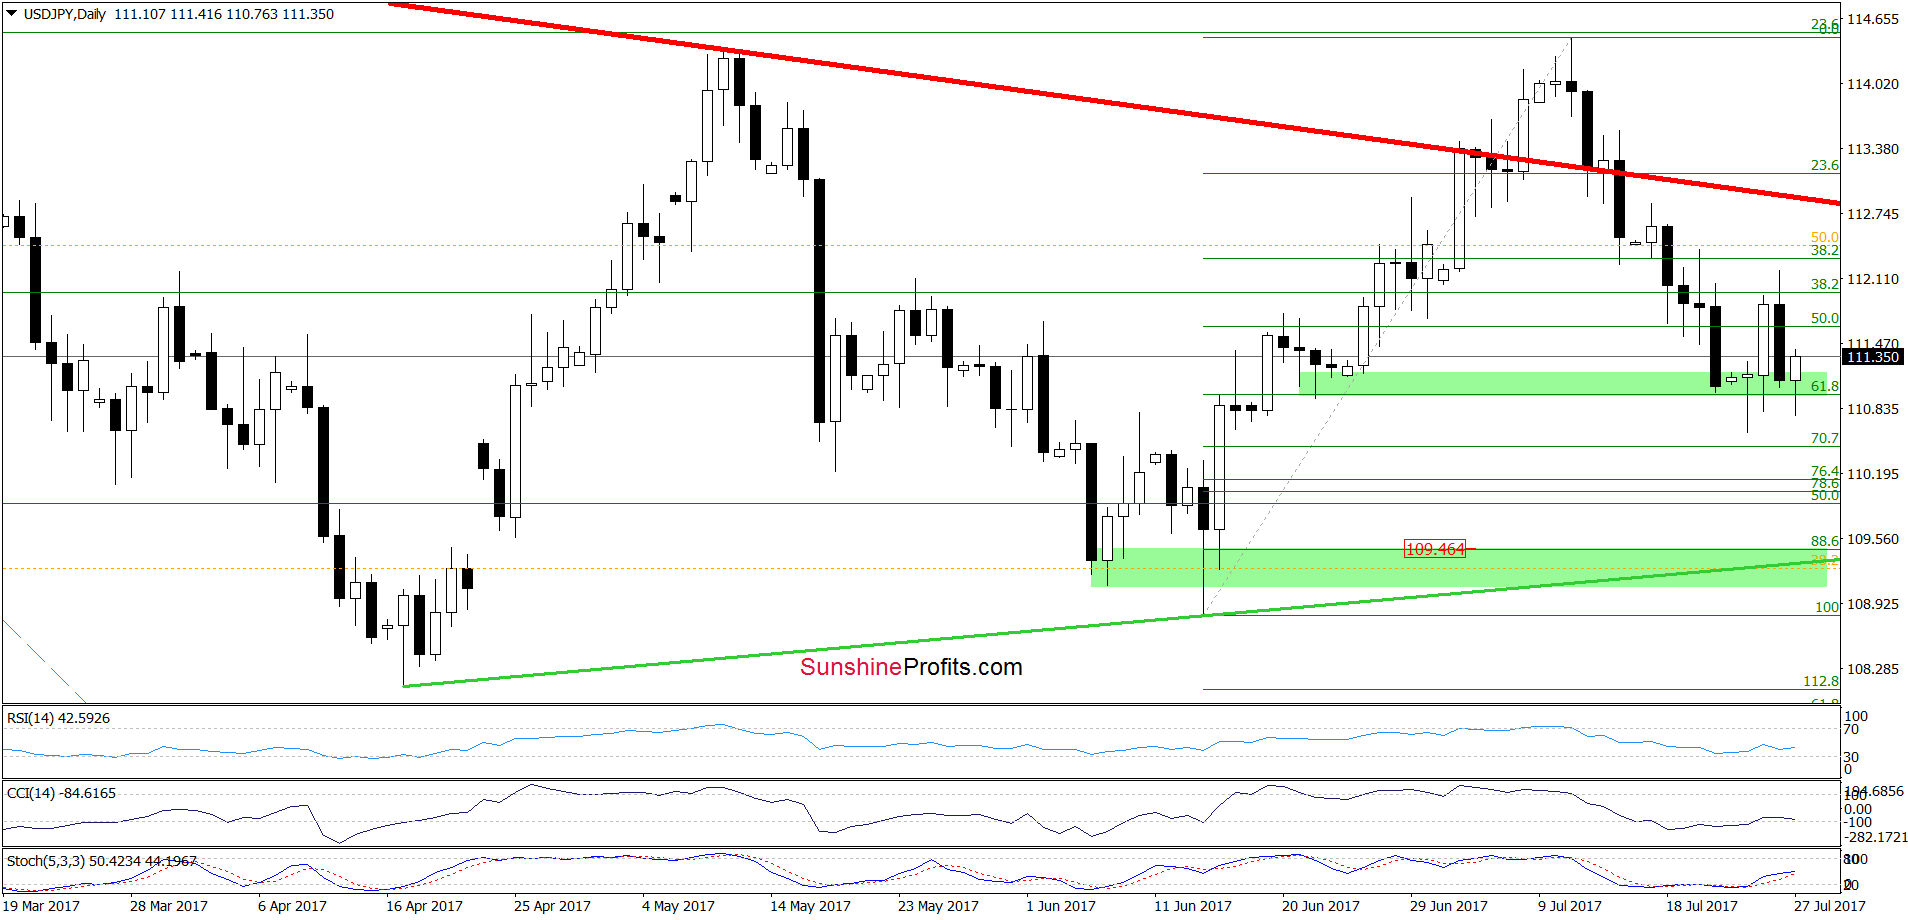
(...) the breakdown under the red declining support line encouraged currency bears to act. As you see on the daily chart, a decline below the 38.2% Fibonacci retracement triggered further deterioration and a drop below the next retracement. What’s next? Taking into account an invalidation of the breakout above the red line and a drop below the 50% retracement, we think that the pair will extend losses and test the nearest green support zone in the coming day(s).
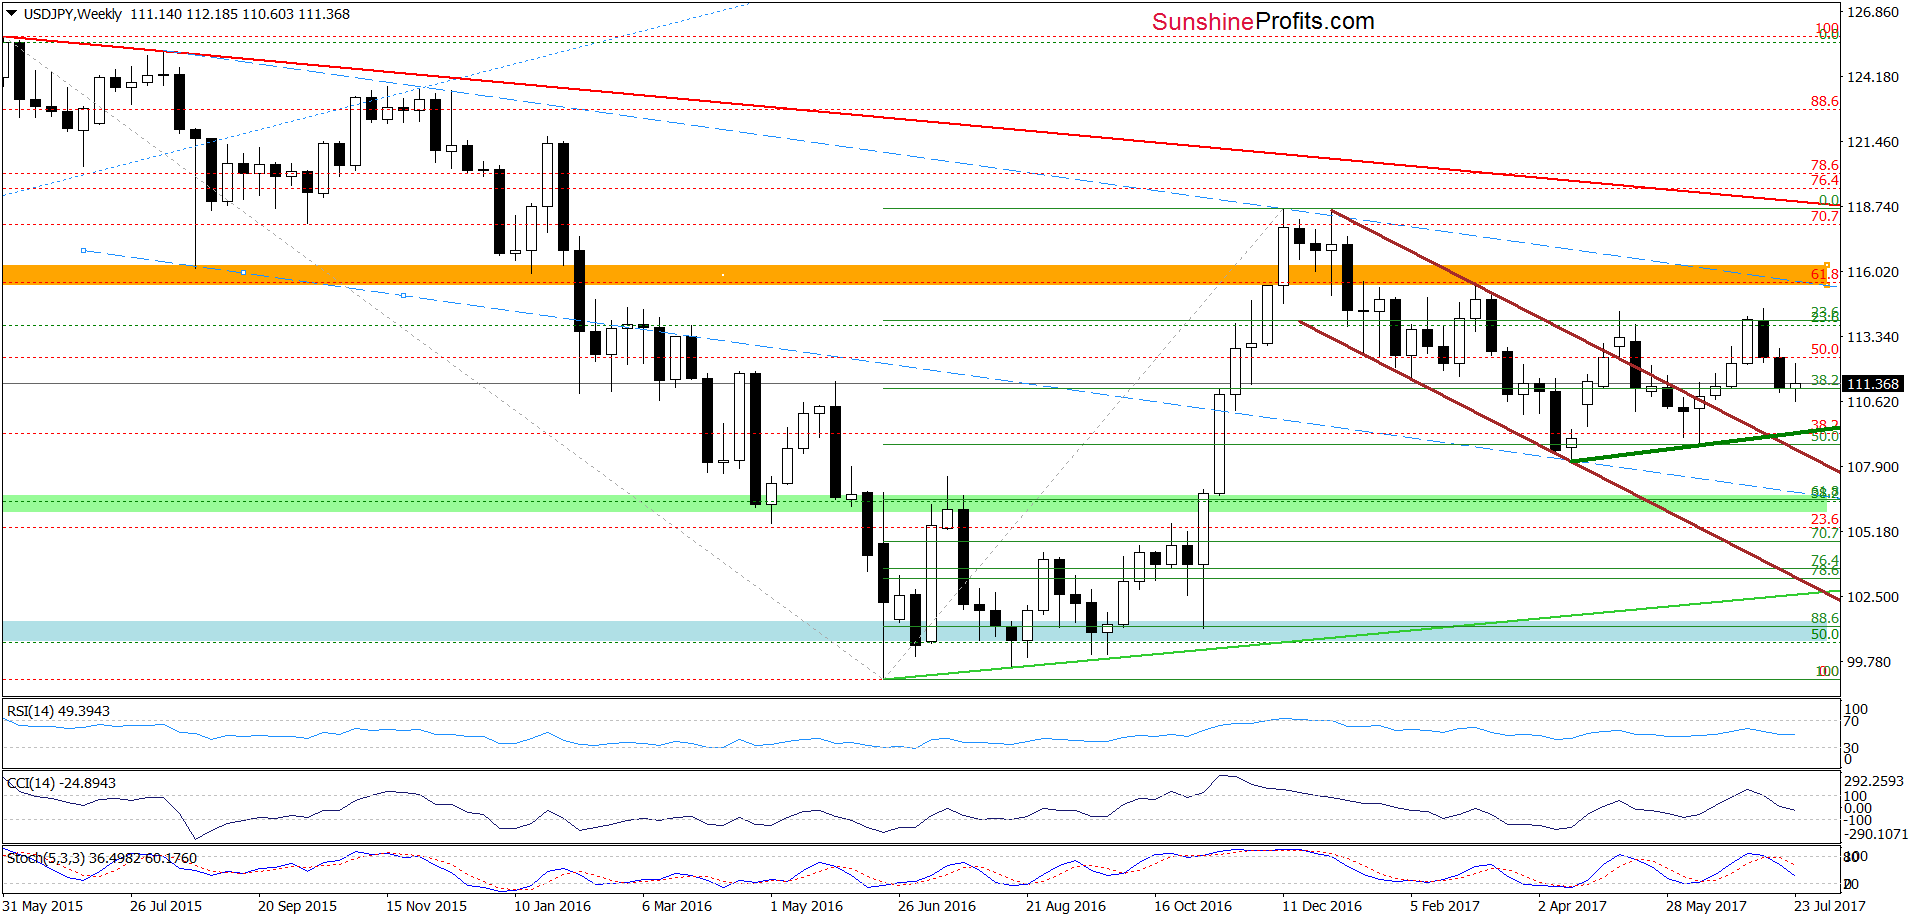
From tody’s point of view, we see that the situation developed in line with the above scenario and USD/JPY slipped to our downside target. Although the green support area triggered a rebound earlier this week, the par reversed and declined sharply yesterday, erasing almost all earlier gains. In this way the pair re-tested the strength og the green support zone once again. Will it withstand the selling pressure in the coming days? The buy signals genered by the indictors suggest that currency bulls will try to push the pair higher. Nevertheless, if we zoom out our picture and take a closer look at the weekly chart, we notice that the sell signals generated by the indicators continue to suport currency bears and further deterioration.
Therefore, if the nearest green support area is broken, we may see a drop to around 109.46, where the upper border of the next green support zone is. This zone is currently also crossed by the medium-term green support line based on the previous lows, which incresed the probability that this area will stop declines for longer and trigger a significant rebound.
Very short-term outlook: mixed
Short-term outlook: mixed with bearish bias
MT outlook: mixed
LT outlook: mixed
Trading position (short-term; our opinion): No positions are justified from the risk/reward perspective at the moment. We will keep you informed should anything change, or should we see a confirmation/invalidation of the above.
USD/CAD
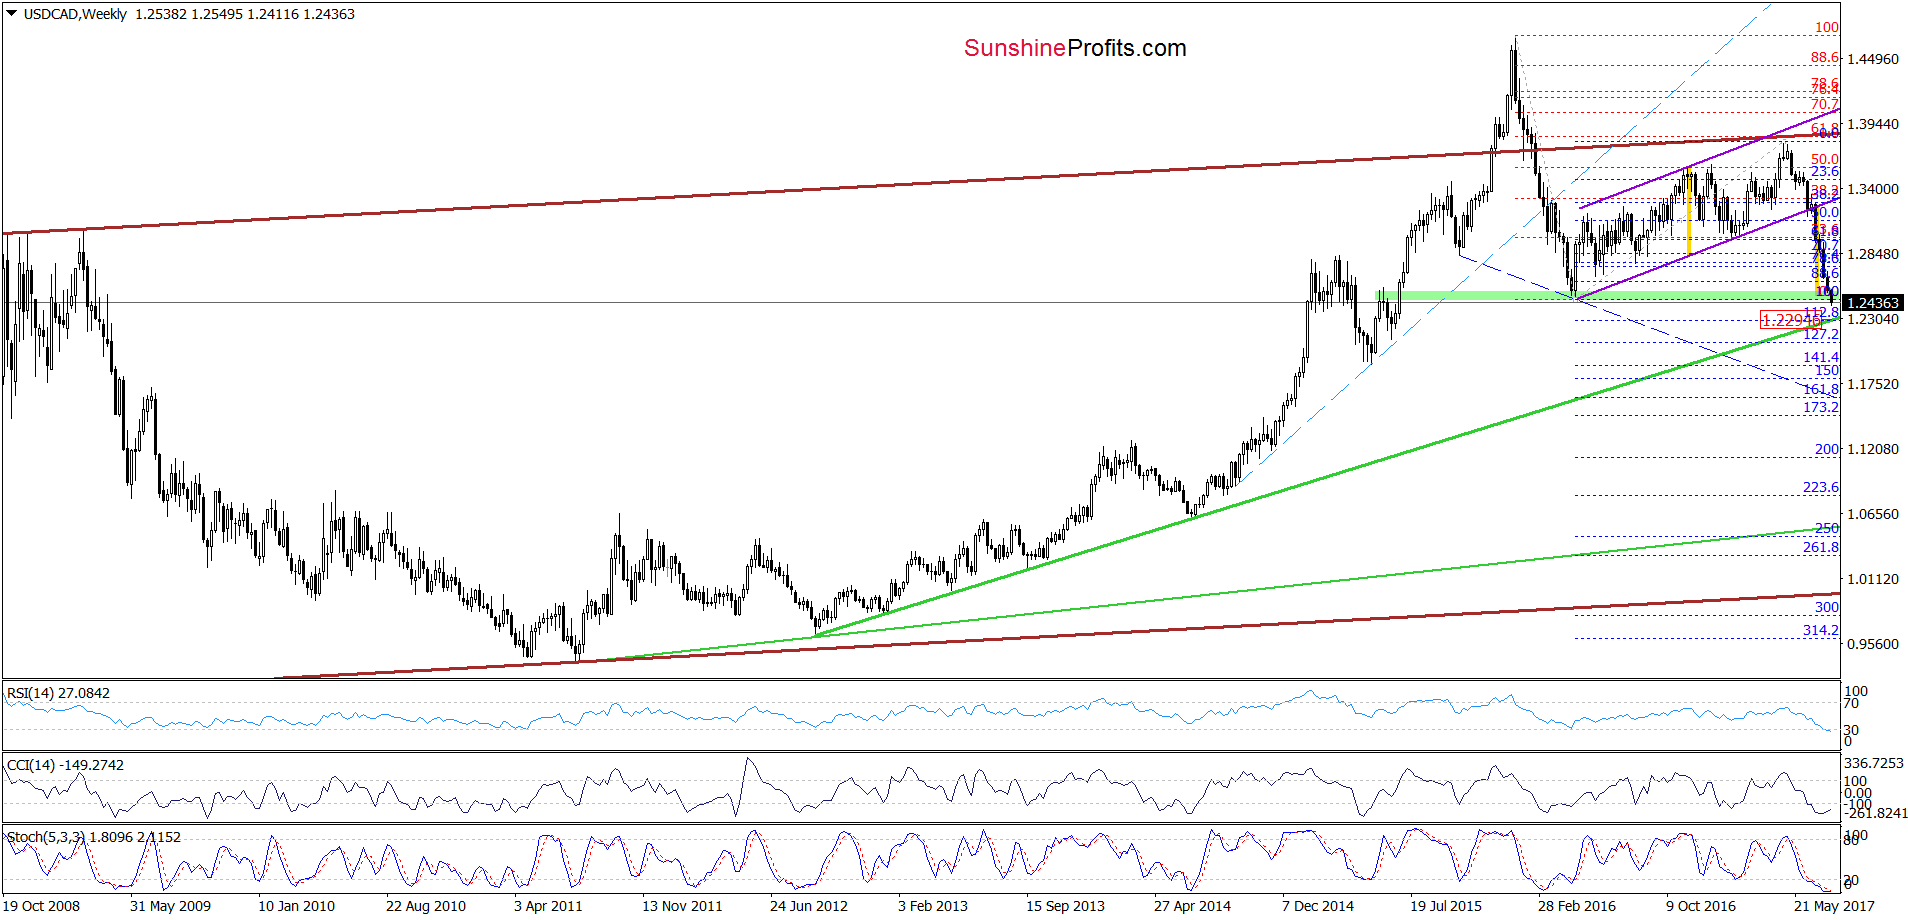
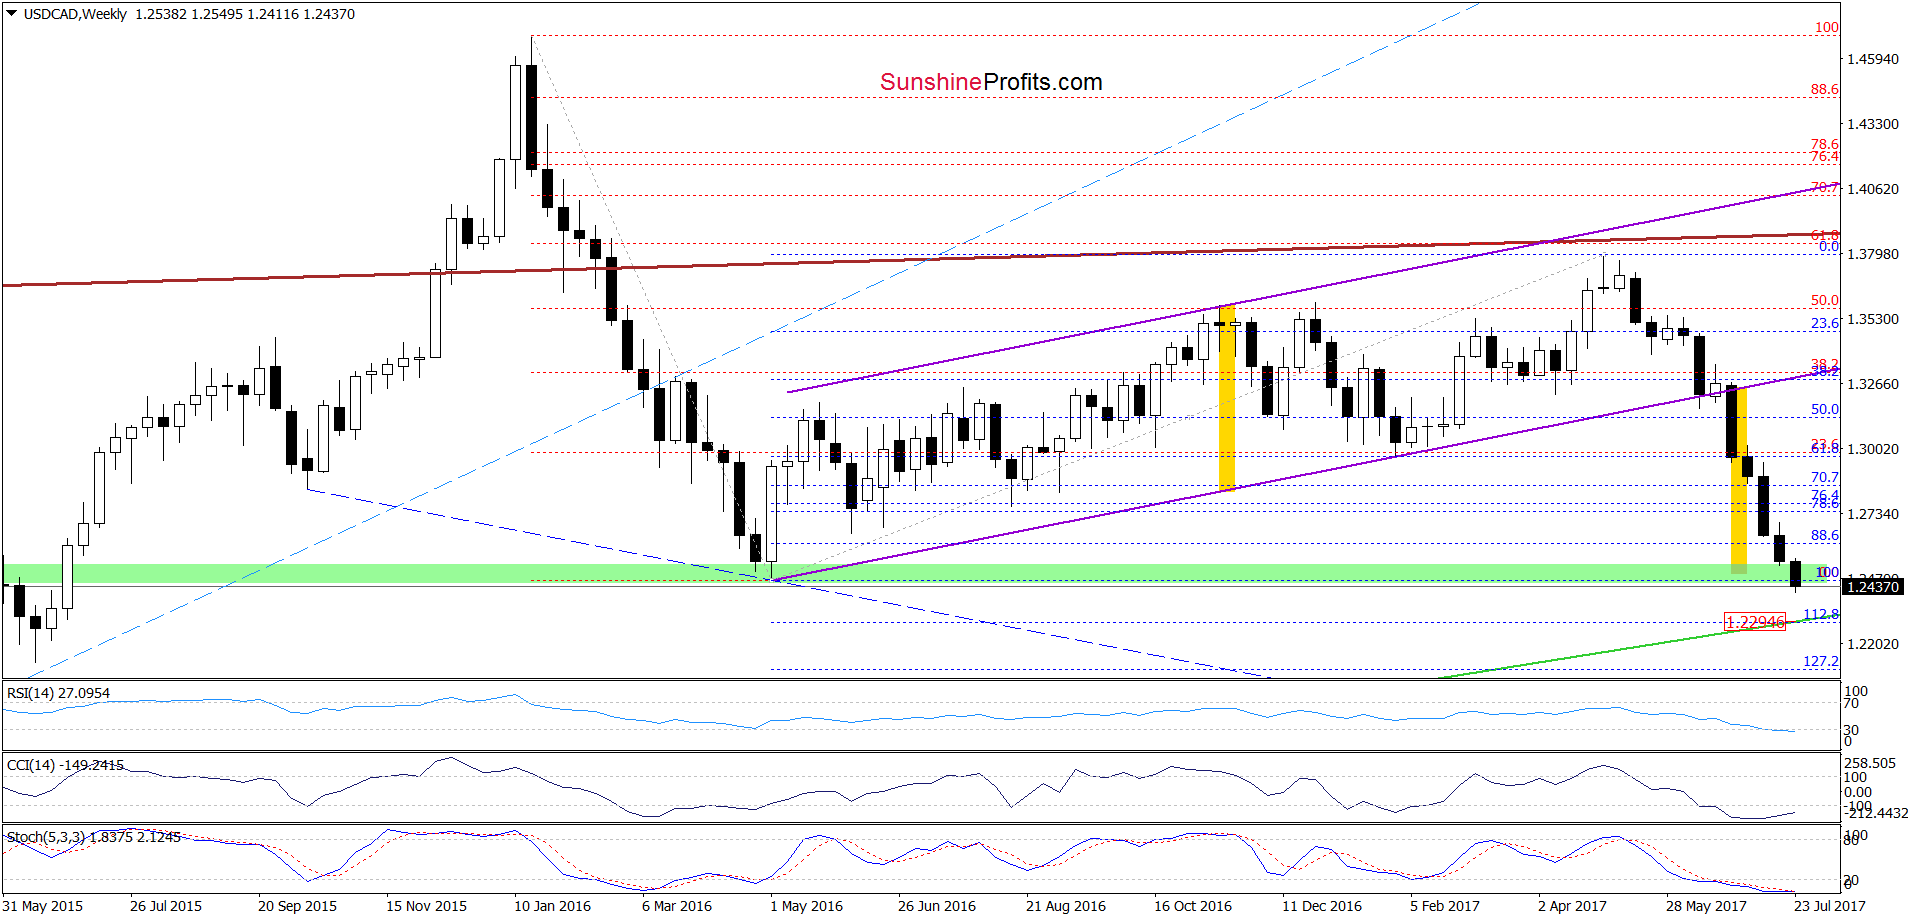
On the above charts, we see that USD/CAD dropped below the green support area and the May 2015 low, which is a negative event and suggests a test of the 112.8% Fibonacci extension and the long-term green support line (based on the September 2012, January, May, September 2013 and June 2014 lows) in the coming days. Nevertheless, taking into account the importance of this support line (it stopped currency bears five times in the past) and the current position of the daily and weekly indicators, we think that reversal an bigger move to the upside are just around the corner. Therefore if we see any reliable bullish factors on the horizon, we’ll consider opening long positions.
Very short-term outlook: mixed with bearish bias
Short-term outlook: mixed with bullish bias
MT outlook: mixed
LT outlook: mixed
Trading position (short-term; our opinion): No positions are justified from the risk/reward perspective at the moment. We will keep you informed should anything change, or should we see a confirmation/invalidation of the above.
Thank you.
Nadia Simmons
Forex & Oil Trading Strategist
Przemyslaw Radomski, CFA
Founder, Editor-in-chief, Gold & Silver Fund Manager
Gold & Silver Trading Alerts
Forex Trading Alerts
Oil Investment Updates
Oil Trading Alerts

