

Yesterday, the greenback moved sharply higher against the British pound, which approached GBP/USD to the previously-broken August peaks. Will this support manage to stop currency bears in the coming days?
In our opinion the following forex trading positions are justified - summary:
- EUR/USD: short (a stop-loss order at 1.2250; the initial downside target at 1.1466)
- GBP/USD: short (a stop-loss order at 1.3773; the initial downside target at 1.3317)
- USD/JPY: none
- USD/CAD: none
- USD/CHF: none
- AUD/USD: none
EUR/USD
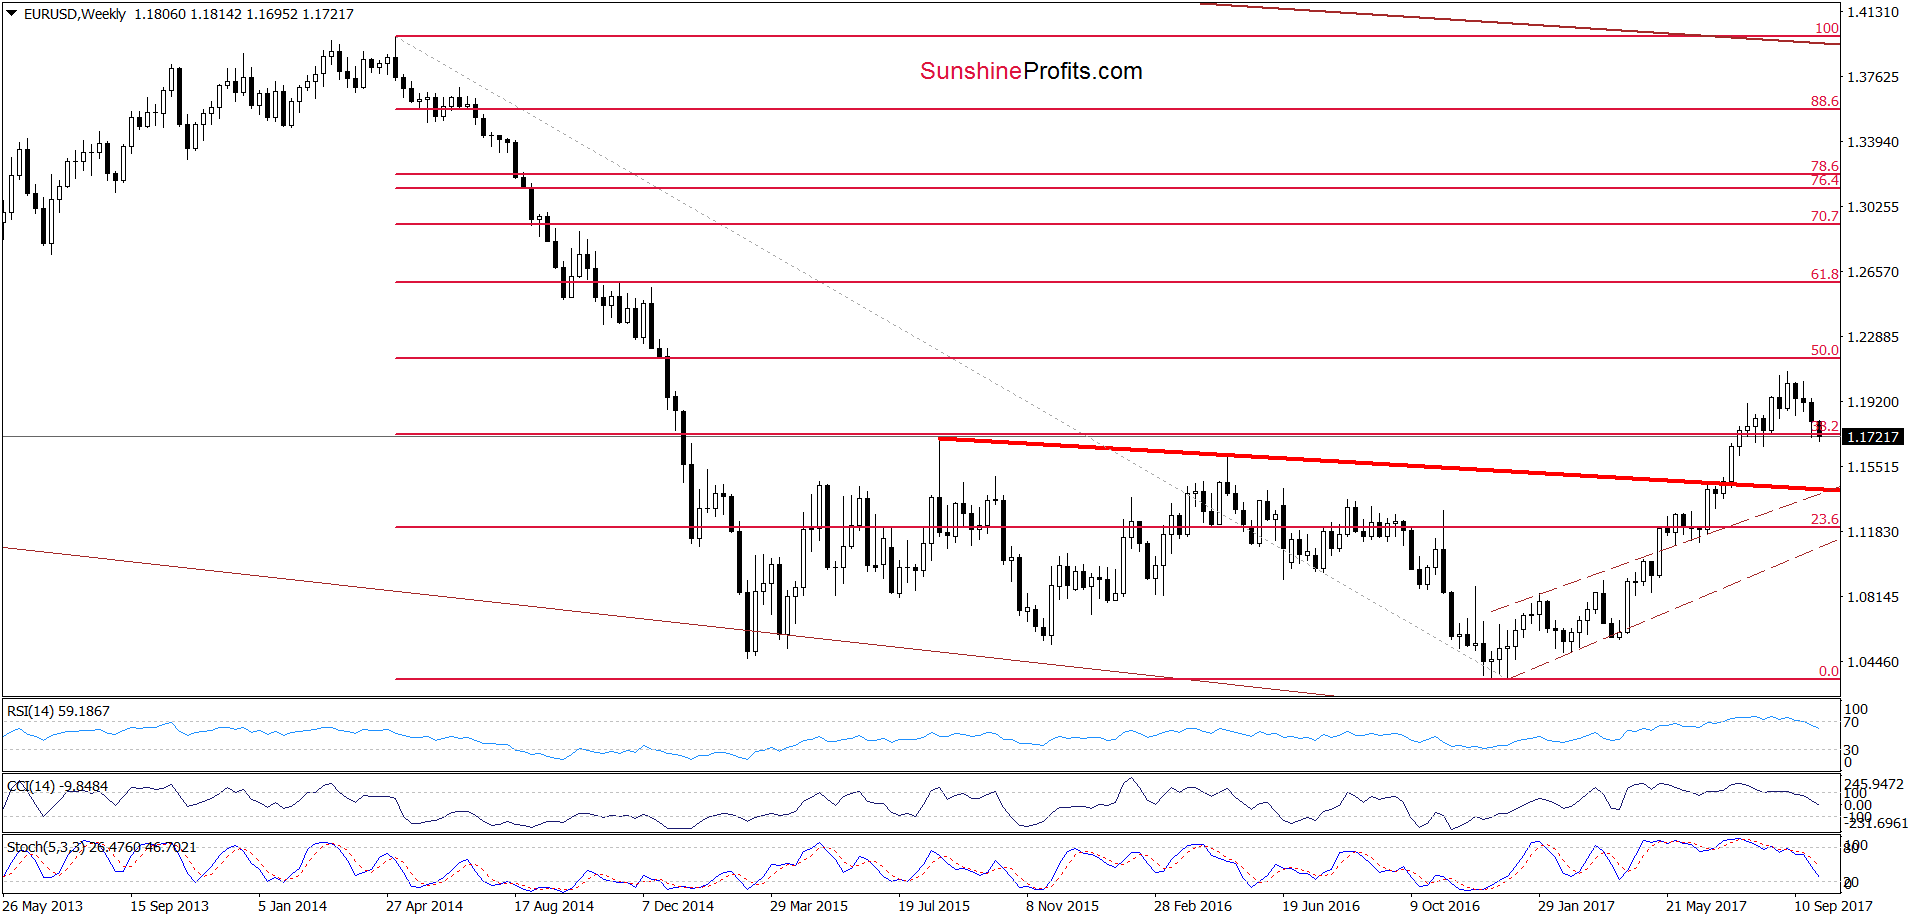
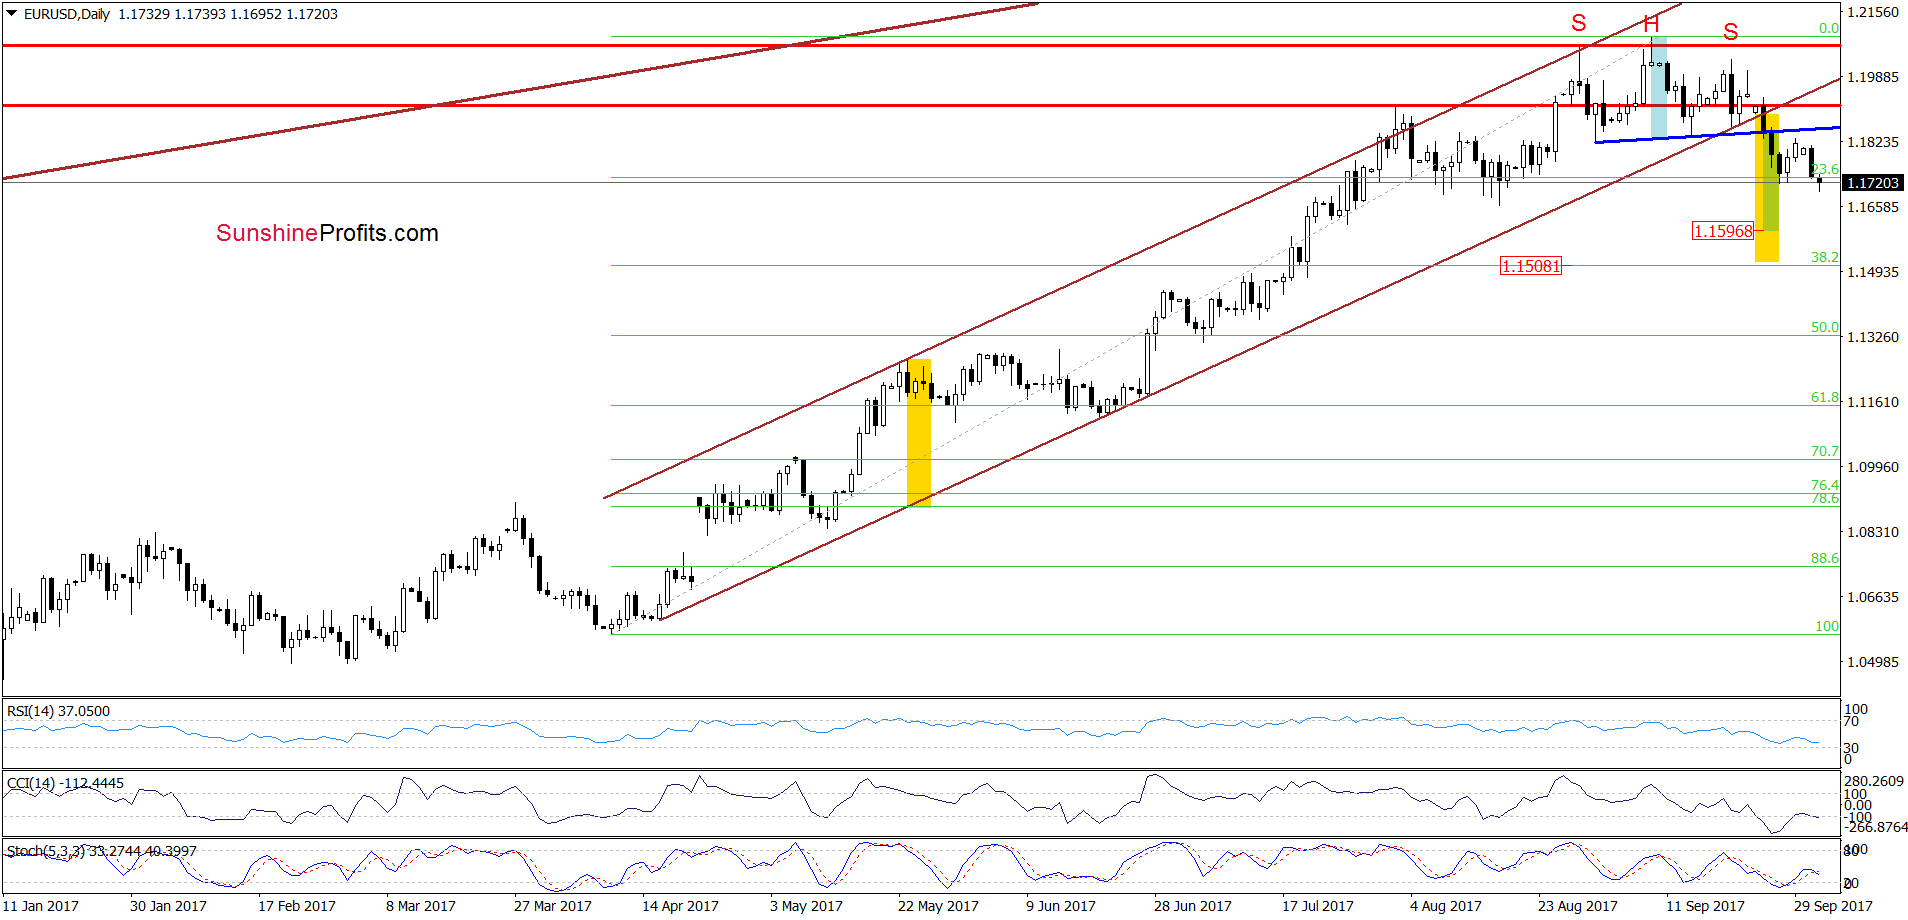
Looking at the charts, we see that EUR/USD slipped slightly below the previously-broken 38.2% Fibonacci retracement (seen on the weekly chart) and the 23.6% retracement (based on the entire April-September upward move), which suggests that further deterioration is just around the corner.
If this is the case and the exchange rate extends losses, we’ll see a realization of the pro bearish scenario from our Forex Trading Alert posted on September 25 in the coming week:
(…) we clearly see a potential head and shoulders formation. Therefore, if EUR/USD declines under the neck line of the pattern (the blue support line based on the previous lows), we’ll see a downward move to around 1.1596, where the size of the move will correspond to the height of the formation.
However, when we take into account a drop under the lower border of the brown rising trend channel and the broader picture of EUR/USD, we think that currency bears push the exchange rate even lower – to around 1.1508, where the size of declines will be equal to the height of trend channel. Taking all the above into account, we believe that our (already profitable) short positions are justified from the risk/reward perspective.
Very short-term outlook: bearish
Short-term outlook: bearish
MT outlook: mixed
LT outlook: mixed
Trading position (short-term; our opinion): Short profitable positions (with a stop-loss order at 1.2250 and the initial downside target at 1.1466) are justified from the risk/reward perspective. We will keep you informed should anything change, or should we see a confirmation/invalidation of the above.
GBP/USD
Quoting our Forex Trading Alert posted on September 25:
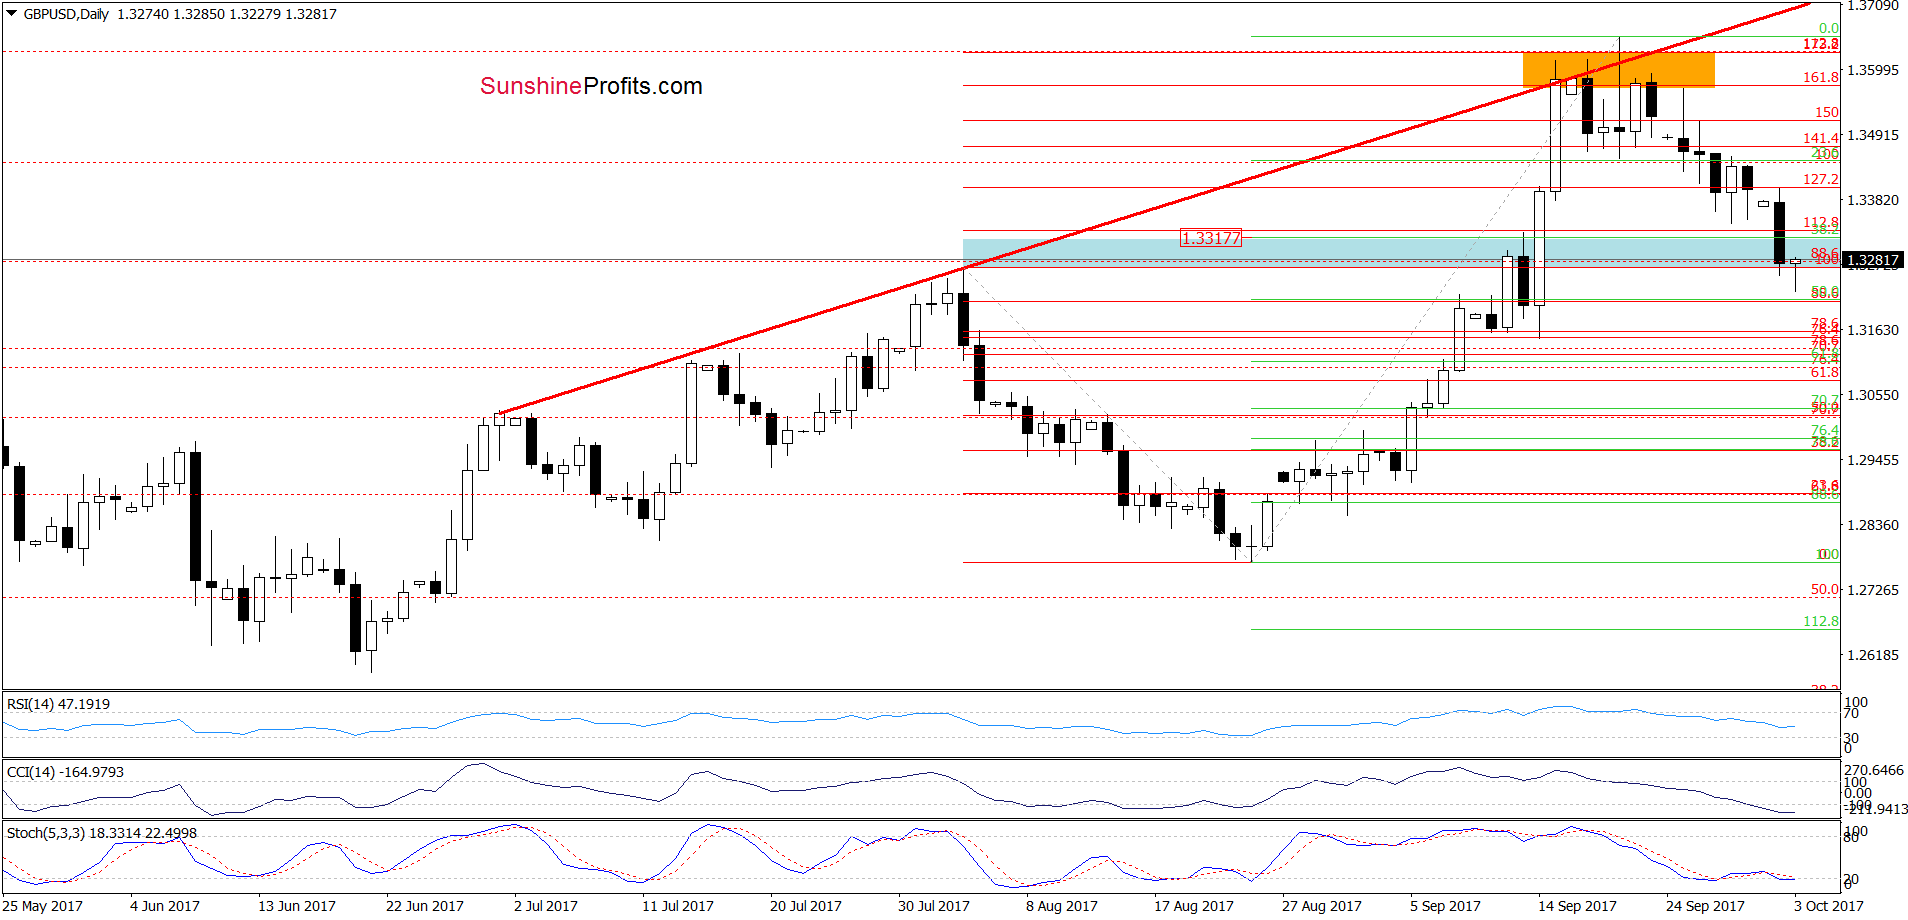
(…) How low could the pair go? In our opinion, if the exchange rate moves lower from current levels, we’ll see a drop to around 1.3266-1.3291, where the 38.2% Fibonacci retracement based on the August-September upward move and the August high are.
From today’s point of view, we see that the situation developed in line with the above scenario and GBP/USD dropped to our first downside target, making our short positions more profitable.
What’s next for the exchange rate? Although the pair slipped to the blue support zone, we should keep in mind that the pair closed yesterday’s session below the 38.2% Fibonacci retracement based on the August-September upward move, which suggests further deterioration – especially when we factor in the fact that the sell signals generated by the weekly and daily indicators remain in cards, supporting currency bears.
Taking the above into account, we think that if the pair extends losses from current levels, we’ll see a test of the mid-September low of 1.3149 and the 61.8% Fibonacci retracement based on the August-September upward move (around 1.3115) in the coming days.
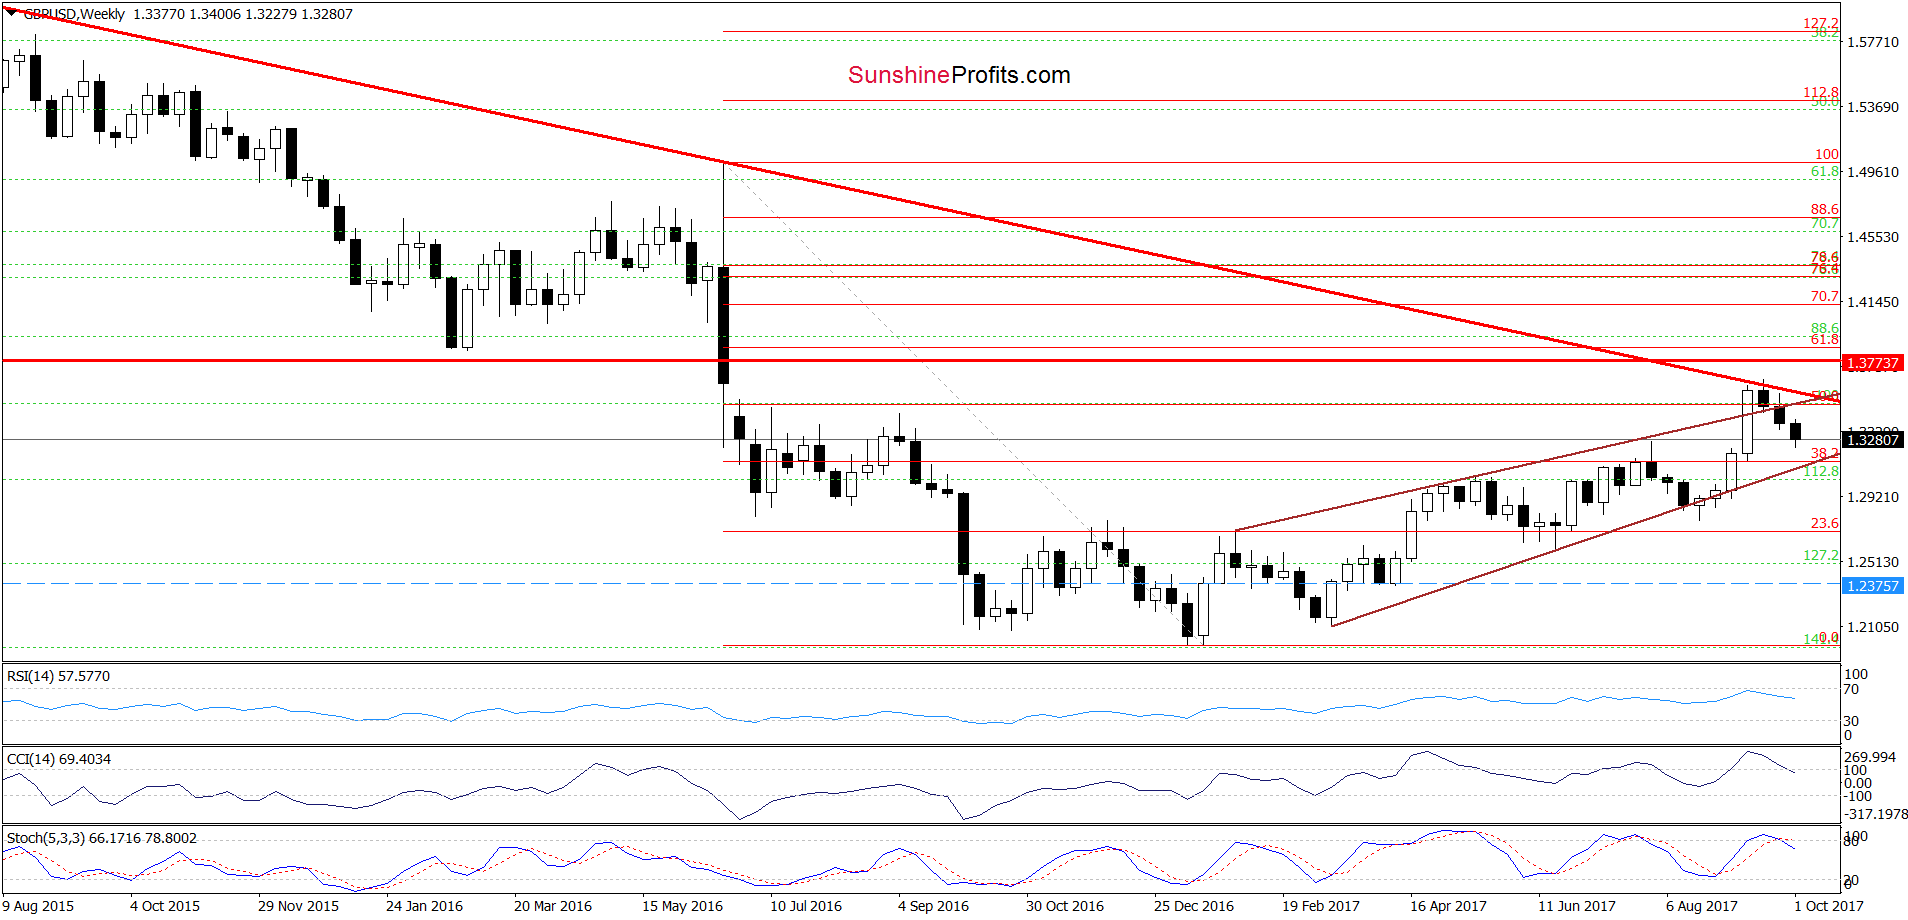
Nevertheless, looking at the weekly chart and considering an invalidation of the breakout above the upper border of the brown rising wedge, it seems that we could see GBP/USD even lower - around 1.3100, where the lower border of the above-mentioned formation currently is.
Very short-term outlook: bearish
Short-term outlook: mixed with bearish bias
MT outlook: mixed with bearish bias
LT outlook: mixed
Trading position (short-term; our opinion): Short profitable positions (with a stop-loss order at 1.3773 and the initial downside target at 1.3317) are justified from the risk/reward perspective. We will keep you informed should anything change, or should we see a confirmation/invalidation of the above.
USD/JPY
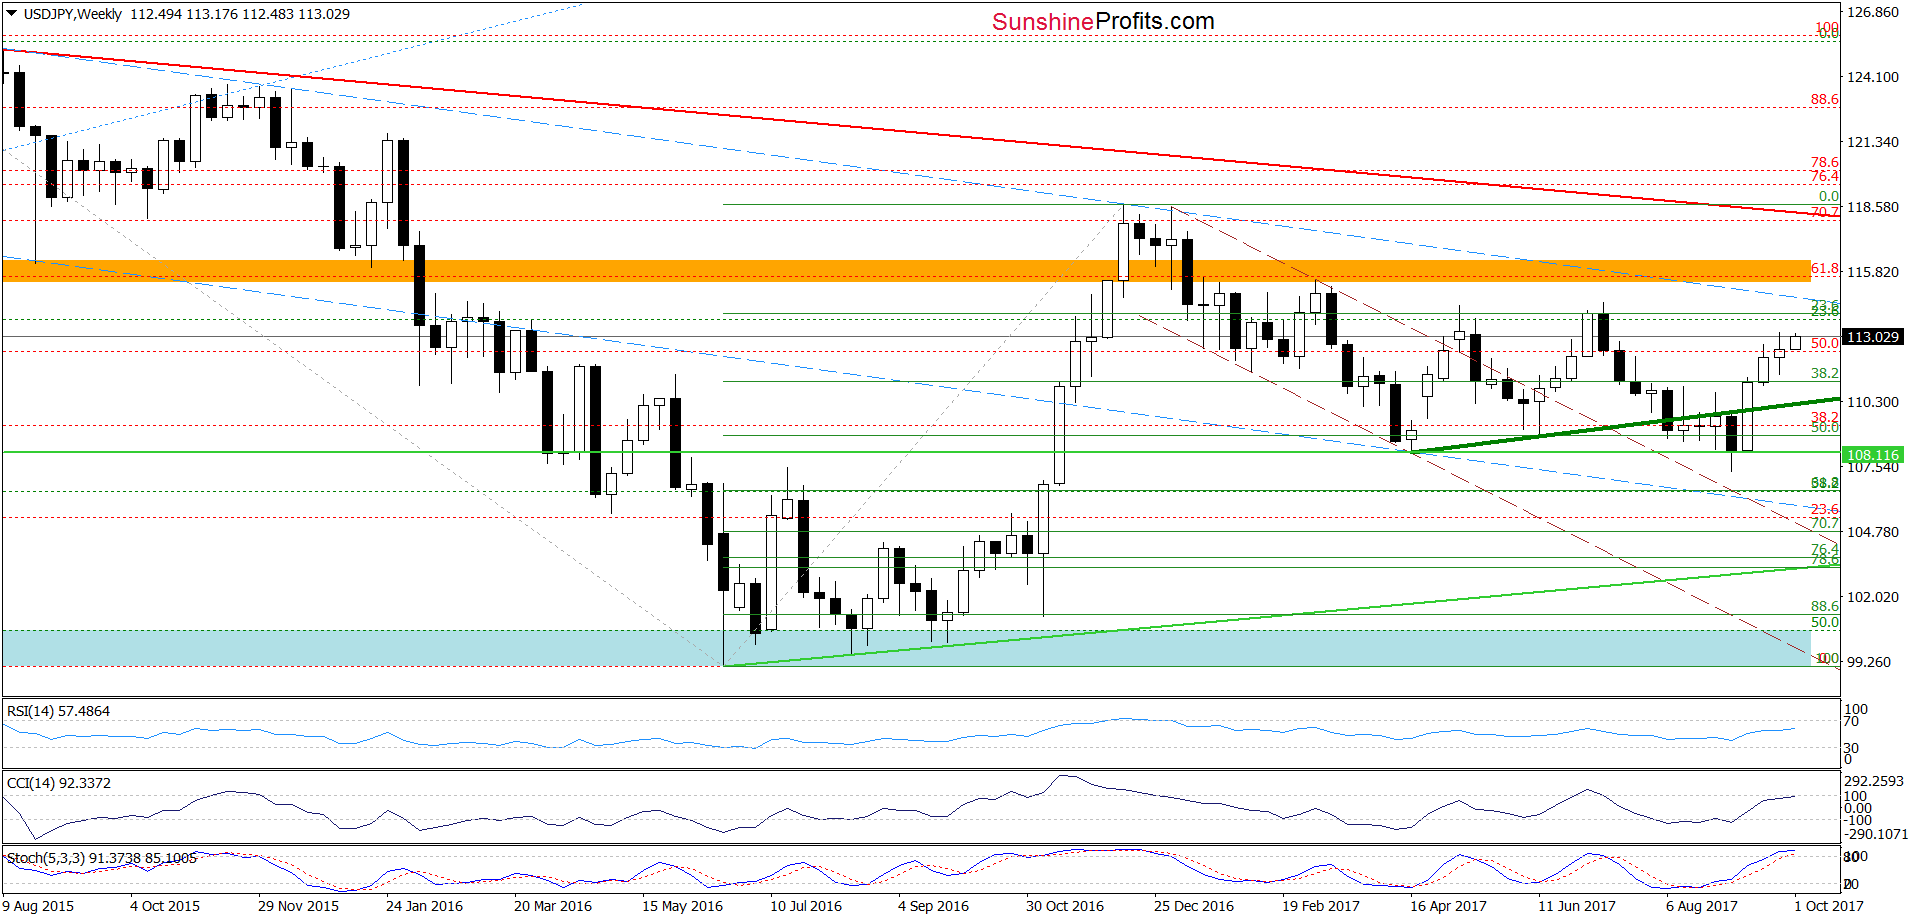
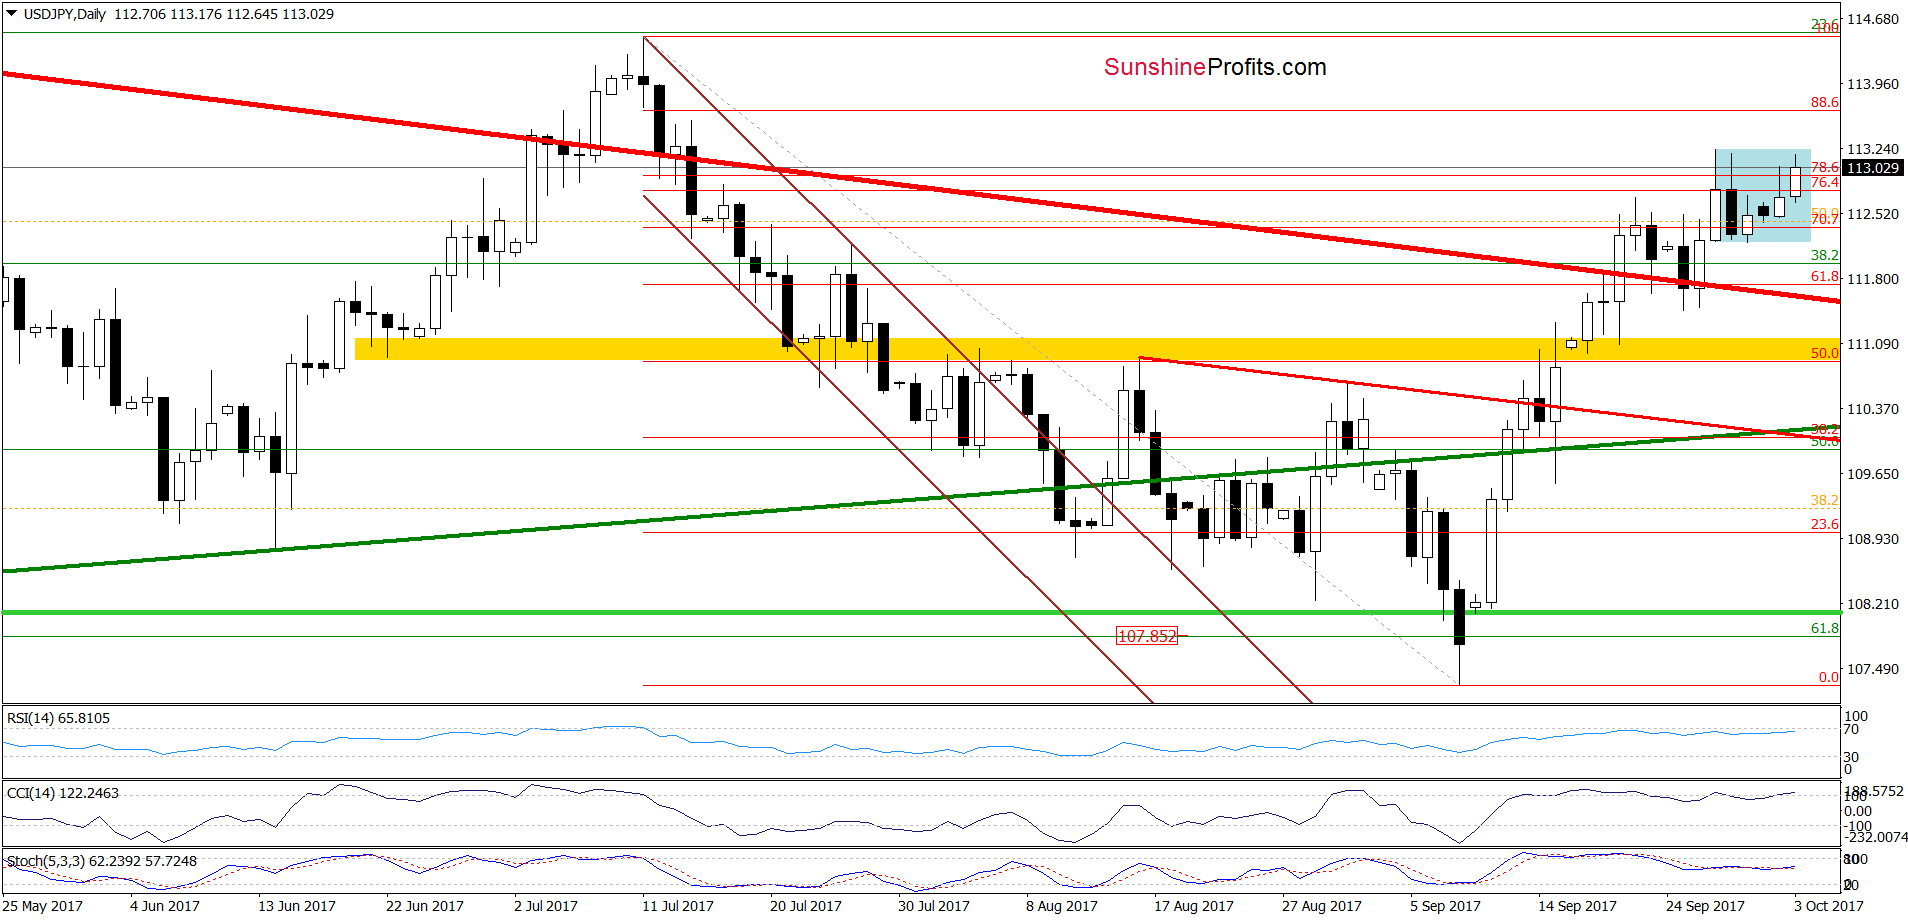
Looking at the daily chart, we see that USD/JPY bounced off the red declining resistance line and the 61.8% Fibonacci retracement, invalidating the earlier small breakdowns. This positive development triggered further improvement, which resulted in an increase to the resistance area created by the 76.4% and 78.6% Fibonacci retracements in the previous week.
Since then the exchange rate is consolidating slightly below these levels, but taking into account the fact that the CCI canceled the sell signal and the Stochastic Oscillator generated a buy signal, we think that we’ll see one more upswing and a test of the 88.6% Fibonacci retracement (or even the July highs) in the coming days.
Very short-term outlook: mixed with bullish bias
Short-term outlook: mixed
MT outlook: mixed
LT outlook: mixed
Trading position (short-term; our opinion): No positions are justified from the risk/reward perspective at the moment. We will keep you informed should anything change, or should we see a confirmation/invalidation of the above.
Thank you.
Nadia Simmons
Forex & Oil Trading Strategist
Przemyslaw Radomski, CFA
Founder, Editor-in-chief, Gold & Silver Fund Manager
Gold & Silver Trading Alerts
Forex Trading Alerts
Oil Investment Updates
Oil Trading Alerts

