

Yesterday, EUR/USD moved lower once again after comments made by Fed Chair Janet Yellen who said that “the Federal Reserve needs to continue gradual rate hikes”. Thanks to these circumstances the exchange rate broke below very important support line, opening the way to lower levels. How low could the pair go in the coming days?
In our opinion the following forex trading positions are justified - summary:
- EUR/USD: short (a stop-loss order at 1.2250; the initial downside target at 1.1466)
- GBP/USD: short (a stop-loss order at 1.3773; the initial downside target at 1.3317)
- USD/JPY: none
- USD/CAD: none
- USD/CHF: none
- AUD/USD: none
EUR/USD
Quoting our last Forex Trading Alert:
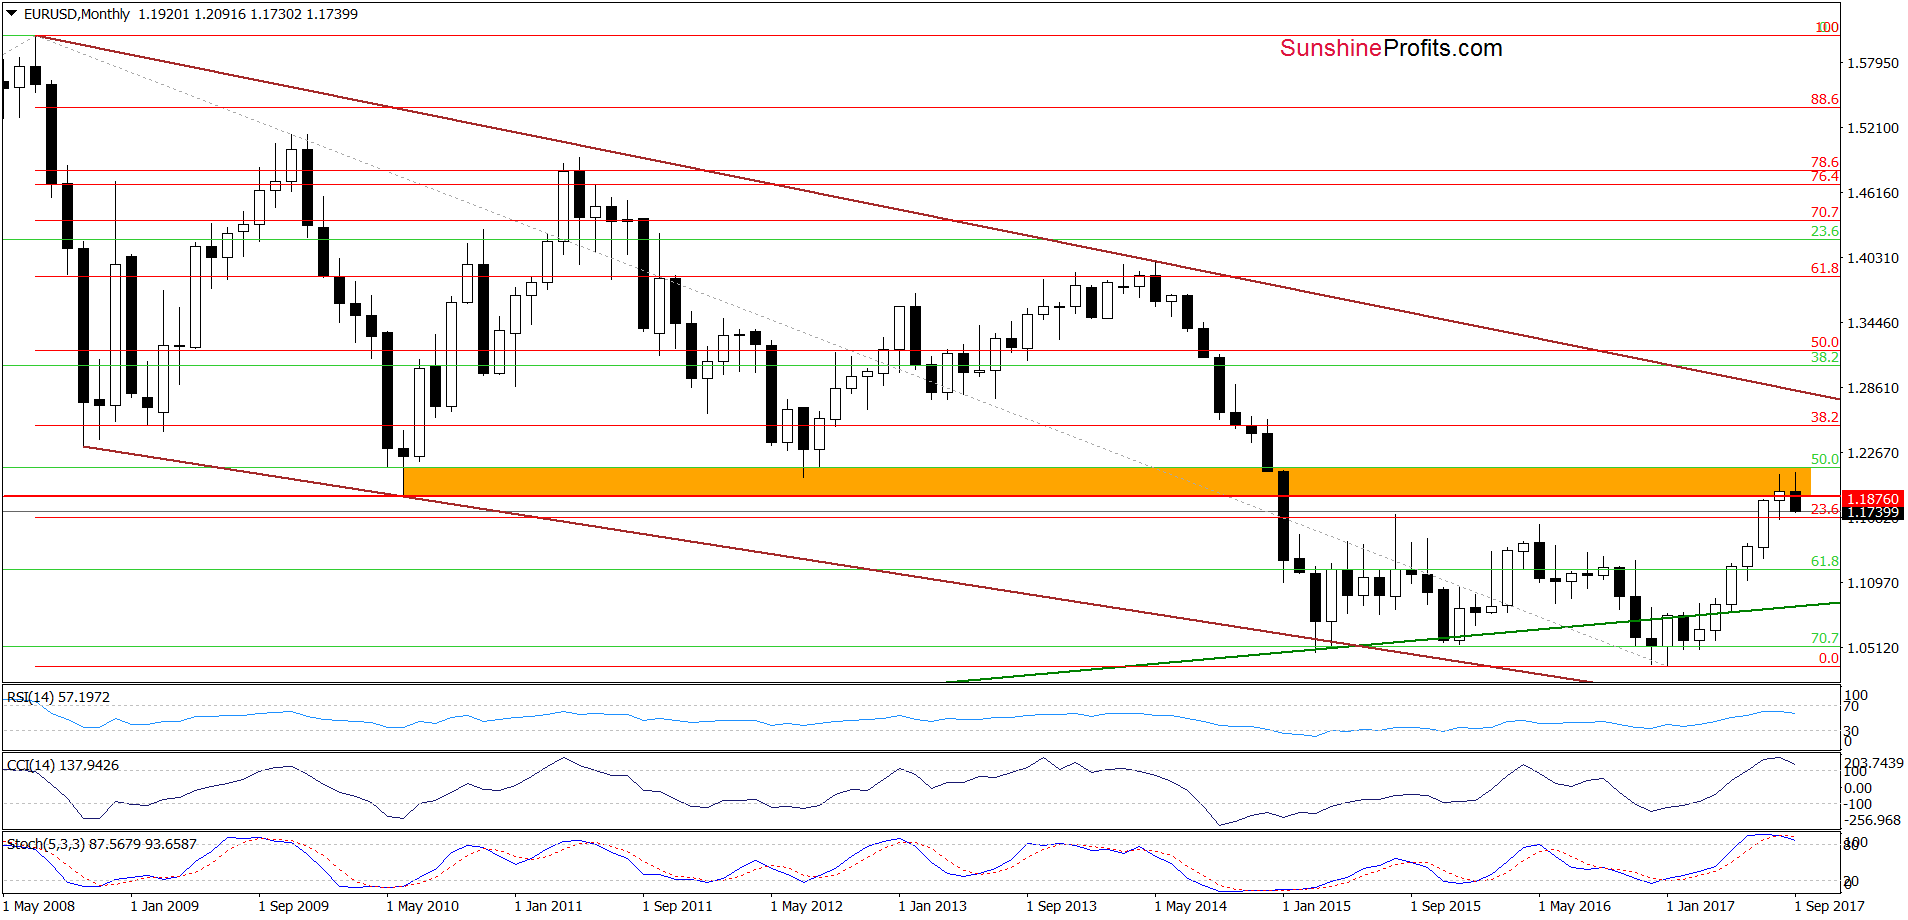
(…) currency bears pushed EUR/USD lower (as we had expected), which resulted in a decline below the lower border of the orange resistance zone. This is a negative development, which suggests further deterioration; however, this event will turn into bearish if we see a monthly closure below this resistance zone.
From today’s point of view we see that EUR/USD extended losses below the orange resistance zone, which together with the current situation in the medium term, increases the probability of further declines. Why? Let’s take a look at the weekly chart.
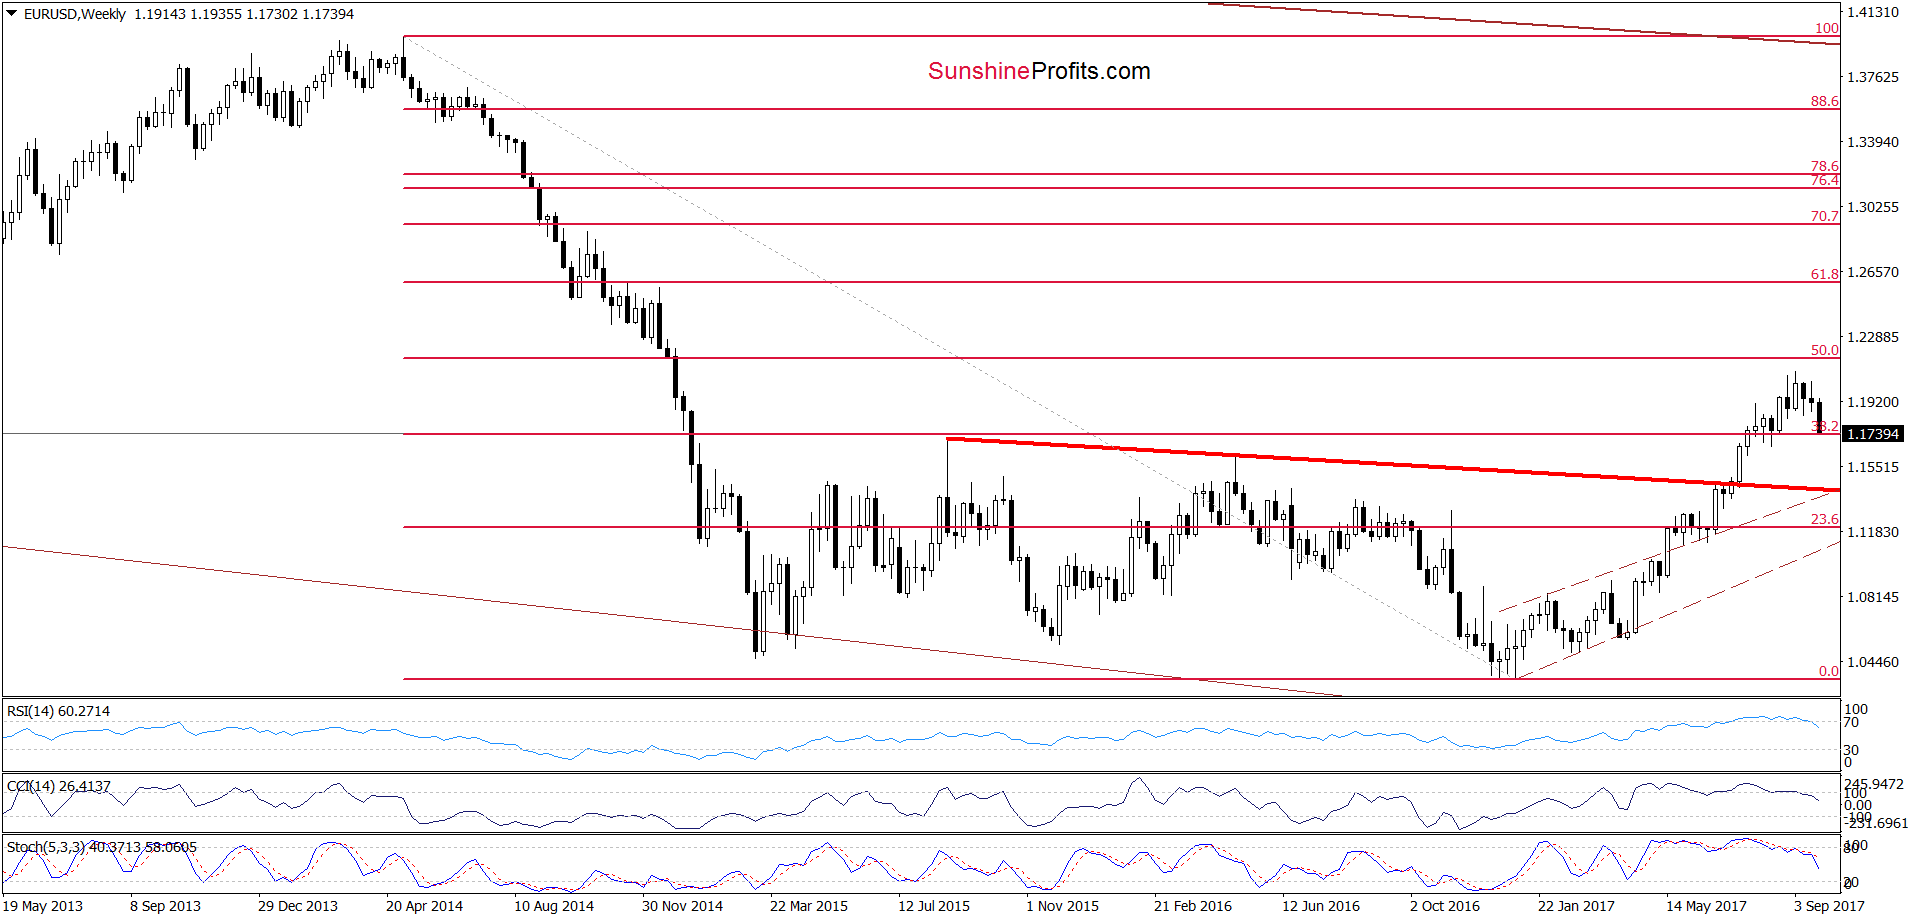
On the above chart, we see that the sell signals generated by the medium-term indicators remain in cards, supporting currency bears and lower values of the exchange rate. Additionally, EUR/USD slipped to the previously-broken 38.2% Fibonacci retracement, which means that if the pair drops below this support level, currency bears will receive another important reason to act in the following days.
What’s interesting, this pro-bearish scenario is currency reinforced by the short-term picture below.
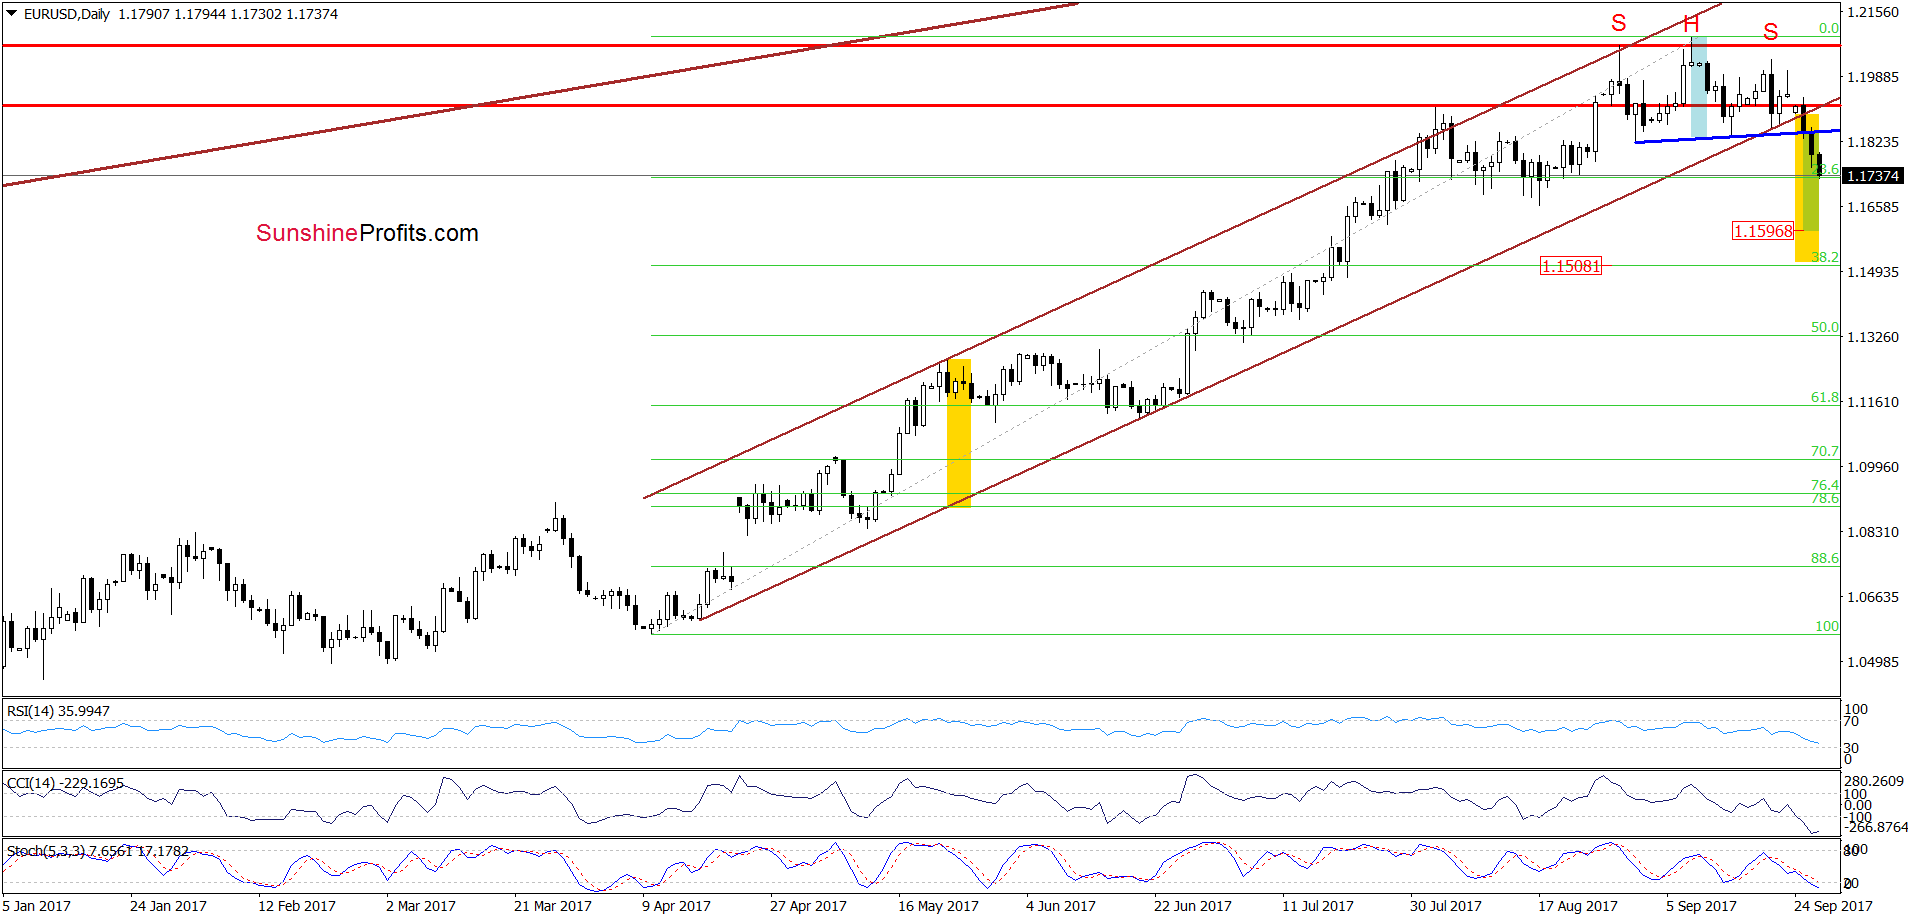
Looking at the daily chart, we see that yesterday’s breakdown under the blue support line based on the previous lows (the neck line of the head and shoulders formation) triggered further declines earlier today, which means that what we wrote on Monday remains up-to-date also today:
(…) EUR/USD declined and slipped under the lower border of the brown rising trend channel (….) this is a bearish development, which suggests further deterioration – especially if the exchange rate closes today’s session under this important line.
What could happen if we see such price action? Looking at the above chart, we clearly see a potential head and shoulders formation. Therefore, if EUR/USD declines under the neck line of the pattern (the blue support line based on the previous lows), we’ll see a downward move to around 1.1596, where the size of the move will correspond to the height of the formation.
However, when we take into account a drop under the lower border of the brown rising trend channel and the broader picture of EUR/USD, we think that currency bears push the exchange rate even lower – to around 1.1508, where the size of declines will be equal to the height of trend channel. Taking all the above into account, we believe that our (already profitable) short positions are justified from the risk/reward perspective.
Very short-term outlook: bearish
Short-term outlook: bearish
MT outlook: mixed
LT outlook: mixed
Trading position (short-term; our opinion): Short positions (with a stop-loss order at 1.2250 and the initial downside target at 1.1466) are justified from the risk/reward perspective. We will keep you informed should anything change, or should we see a confirmation/invalidation of the above.
GBP/USD
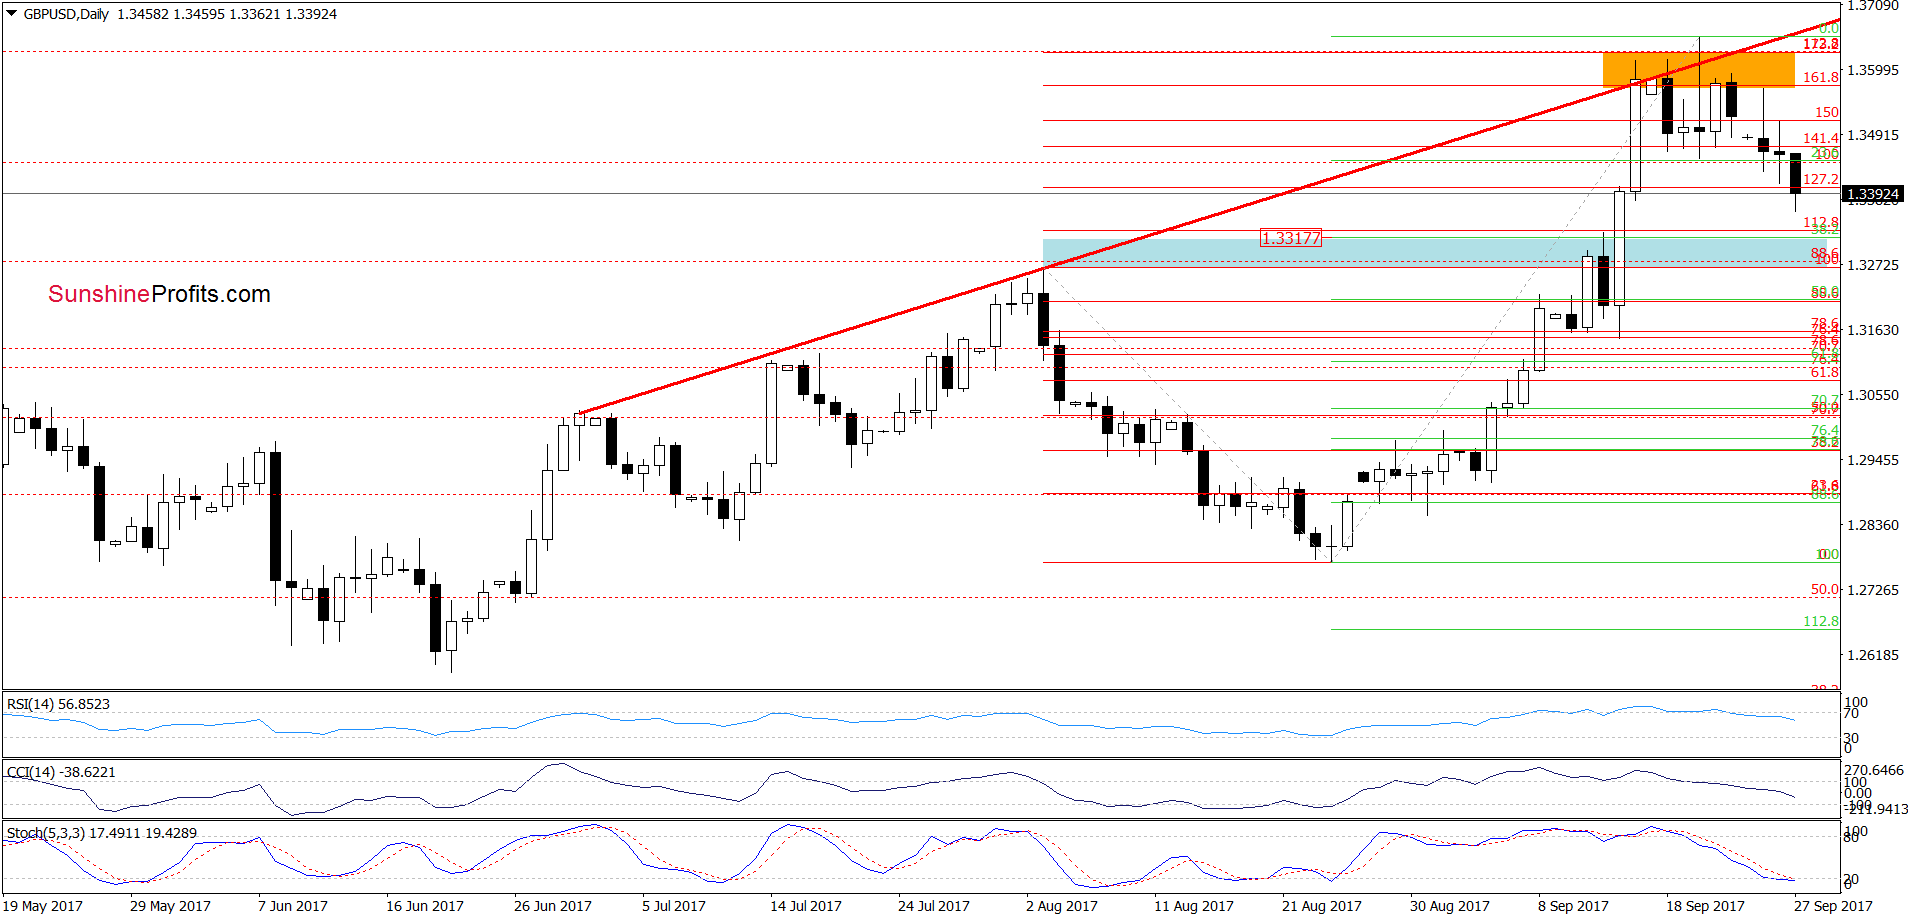
On Monday, we wrote the following:
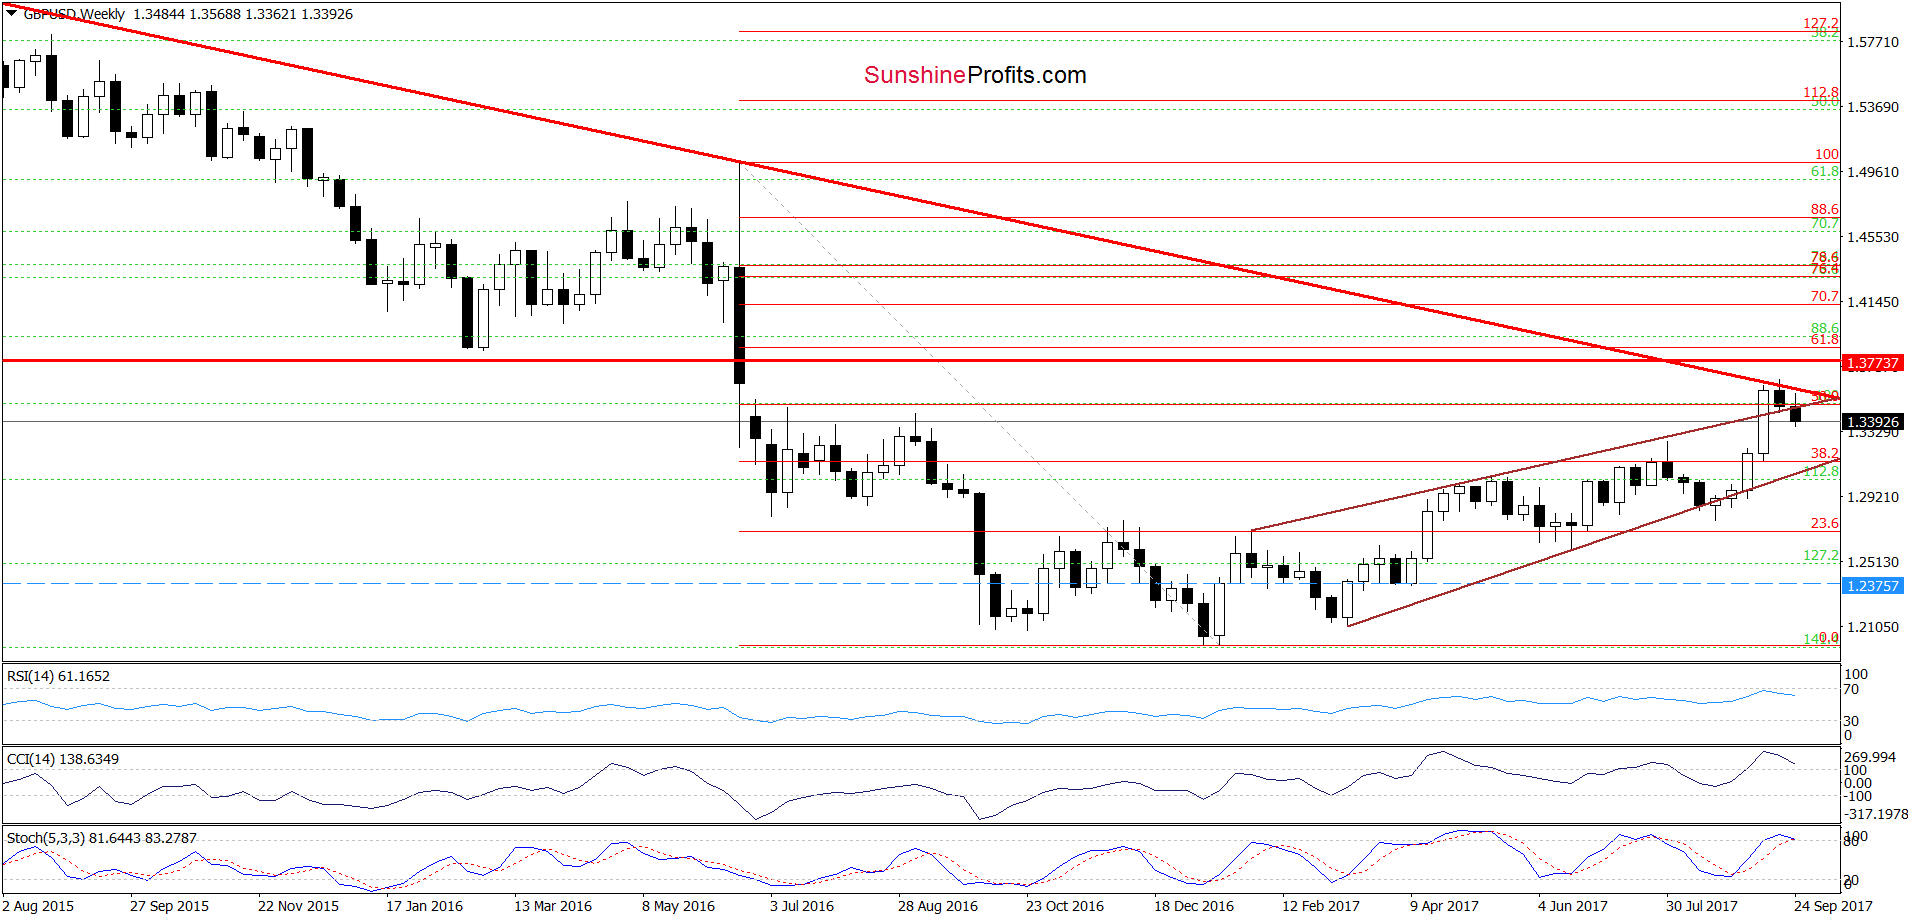
(…) although GBP/USD moved a bit higher earlier today, the orange resistance zone (created by the very long-term red declining resistance line based on the July 2014 and June 2016 peaks (marked on the weekly chart), the red increasing resistance line based on the previous highs (seen on the daily chart) and the area between the 161.8% and 173.2% Fibonacci extensions) stopped currency bulls, triggering a sharp pullback. Thanks to this drop GBP/USD approached the last week’s lows, which together with the sell signals generated by the daily indicators suggest lower values of the exchange rate in the coming week.
From today’s point of view, we see that the situation developed in tune with our last assumptions and GBP/USD extended losses. Thanks to this week’s drop the exchange rate slipped under the upper border of the brown rising trend channel (marked on the weekly chart), invalidating the earlier breakout. Taking this is a bearish development into account and combining it with the current position of the weekly indicators (they are very close to generating sell signals), we believe that lower values of GBP/USD are ahead of us.
How low could the pair go? In our opinion, if the exchange rate moves lower from current levels, we’ll see a drop to around 1.3266-1.3291, where the 38.2% Fibonacci retracement based on the August-September upward move and the August high are.
Very short-term outlook: bearish
Short-term outlook: mixed with bearish bias
MT outlook: mixed with bearish bias
LT outlook: mixed
Trading position (short-term; our opinion): Short positions (with a stop-loss order at 1.3773 and the initial downside target at 1.3317) are justified from the risk/reward perspective. We will keep you informed should anything change, or should we see a confirmation/invalidation of the above.
USD/CHF
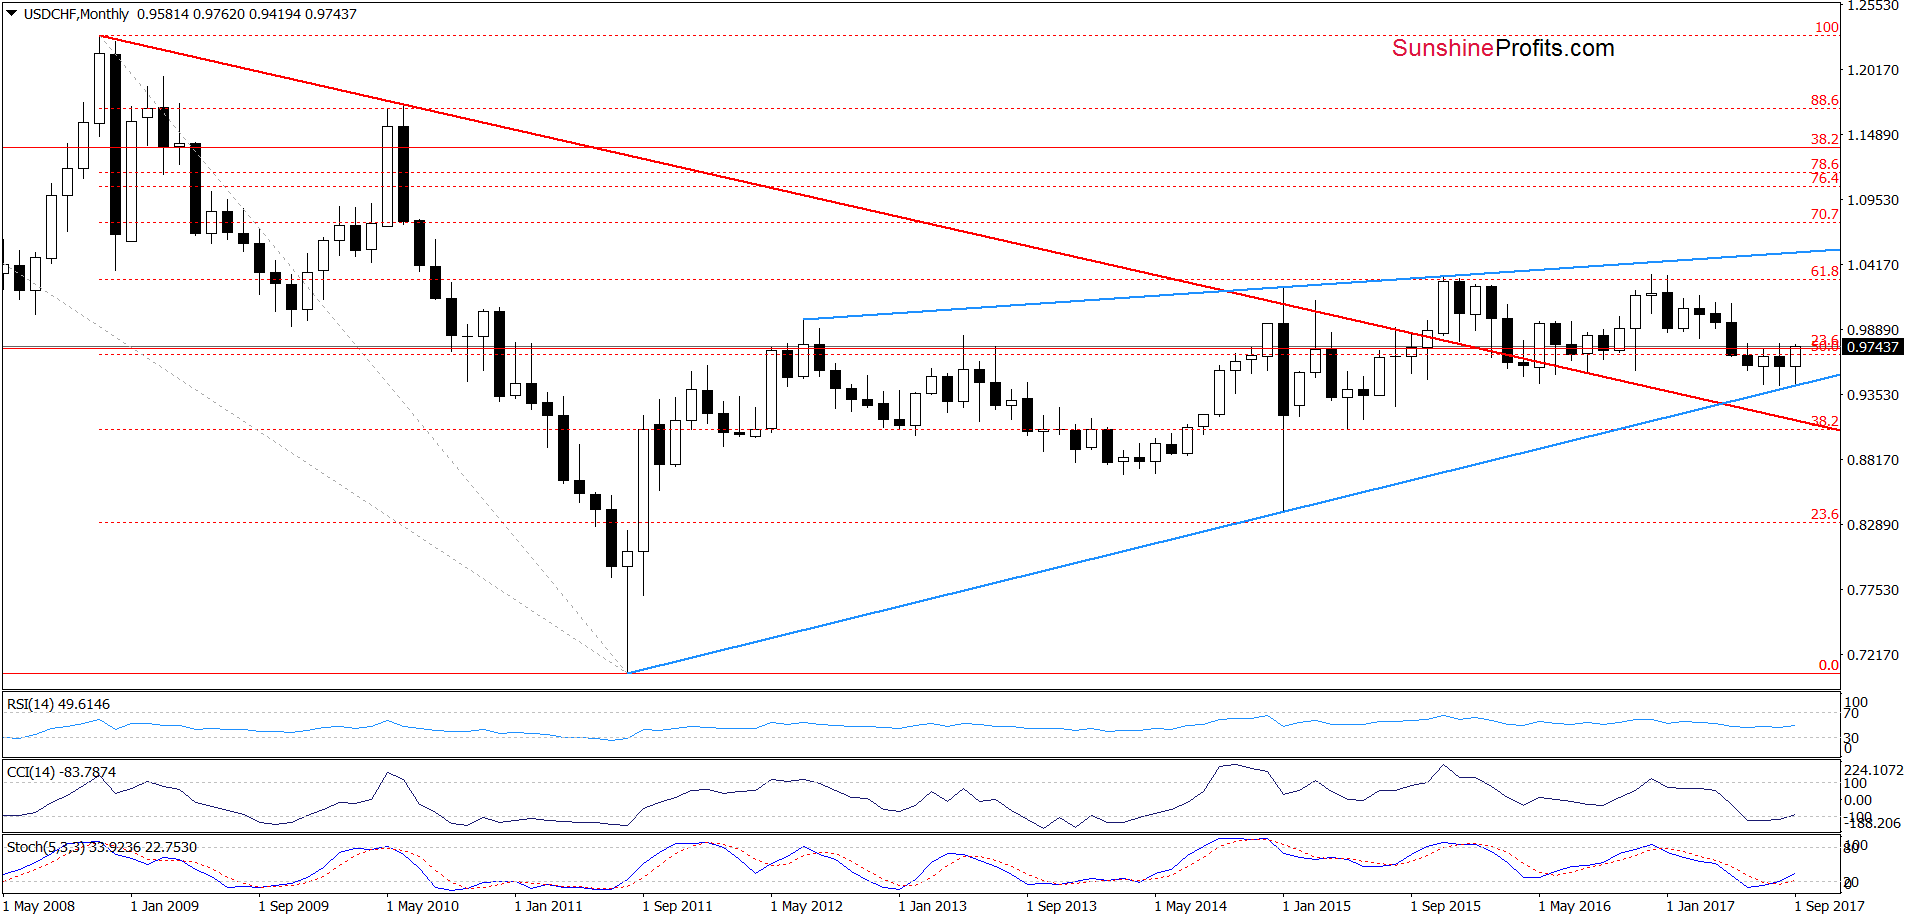
Looking at the monthly chart, we see that the long-term blue rising support line triggered a rebound in September. What impact did this increase have on the daily chart? Let’s examine the chart below to find out.
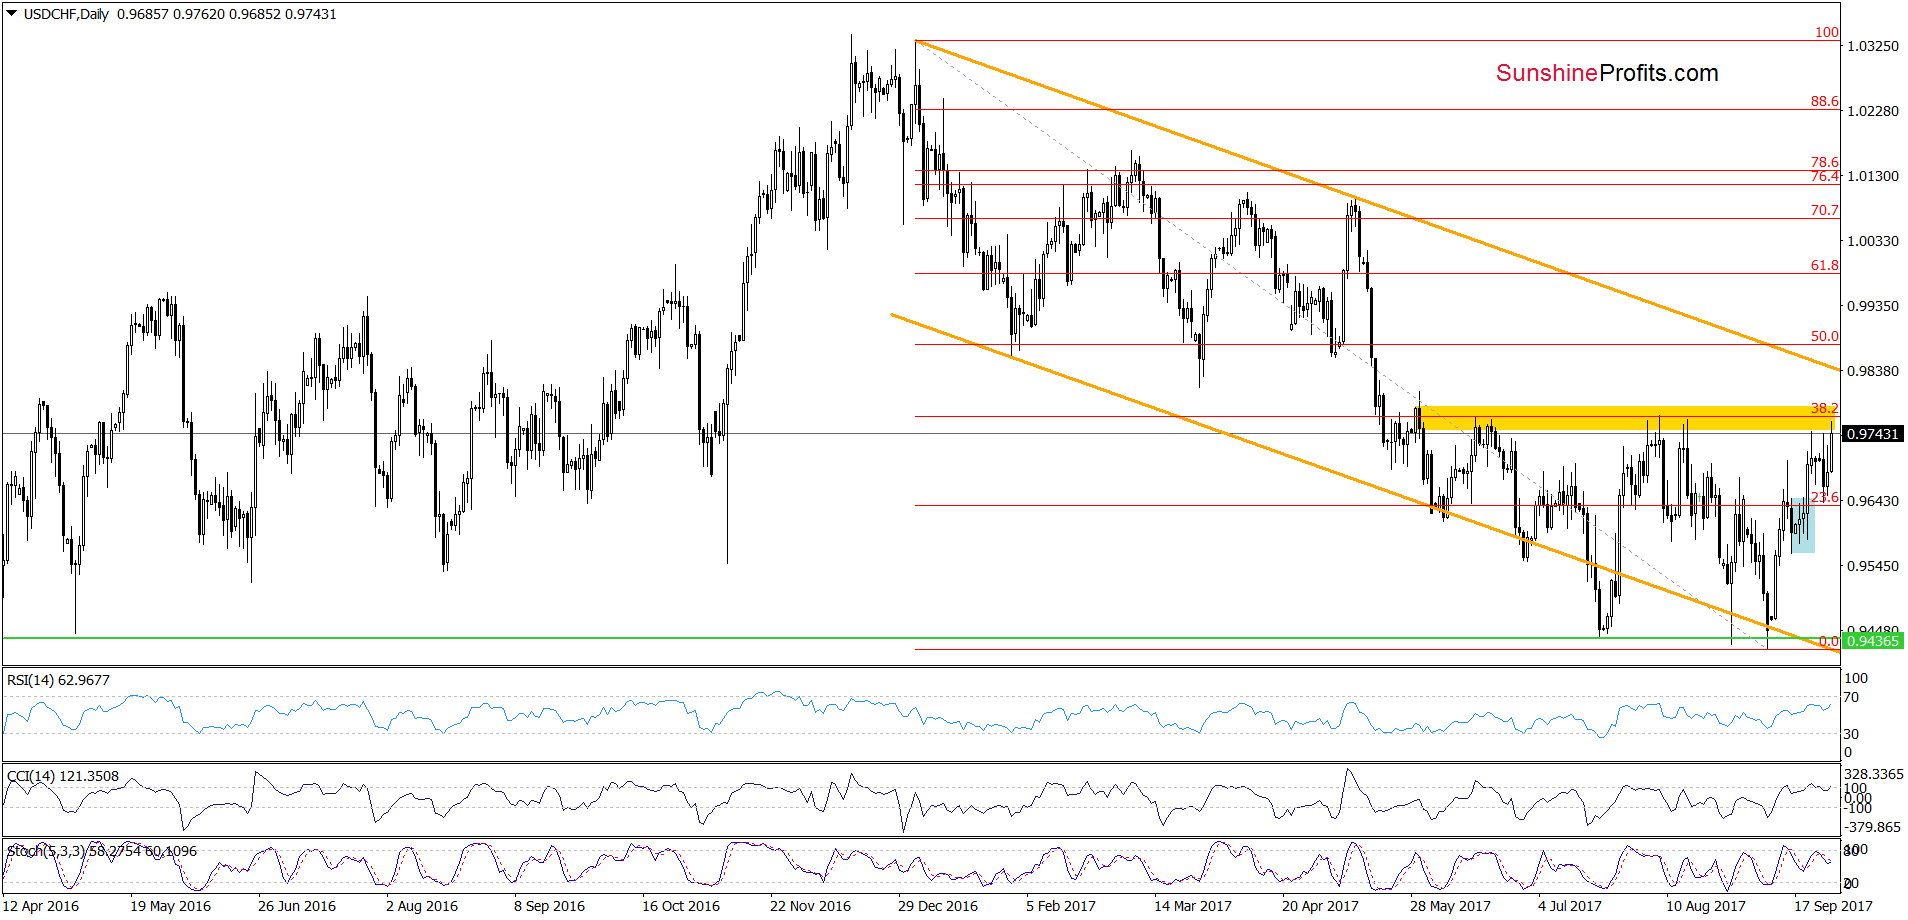
On the above chart, we see that currency bulls pushed USD/CHF higher, which resulted in a climb to the yellow resistance zone. In the previous weeks, this area was strong enough to stop currency bulls and trigger a pullback. Additionally, at the moment of writing these words, it is also reinforced by the 38.2% Fibonacci retracement based on the entire 2017 downward move, which suggests that we could see another reversal in the coming days. Nevertheless, taking into account the fact that the CCI invalidated the earlier sell signal (the Stochastic Oscillator is very close to doing the same), it seems that currency bulls will try to break above the yellow zone. If they succeed, we’ll likely see a test of the upper border of the orange declining trend channel in the following days.
Very short-term outlook: mixed with bullish bias
Short-term outlook: mixed
MT outlook: mixed
LT outlook: mixed
Trading position (short-term; our opinion): No positions are justified from the risk/reward perspective at the moment. We will keep you informed should anything change, or should we see a confirmation/invalidation of the above.
Thank you.
Nadia Simmons
Forex & Oil Trading Strategist
Przemyslaw Radomski, CFA
Founder, Editor-in-chief, Gold & Silver Fund Manager
Gold & Silver Trading Alerts
Forex Trading Alerts
Oil Investment Updates
Oil Trading Alerts

