

Although the sellers triggered one more move to the downside in recent days, their opponents kept cool and using important support they managed to initiate another move towards the north. Will today's correction thwart their pro-growth plans?
- EUR/USD: none
- GBP/USD: long (a stop-loss order at 1.2642; the upside target at 1.3050)
- USD/JPY: short (a stop-loss order at 114.68; the initial downside target at 112.34)
- USD/CAD:none
- USD/CHF: short (a stop loss order at 1.0192; the initial downside target at 0.9881)
- AUD/USD:none
EUR/USD
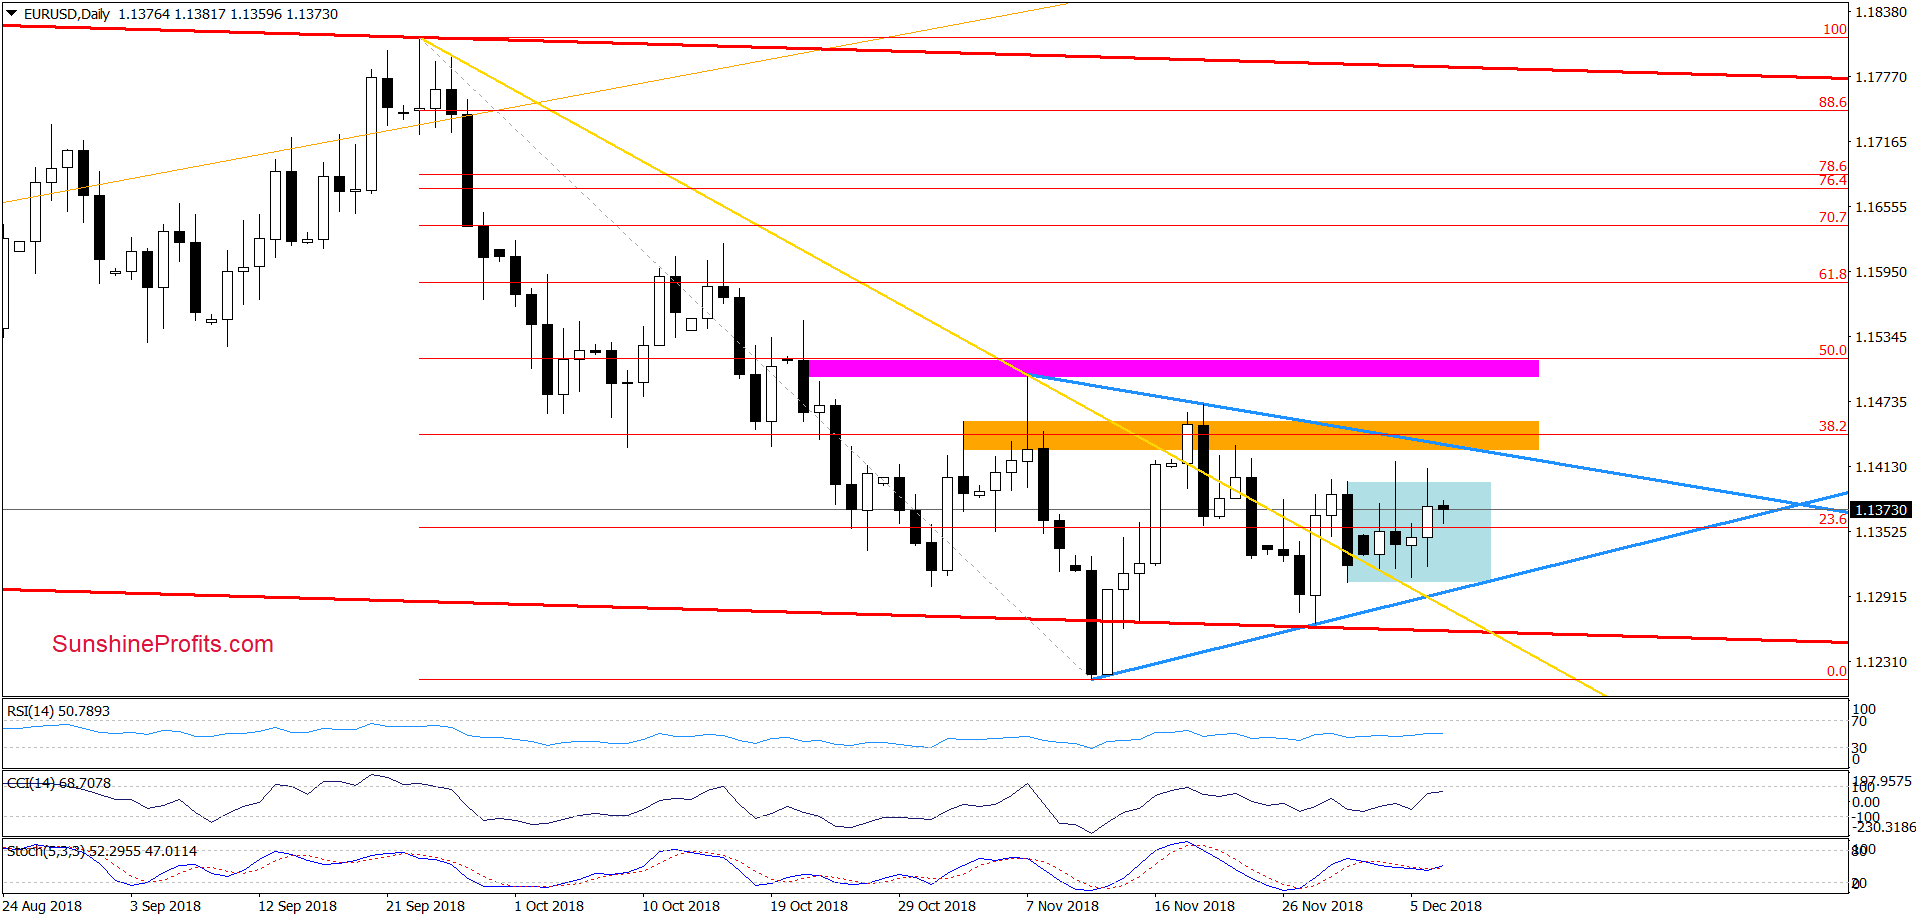
Up and down and turn around. In these several word we can summarize the recent price action in EUR/USD. As you see on the chart, the exchange rate increased above the upper line of the blue consolidation during yesterday’s session, but as it turned out this improvement was very temporary, and the pair pulled back in the following hours.
Thanks to this price action, currency bears invalidated the earlier tiny breakout once again, which increases the likelihood that we’ll see another pullback from current levels and a test of the lower border of the blue consolidation and the blue triangle.
Will anything change if the situation develops in tune with the above assumption? Not really. Why? We believe that the best answer to this question will be the quote from our Tuesday’ alert:
(…) we continue to believe that as long as there is no breakout above the upper border of the triangle (or a breakdown under the lower line) another bigger move is not likely to be seen and short-lived moves in both directions should not surprise us in the coming days.
Nevertheless, if currency bulls show strength and manage to take the exchange rate above the nearest resistances, we’ll consider opening long positions. We will keep you informed should anything change, or should we see a confirmation/invalidation of the above.
Trading position (short-term; our opinion): No positions are justified from the risk/reward perspective.
GBP/USD
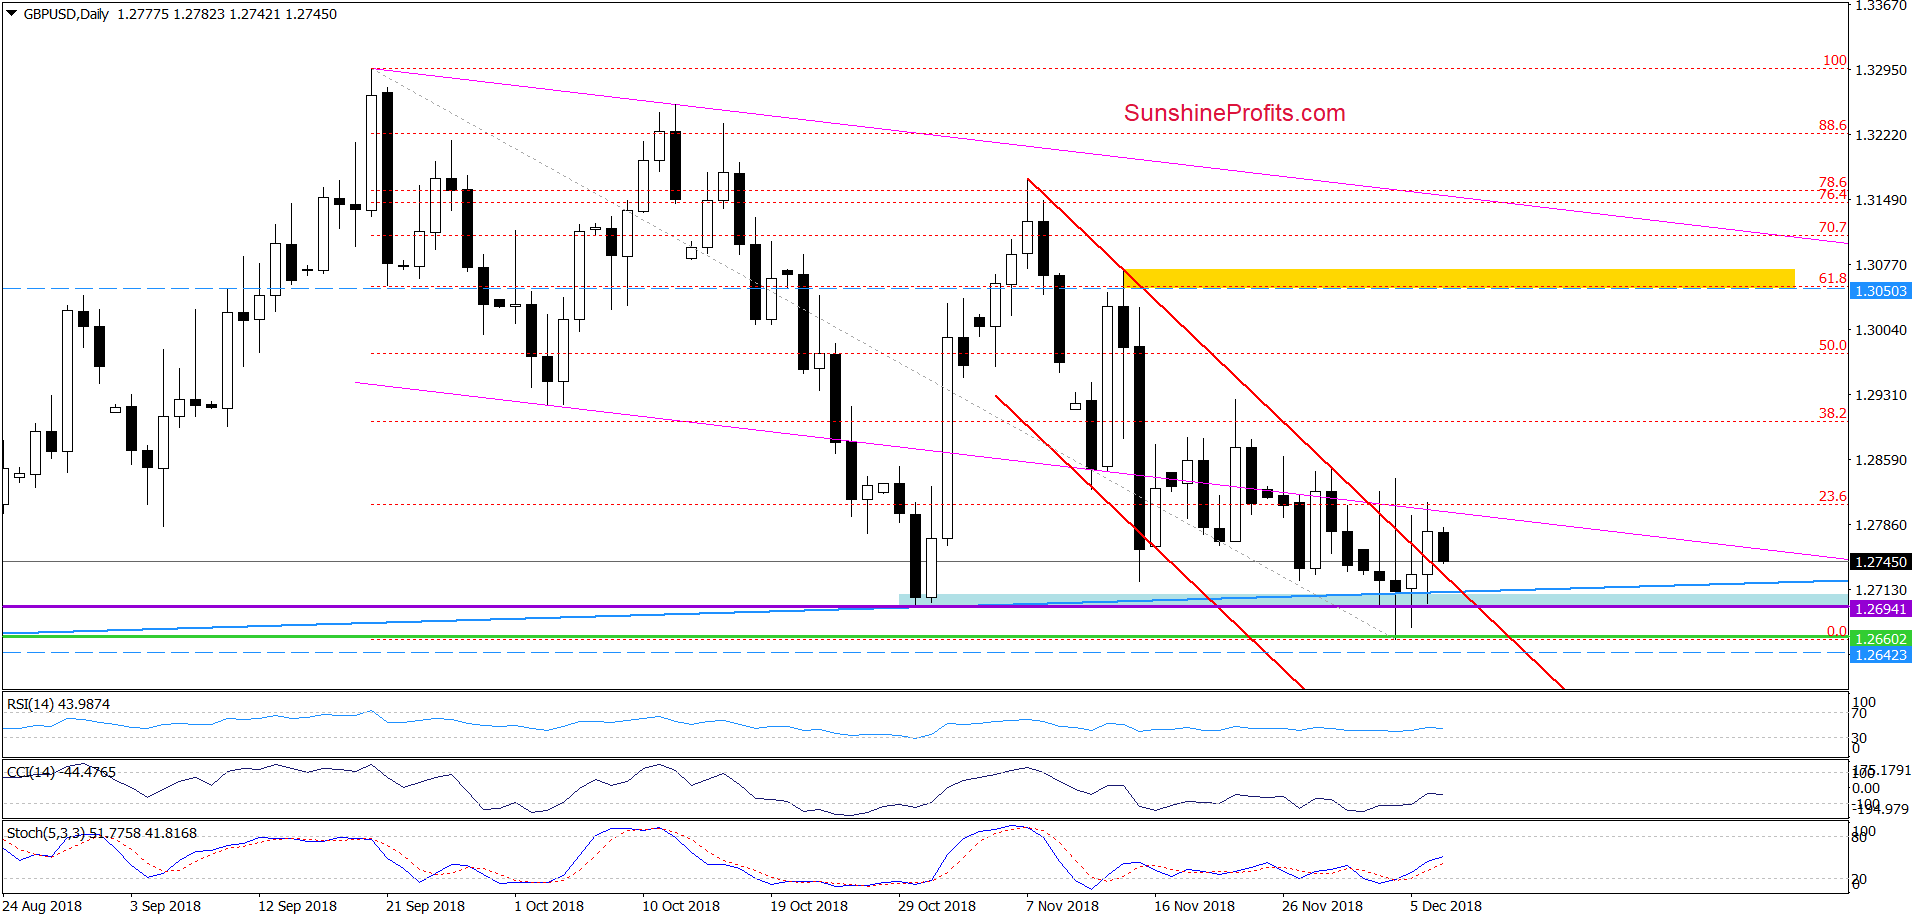
On the daily chart, we see that although the sellers invalidated the earlier small breakout above the upper border of the red declining trend channel in recent days, their opponents didn’t give up and triggered one more rebound during yesterday’s session.
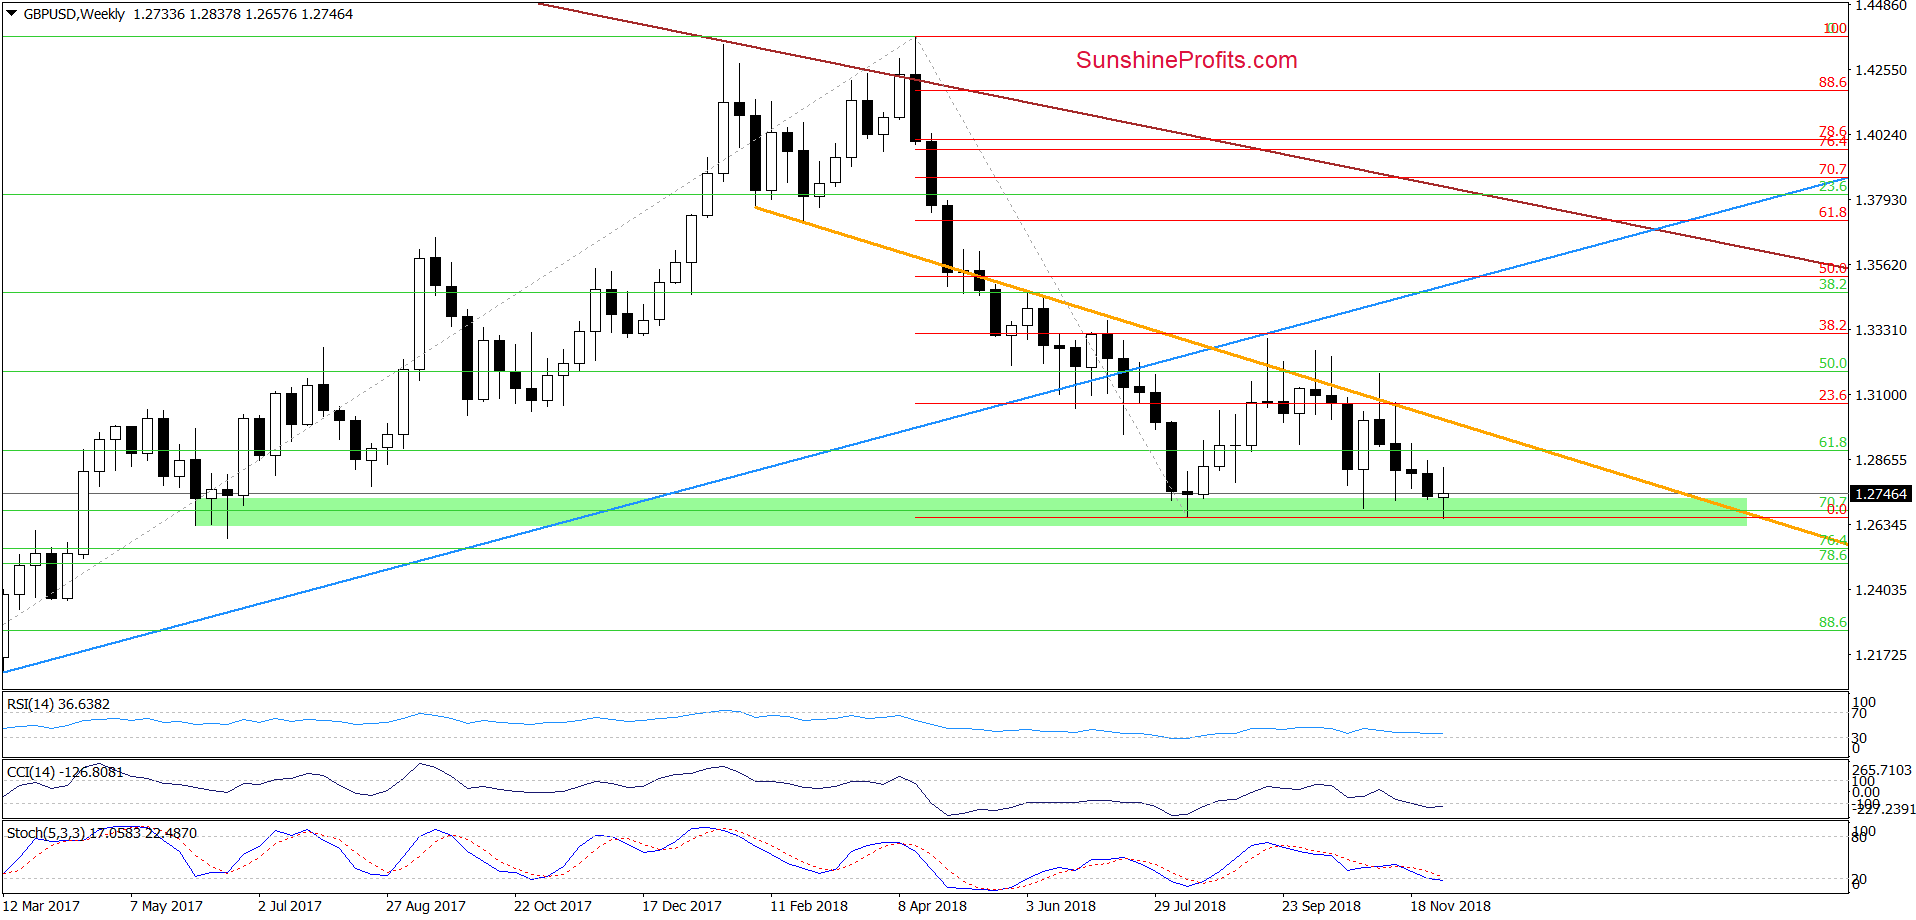
Thanks to their determination GBP/USD came back above the red formation and closed yesterday’s session above it, which in combination with the buy signals generated by the daily indicators and the proximity to the major support zone (marked with green on the weekly chart below) suggests further improvement in the coming week.
How high could the pair go if we see such price action? We believe that the best answer to this question will be the quotes from our last commentary on this currency pair:
(…) if the exchange rate extended gains from current levels, the next upside target will be the November 22 peak of 1.2925 or even the yellow resistance zone marked on the daily chart. Why there? Because in this area, the size of the upward move will correspond to the height of the red declining trend channel.
Trading position (short-term; our opinion): Long positions with a stop-loss order at 1.2642 and the upside target at 1.3050 are justified from the risk/reward perspective.
AUD/USD
On Wednesday, we wrote the following:
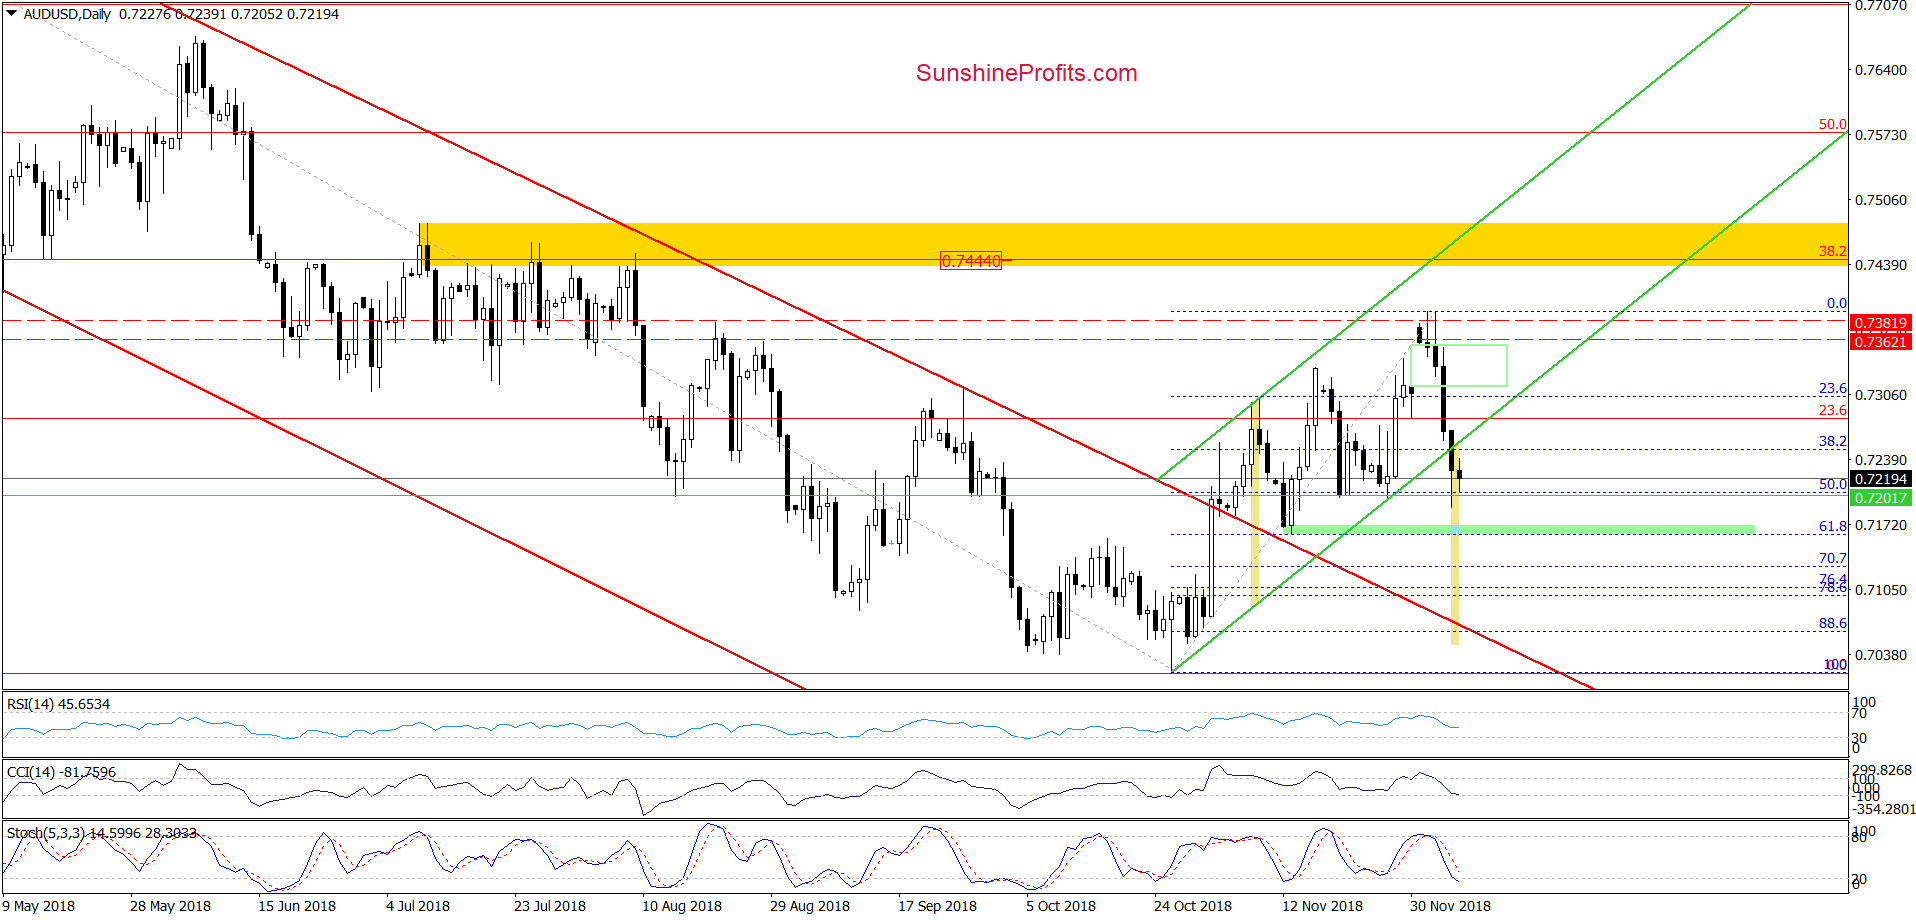
The first thing that catches the eye on the daily chart is invalidation of the earlier tiny breakouts above the red horizontal resistance lines based on late-August highs. This negative development encouraged the sellers to act, which resulted in a sharp downswing earlier today. On top of that, the CCI and the Stochastic Oscillator generated sell signals, suggesting that lower values of AUD/USD might be just around the corner.
Thanks to these circumstances, the exchange rate slipped under the lower border of the green gap, which is an additional bearish development (…)
How low can the pair go in the coming days? In our opinion, the first downside target will be the lower border of the green rising trend channel (currently at around 0.7247).
From today’s point of view, we see that the situation developed in line with the above scenario as currency bears not only pushed AUD/USD to the downside target, but also managed to close yesterday’s session below it.
Although the exchange rate rebounded a bit before yesterday’s closure, the above-mentioned negative development triggered one more downswing earlier today. Additionally, the sell signals generated by the indicators remain in the cards, supporting further deterioration in the coming week.
What impact could it have on the value of AUD/USD?
In our opinion, if the pair moves lower from current levels and drops below yesterday’s low (and the 50% Fibonacci retracement), we’ll see at least a test of the green support zone based on the mid-November lows and the 61.8% retracement.
Nevertheless, if this support is broken, the way to the upper border of the red declining trend channel will likely be open.
Trading position (short-term; our opinion): No positions are justified from the risk/reward perspective.
Thank you.
Nadia Simmons
Forex & Oil Trading Strategist
Przemyslaw Radomski, CFA
Founder, Editor-in-chief, Gold & Silver Fund Manager
Gold & Silver Trading Alerts
Forex Trading Alerts
Oil Investment Updates
Oil Trading Alerts

