

Friday's rebound and Monday's session filled the heart of more than one bull with hope for a bigger move to the north. Unfortunately, quite quickly it turned out that the buyers lacked enough strength to break through the first solid resistance. What can they expect in the coming days?
- EUR/USD: short (a stop-loss order at 1.1746; the initial downside target at 1.1343)
- GBP/USD: none
- USD/JPY: none
- USD/CAD: none
- USD/CHF: none
- AUD/USD: none
EUR/USD
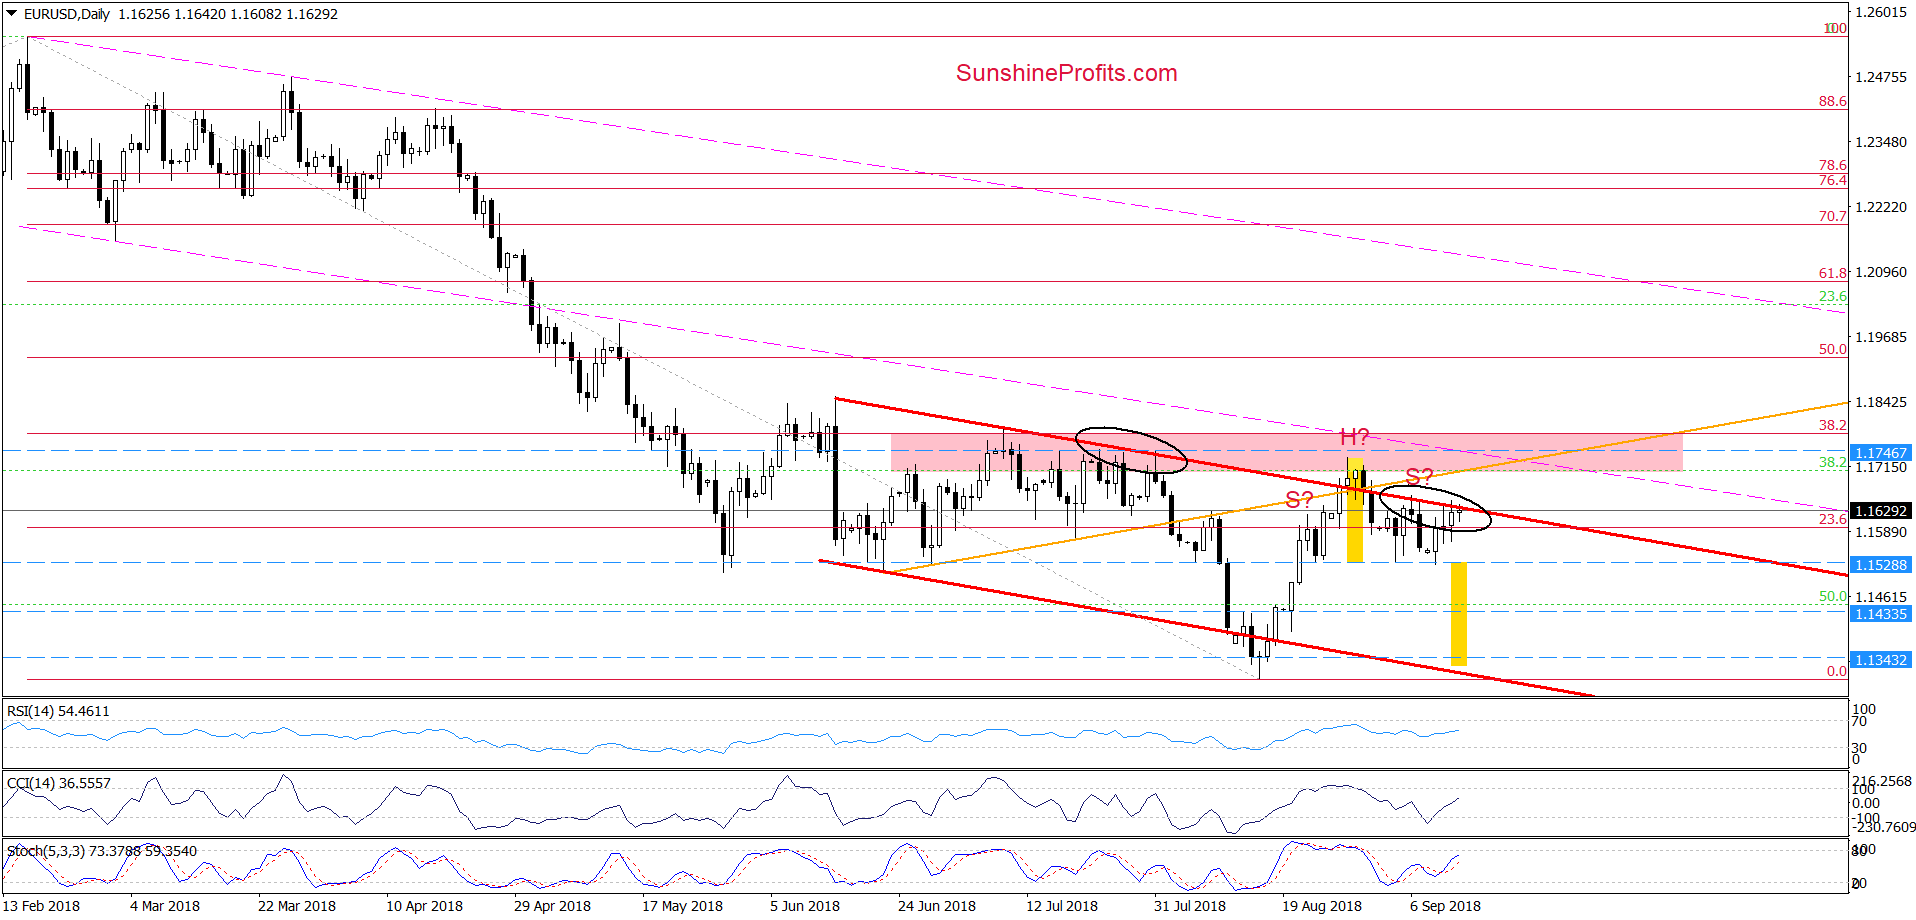
On the daily chart, we see that EUR/USD moved a bit higher yesterday, which resulted in a re-test of the upper border of the red declining trend channel (there was even a tiny breakout above this resistance, but it was invalidated very quickly).
Earlier today, currency bulls took the pair to this major short-term resistance once again, but their opponents continue to keep gains in check, which means that our Tuesday’s comments are still valid:
(…) When we take a closer look at the daily chart, we clearly see that similar situation we observed at the end of July, which increases the probability that the next bigger move will be to the downside and lower values of the exchange rate are just around the corner.
Taking all the above into account (…) we believe that as long as the exchange rate is trading under the upper border of the red declining trend channel, lower values of EUR/USD are ahead of us and one more test of the blue dashed horizontal line is more likely than not.
What could happen if we see a breakdown under this support?
In our opinion, EUR/USD will extend its decline not only to our initial downside target but will also test the recent lows (in terms of daily closures) or even the lower line of the red declining trend channel.
Trading position (short-term; our opinion): Short positions with a stop-loss order at 1.1746 and the initial downside target at 1.1343 are justified from the risk/reward perspective. We will keep you informed should anything change, or should we see a confirmation/invalidation of the above.
USD/JPY
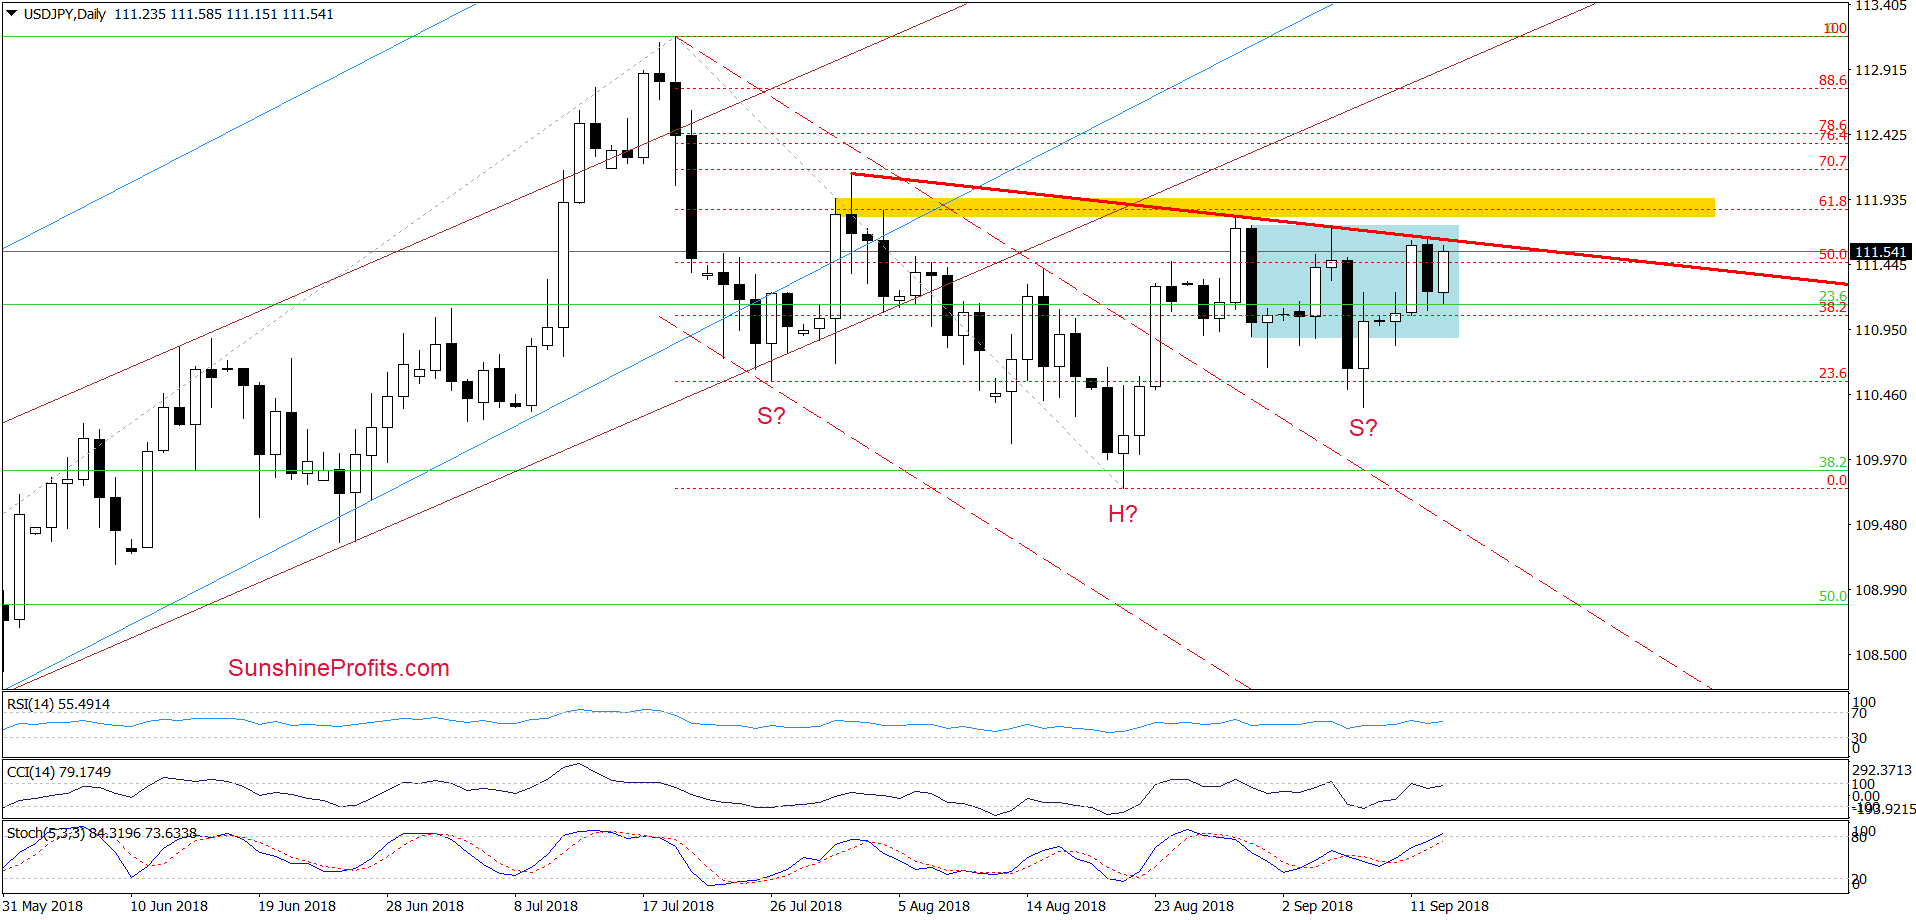
As you see on the daily chart, the red declining resistance line (a potential neck line of the reverse head and shoulders formation) stopped the buyers during Wednesday’s session, triggering a quite sharp downswing.
Despite this move, currency bulls almost completely covered yesterday's losses earlier today, approaching the above-mentioned resistance once again. Taking this fact into account and combining it with the lack of the sell signals from the indicators, we believe that our last commentary on this currency pair remains up-to-date also today:
(…) the buyers will have to break above the red declining resistance line based on August peaks.
How important could this line be for the future of the bulls?
(…) it could be the neck line of a potential reverse head and shoulders formation. Therefore, if currency bulls manage to break above it, we could see an upward move not only above the yellow resistance zone (created by the 61.8% Fibonacci retracement and the highs that we saw at the turn of July and August), but also a test of the July peaks or even a rally to around 114, where the size of the increases will correspond to the height of the above-mentioned formation.
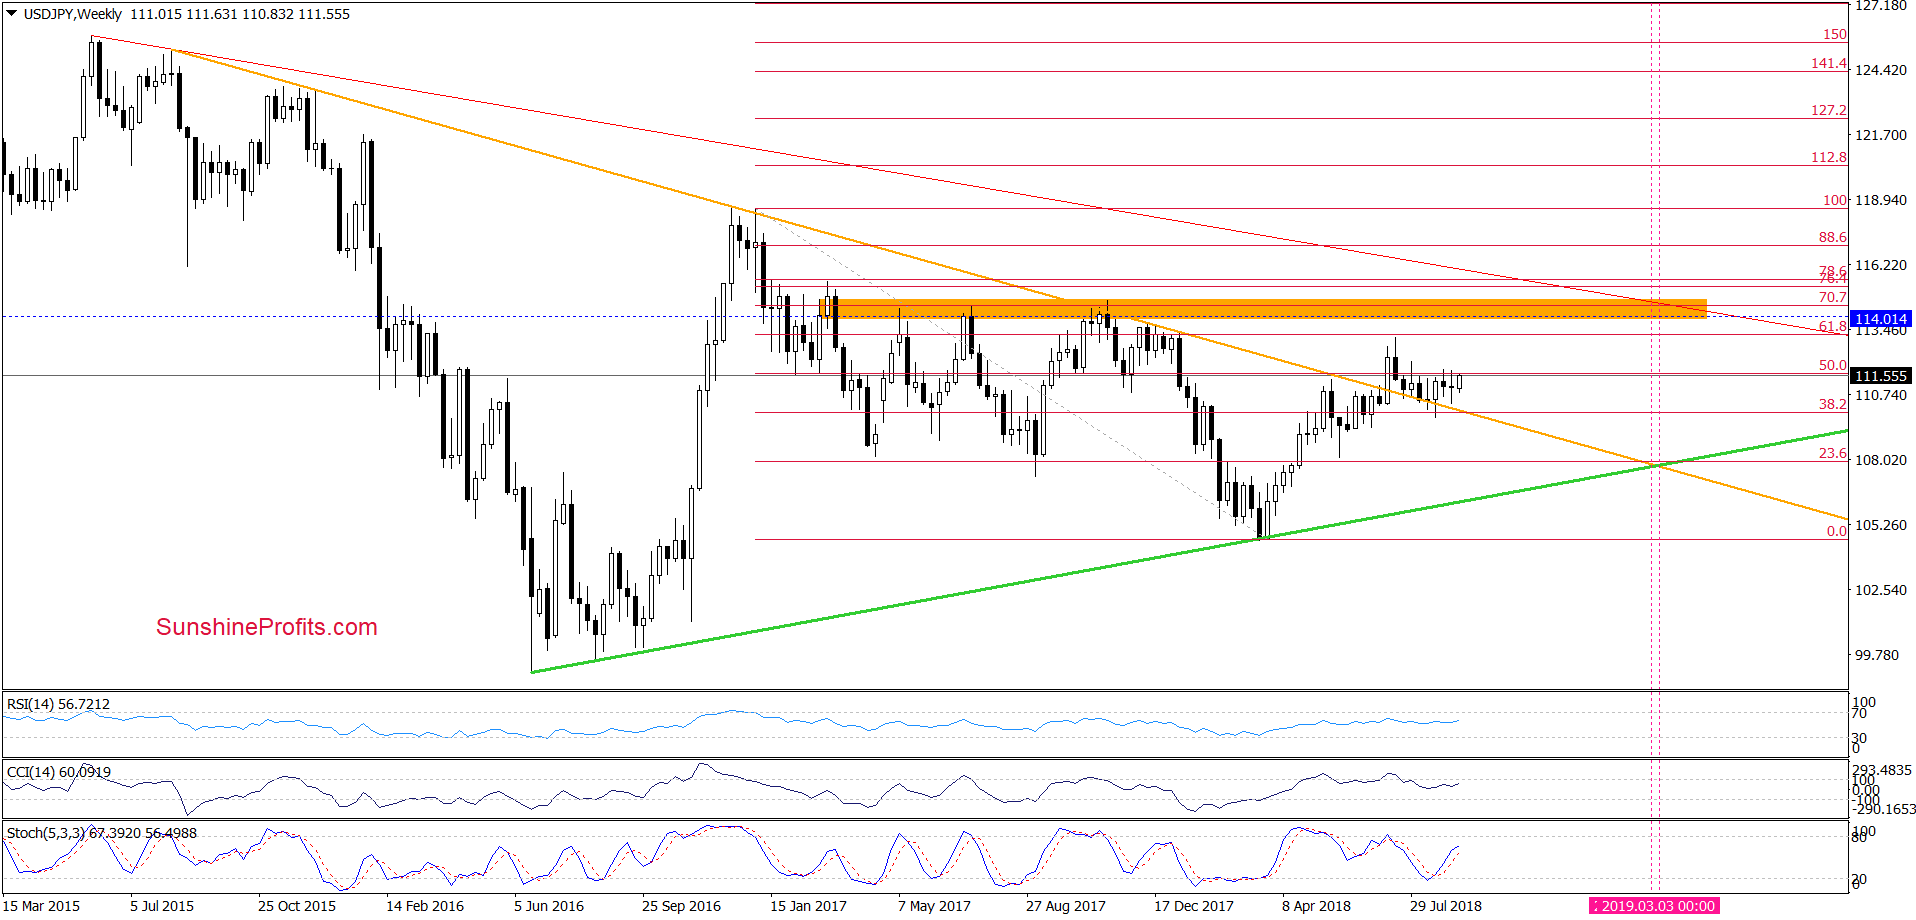
What’s interesting, in this area is also the lower border of the orange resistance zone (seen on the weekly chart below), which stopped the buyers several times in the past.
Therefore, if we see a confirmed breakout above the red resistance line and the upper line of the blue consolidation, we’ll likely open long positions (of course, if there are no other technical contraindications to this). We will keep you informed should anything change, or should we see a confirmation/invalidation of the above.
Trading position (short-term; our opinion): No positions are justified from the risk/reward perspective.
USD/CHF
On Tuesday, we wrote the following:
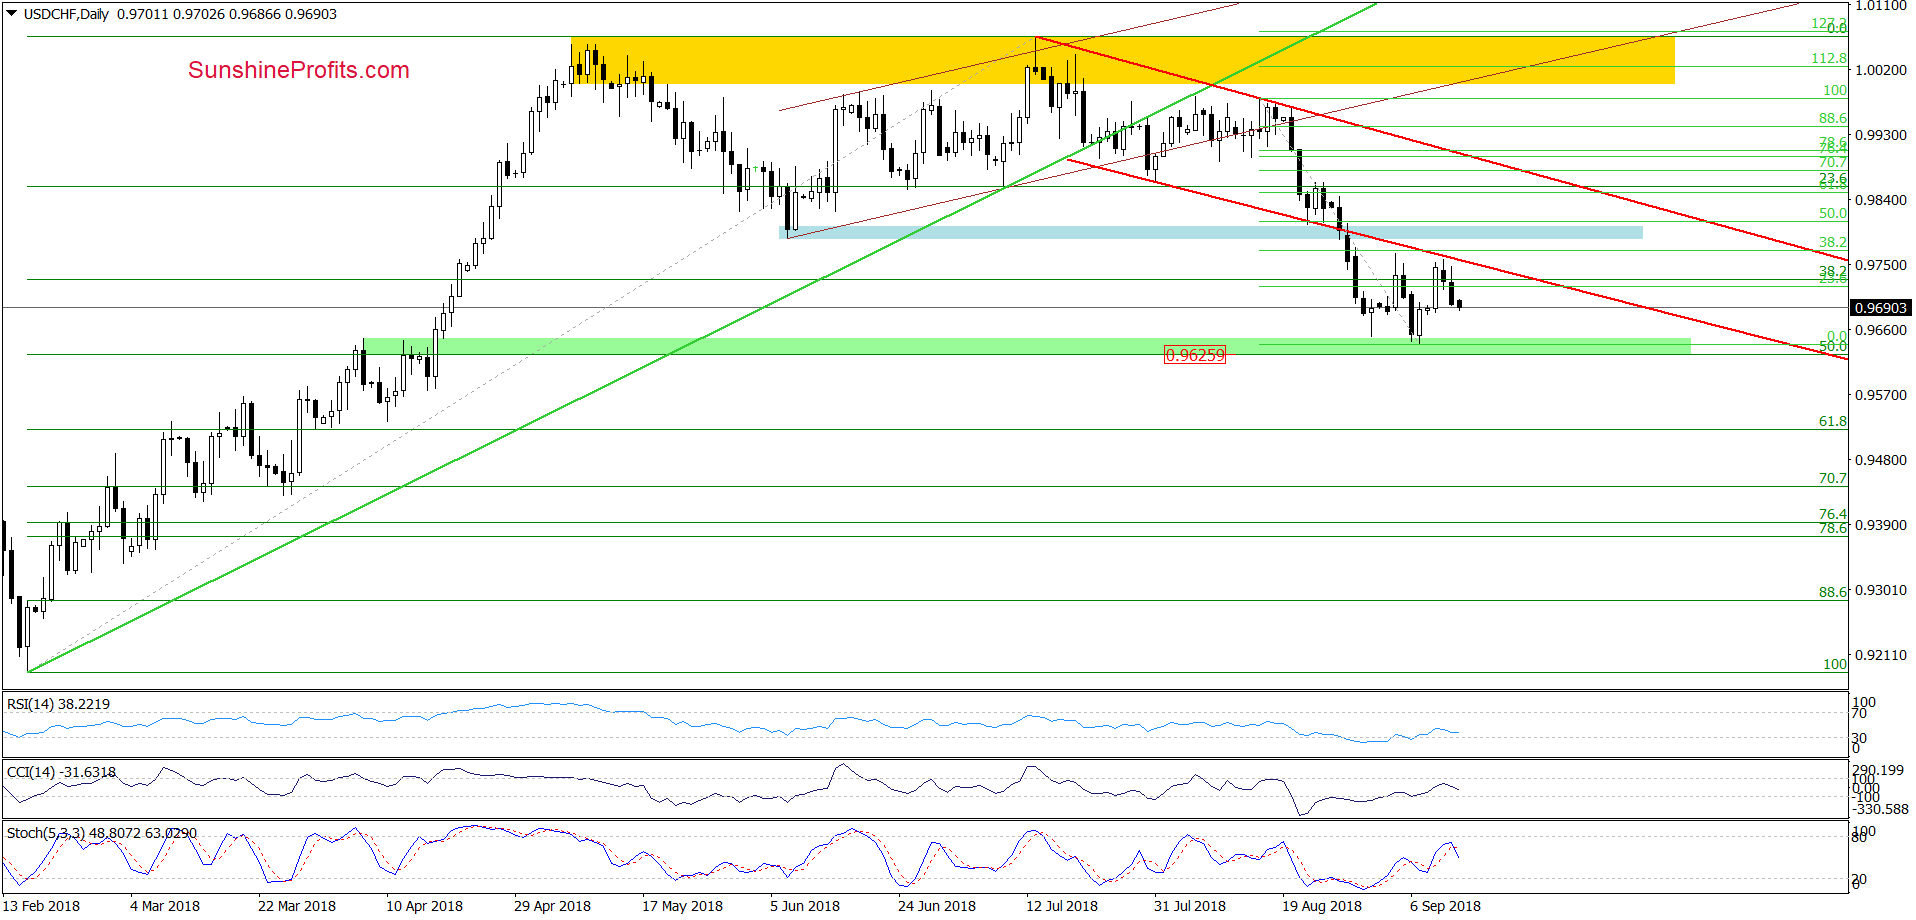
(…) the exchange rate increased to the lower line of the red declining trend channel (…) but despite this upswing, the sellers managed to stop their opponents and triggered a pullback, which invalidated a tiny breakout above this resistance.
Such price action suggests that currency bears are quite active in this area and (…) correction of the recent rebound should not surprise us.
Looking at the daily chart, we see that although currency bulls tried to push the exchange rate higher yesterday, they failed not far from the opening price. This show of weakness triggered a decline, which erased almost entire Monday’s upswing.
Earlier today, currency bears extended losses, which together with the sell signal generated by the Stochastic Oscillator suggests that we’ll see a re-test of the green support zone in the very near future.
Trading position (short-term; our opinion): No positions are justified from the risk/reward perspective. We will keep you informed should anything change, or should we see a confirmation/invalidation of the above.
Thank you.
Nadia Simmons
Forex & Oil Trading Strategist
Przemyslaw Radomski, CFA
Founder, Editor-in-chief, Gold & Silver Fund Manager
Gold & Silver Trading Alerts
Forex Trading Alerts
Oil Investment Updates
Oil Trading Alerts

