

Earlier today, the euro, the British pound and the Australian dollar extended losses against the greenback, which resulted in interesting developments that may be important for the next bigger move. What happened at the same time with our other currency pairs?
In our opinion the following forex trading positions are justified - summary:
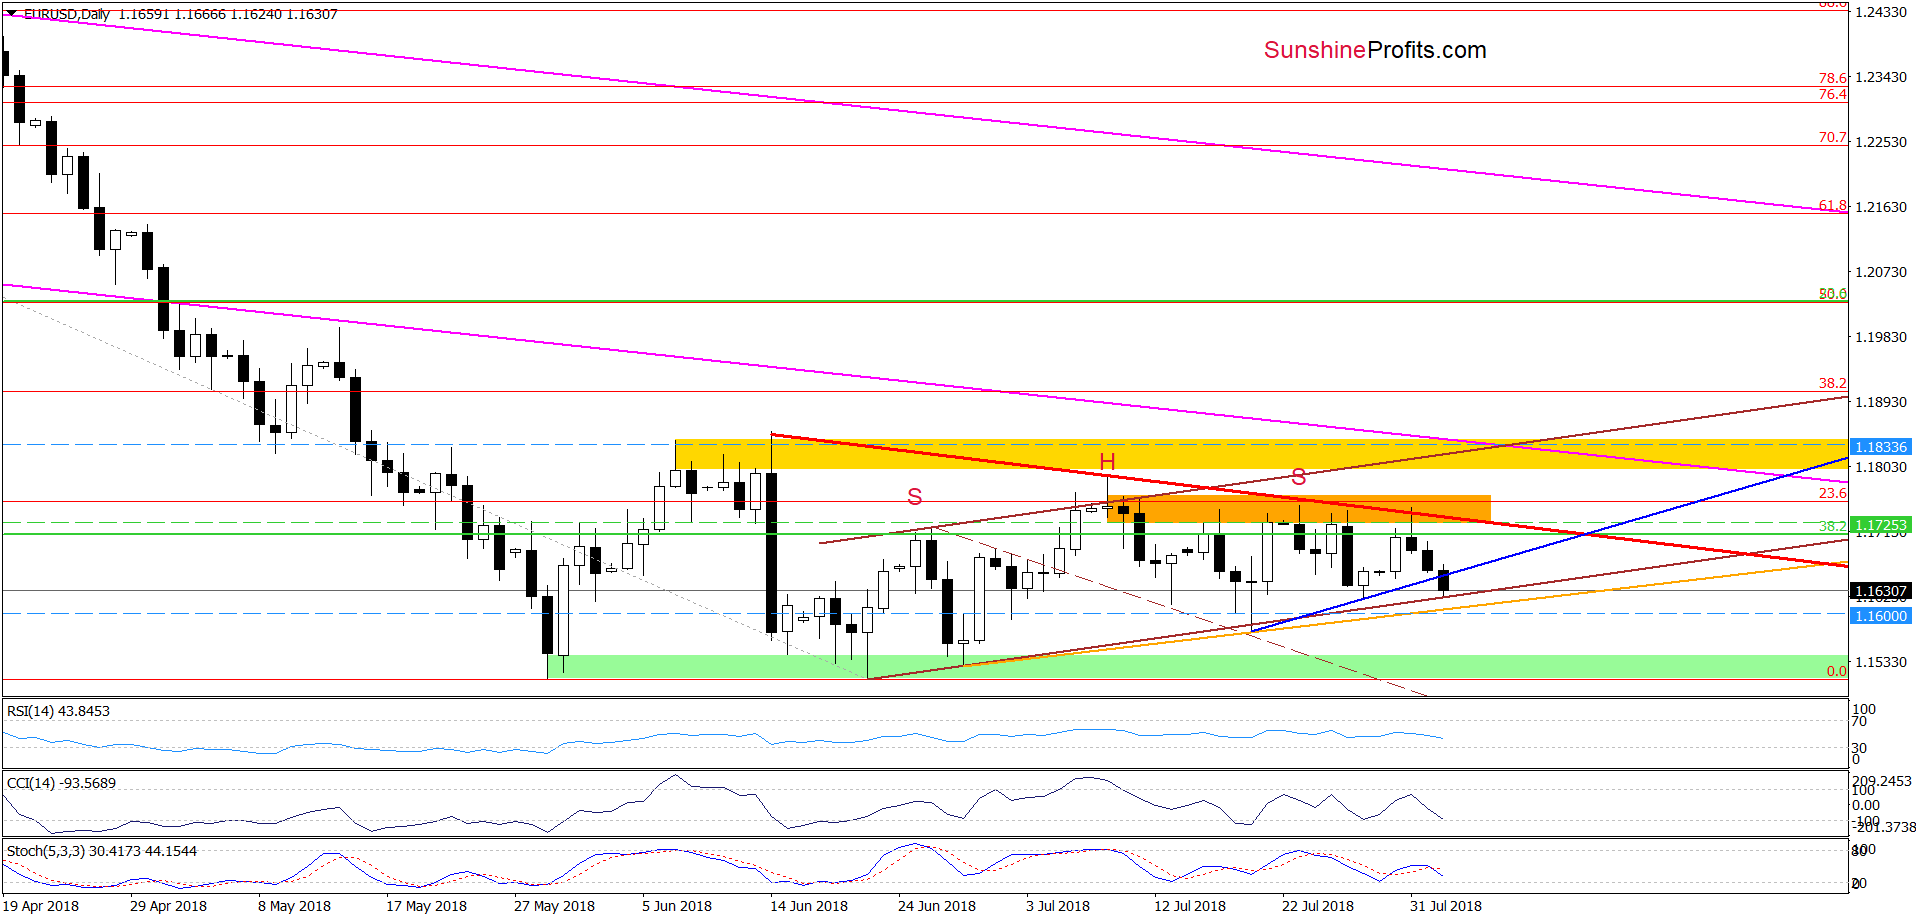
- EUR/USD: short (a stop-loss order at 1.1833; the initial downside target at 1.1588)
- GBP/USD: short (a stop-loss order at 1.3301; the initial downside target at 1.2913)
- USD/JPY: long (a stop-loss order at 110.21; the initial upside target at 113.50)
- USD/CAD: none
- USD/CHF: none
- AUD/USD: short (a stop-loss order at 0.7510; the initial downside target at 0.7315)
EUR/USD
Yesterday, we wrote:
(…) EUR/USD extended losses, which suggests that we’ll see (at least) a drop to the blue support line based on recent lows. Nevertheless, if the Stochastic Oscillator generates the sell signal, the pair will likely also test the strength of the lower border of the brown rising trend channel in the coming days.
From today’s point of view, we see that the situation developed in line with the above scenario and the exchange rate not only broke below the blue support line based on recent lows, but also slipped to the lower border of the brown rising trend channel.
What’s next? Taking into account the sell signal generated by the Stochastic Oscillator, we think that the pair will move even lower. If we see a drop below the orange support line (the neck line of the potential head and shoulders formation), EUR/USD will (at least) decline to the May and June lows in the following days.
Trading position (short-term; our opinion): short positions with a stop-loss order at 1.1833 and the initial downside target at 1.1588 are justified from the risk/reward perspective. We will keep you informed should anything change, or should we see a confirmation/invalidation of the above.
GBP/USD
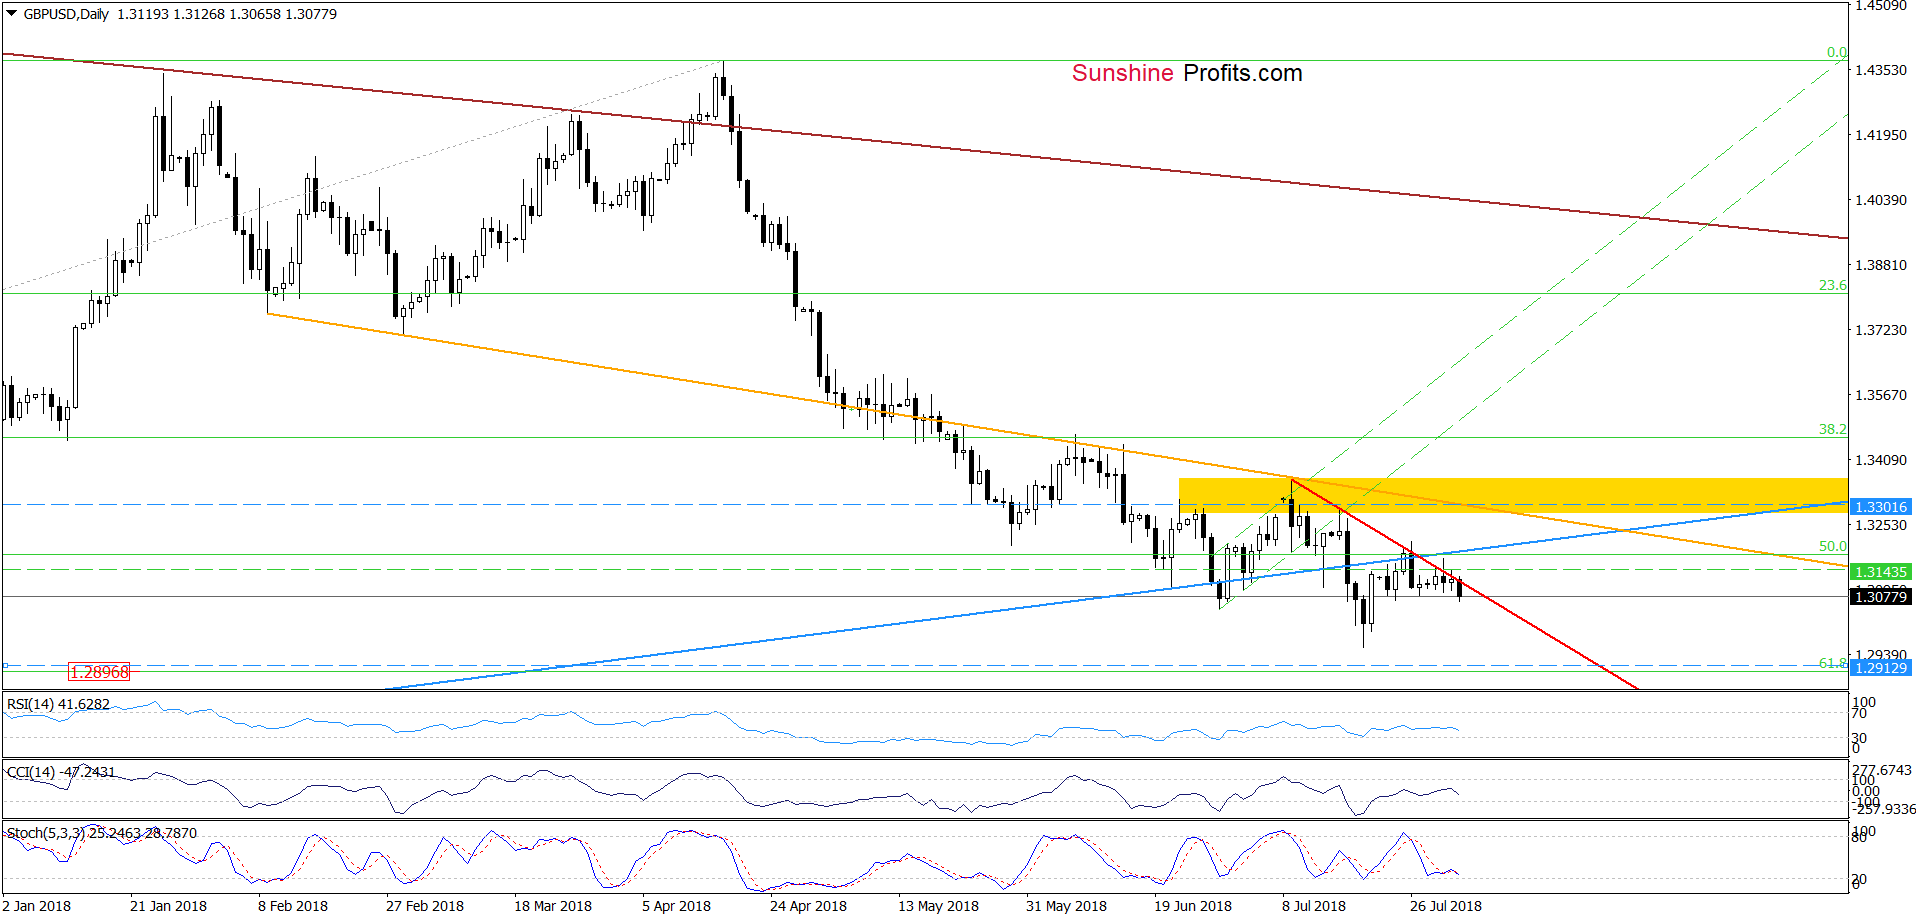
Looking at the above chart, we see that GBP/USD extended losses earlier today, which means that what we wrote yesterday remains up-to-date:
(…) the pair reversed and declined, which looks like a verification of the earlier breakdown (a negative sign). Additionally, yesterday’s drop invalidated a small breakout above the very short-term red declining resistance line based on the previous highs, giving currency bears one more reason to go to the south in the following days.
If the situation develops in line with the above assumption, we’ll likely see a realization of the pro-bearish scenario from our Monday’s alert:
(…) If (…) the pair extends losses from here, we’ll likely see not only a test of the recent lows, but also a drop to around 1.2896, where the 61.8% Fibonacci retracement (based on the entire January 2017 – March 2018 upward move) is.
Trading position (short-term; our opinion): Short positions with a stop-loss order at 1.3301 and the initial downside target at 1.2913 are justified from the risk/reward perspective. We will keep you informed should anything change, or should we see a confirmation/invalidation of the above.
USD/JPY
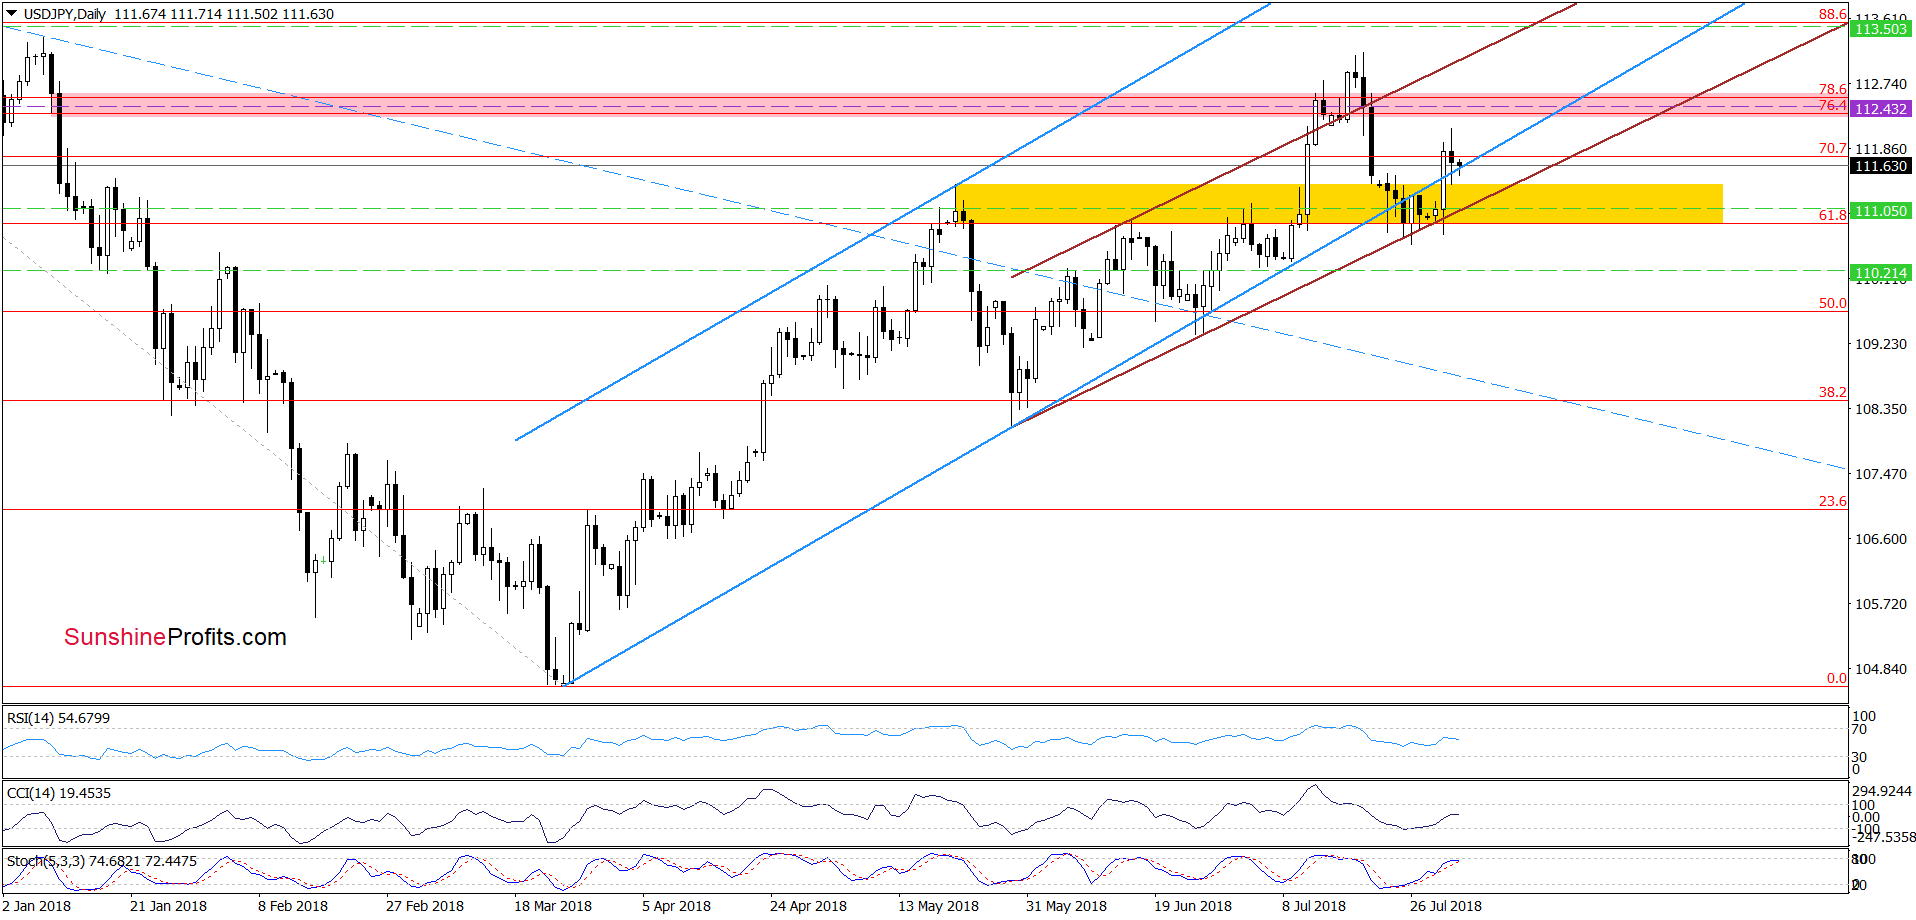
On the daily chart, we see that USD/JPY pulled back a bit during yesterday’s session, but despite this move the exchange rate closed the day above the lower border of the blue rising trend channel.
Earlier today, currency bears tested its strength once again, which looks like a verification of yesterday’s breakout. If this is the case and the support line withstands the selling pressure, we’ll see (at least) a test of the recent highs in the following days.
Trading position (short-term; our opinion): long positions with a stop-loss order at 110.21 and the initial upside target at 113.50 are justified from the risk/reward perspective. We will keep you informed should anything change, or should we see a confirmation/invalidation of the above.
USD/CAD
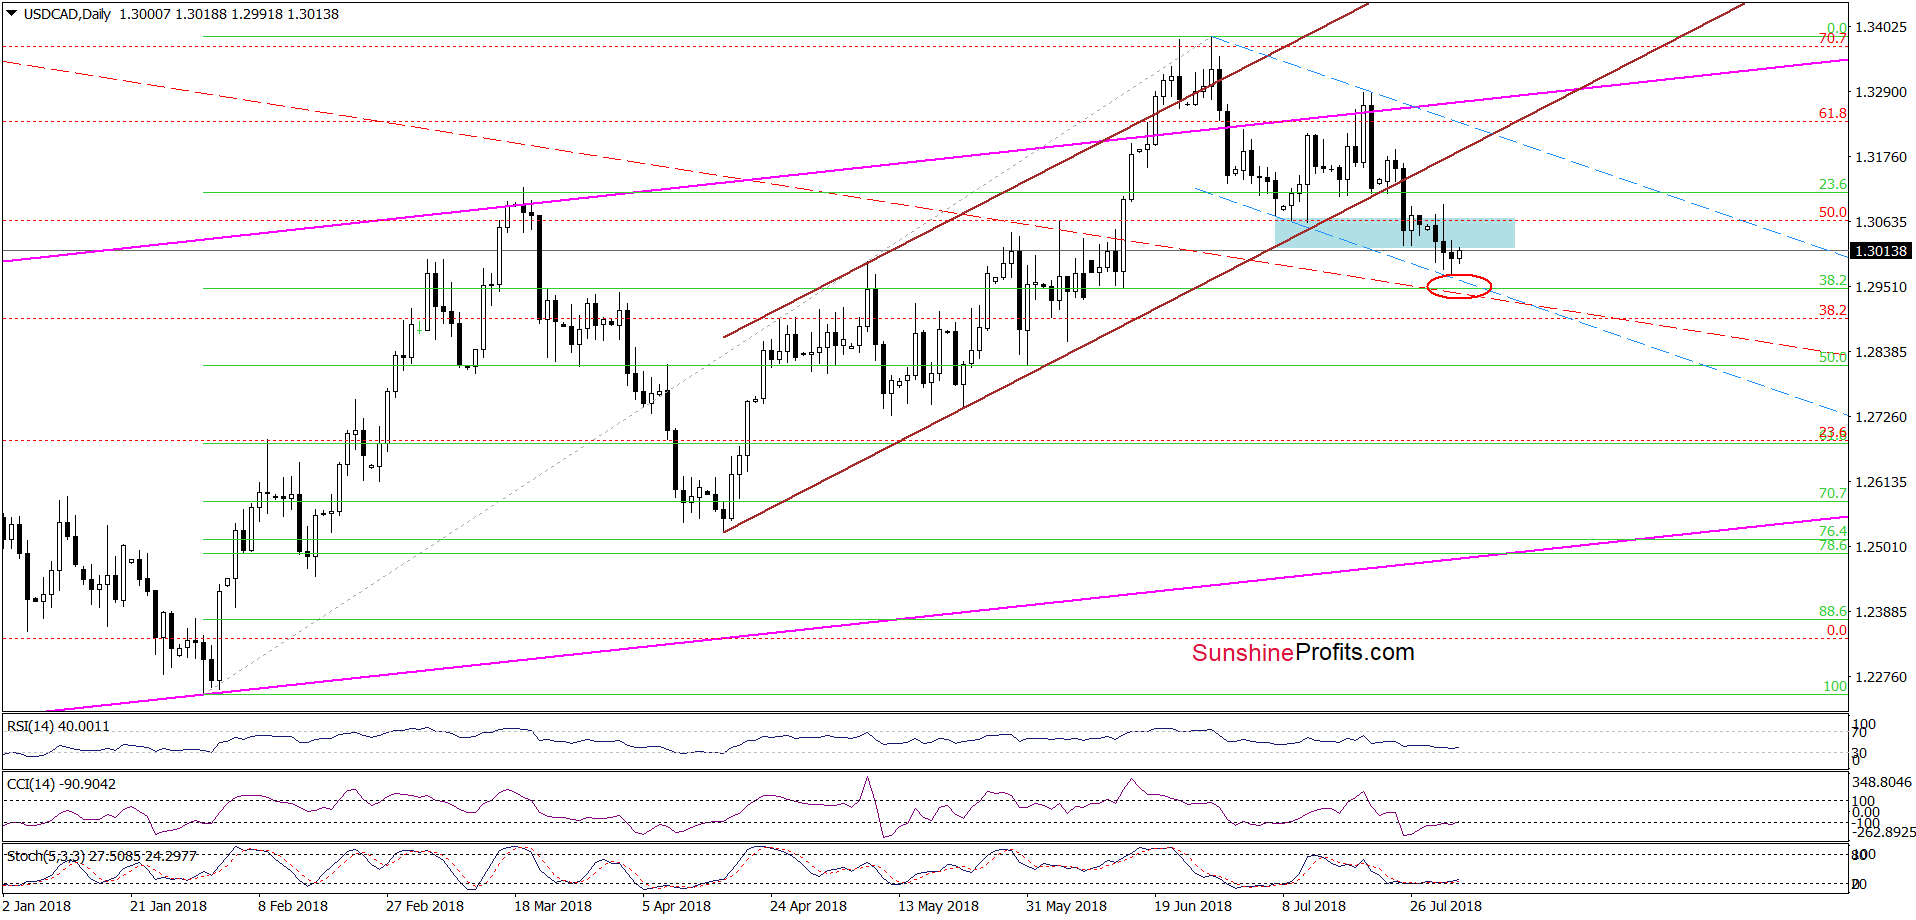
Looking at the daily chart, we see that although USD/CAD moved lower yesterday, the pair came back to the lower line of the blue resistance zone, which means that our last commentary on this currency pair is up-to-date:
(…) USD/CAD extended yesterday’s rebound, while the CCI and the Stochastic Oscillator generated the buy signals, which suggests another attempt to move higher is likely in the very near future.
If this is the case and the exchange rate climbs above yesterday’s intraday high, we’ll see a test of the previously-broken lower border of the brown rising trend channel in the following days.
Trading position (short-term; our opinion): No positions are justified from the risk/reward perspective. We will keep you informed should anything change, or should we see a confirmation/invalidation of the above.
USD/CHF
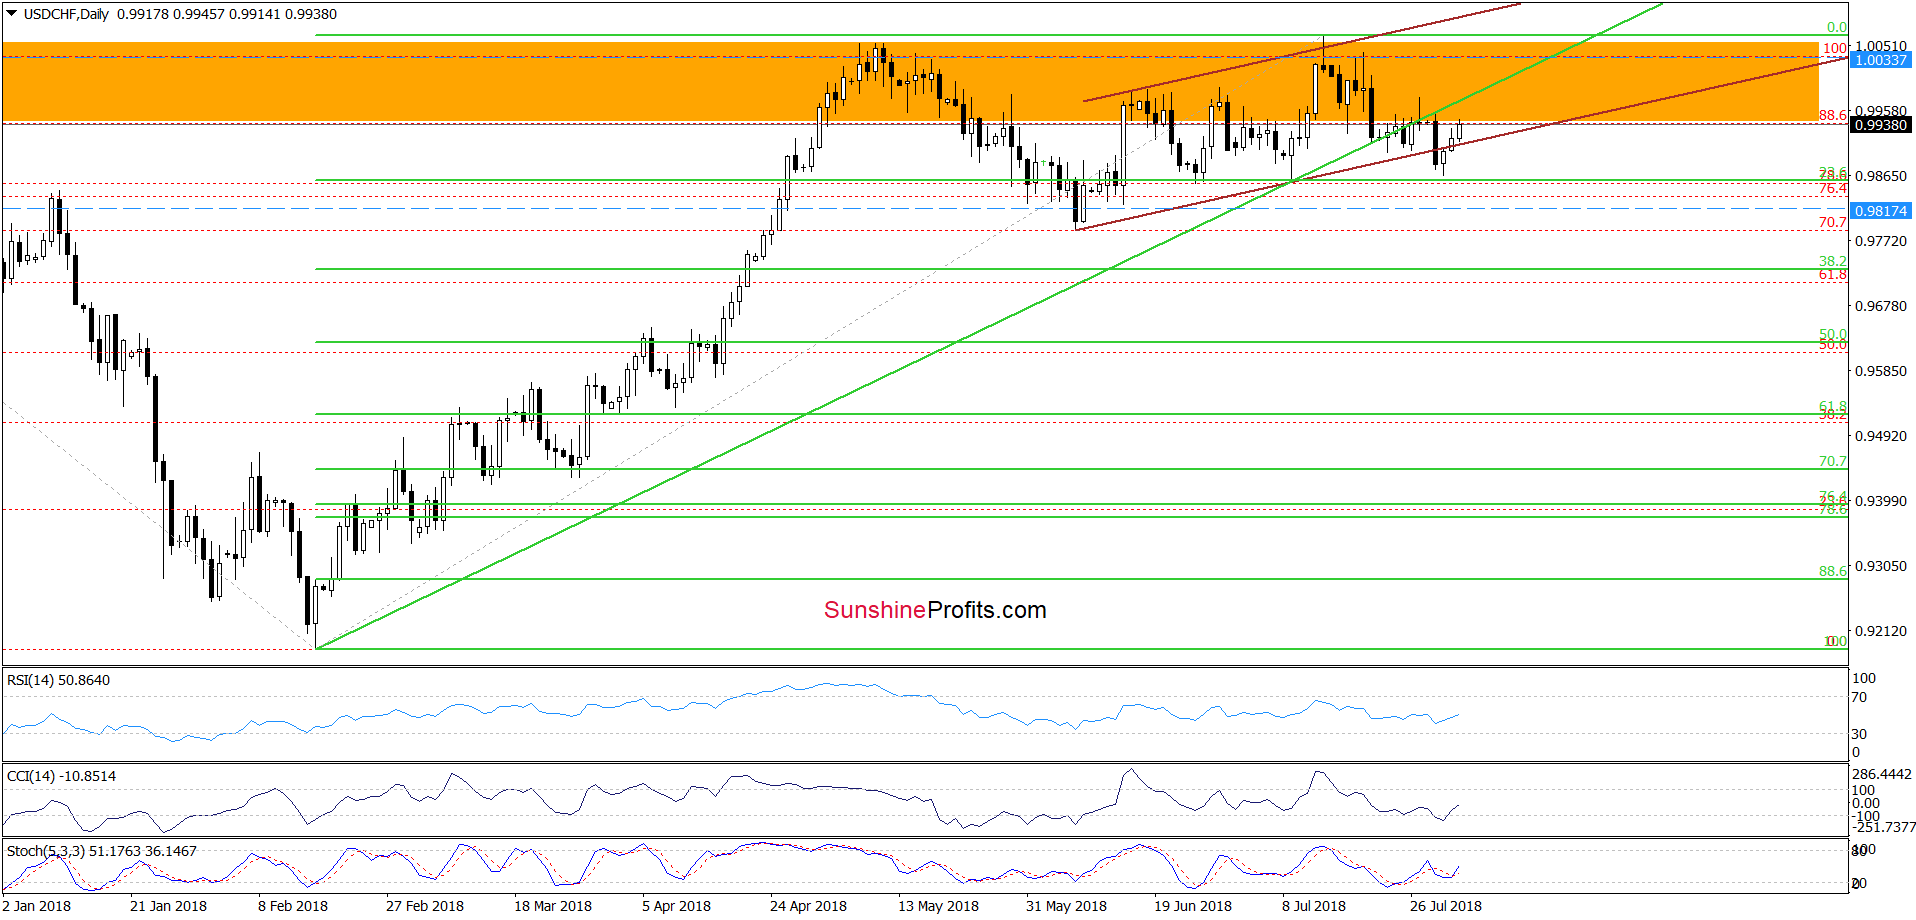
From today’s point of view, we see that USD/CHF extended gains above the lower border of the brown rising trend channel, which means that what we wrote yesterday remains valid also today:
(…) the pair came back into the channel earlier today. Nevertheless, the situation will be more positive if the exchange rate closes today’s above this line (in this case we’ll see an invalidation of the earlier small breakdown).
If we see such price action, USD/CHF will likely also test the previously-broken medium-term green support/resistance line in the following day(s). On the other hand, however, if currency bulls fail, we can see a test of the strength of the nearest support zone created by the 23.6% Fibonacci retracement, the last June and July lows.
Trading position (short-term; our opinion): No positions are justified from the risk/reward perspective. We will keep you informed should anything change, or should we see a confirmation/invalidation of the above.
AUD/USD
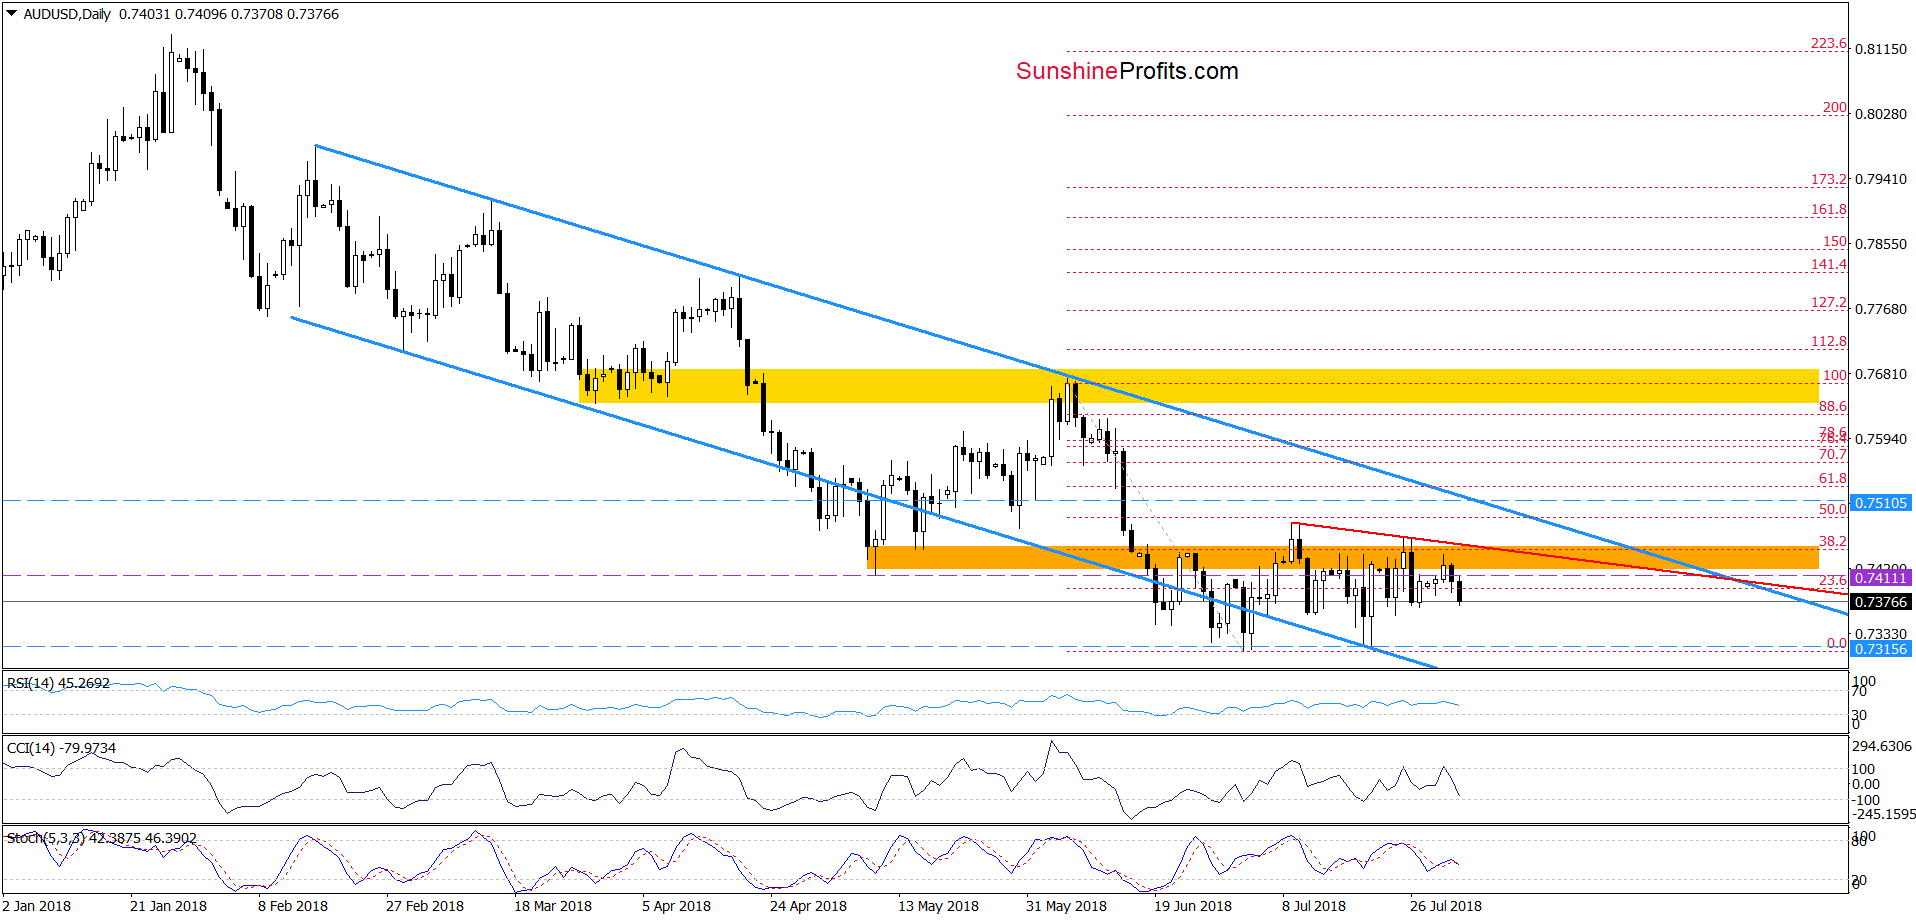
As you see on the daily chart, the orange resistance zone stopped the buyers once again, triggering a pullback. Taking this fact into account, we believe that what we wrote on Wednesday is up-to-date also today:
(…) the pair is still trading under the red declining resistance line based on the previous highs (similar to EUR/USD), which means that higher values of the exchange rate will be seen only if we see a breakout above it.
Until this time, another reversal and decline should not surprise us. How low could the pair go if the situation develops in line with our assumptions?
In our opinion, if AUD/USD extends losses from current levels, the exchange rate will (at least) decline to the earlier July lows or even test the lower border of the blue declining trend channel in the coming week.
Trading position (short-term; our opinion): short positions with a stop-loss order at 0.7510 and the initial downside target at 0.7315 are justified from the risk/reward perspective. We will keep you informed should anything change, or should we see a confirmation/invalidation of the above.
On an administrative note, due to your editor travel plans, there will be no Forex Trading Alert on Friday (Aug. 3, 2018). The next Forex Trading Alert is scheduled for Monday, Aug. 6, 2018.Thank you for your understanding.
Thank you.
Nadia Simmons
Forex & Oil Trading Strategist
Przemyslaw Radomski, CFA
Founder, Editor-in-chief, Gold & Silver Fund Manager
Gold & Silver Trading Alerts
Forex Trading Alerts
Oil Investment Updates
Oil Trading Alerts

