

Although the U.S. dollar moved sharply lower against the yen on Friday, currency bulls managed to trigger a rebound during the next sessions. As a result, the pair invalidated the earlier breakdown under the short-term support line but is it enough to push USD/JPY above 113?
- EUR/USD: none
- GBP/USD: none
- USD/JPY: long (a stop-loss order at 111.11; the initial upside target at 113.40)
- USD/CAD: none
- USD/CHF: none
- AUD/USD: none
EUR/USD
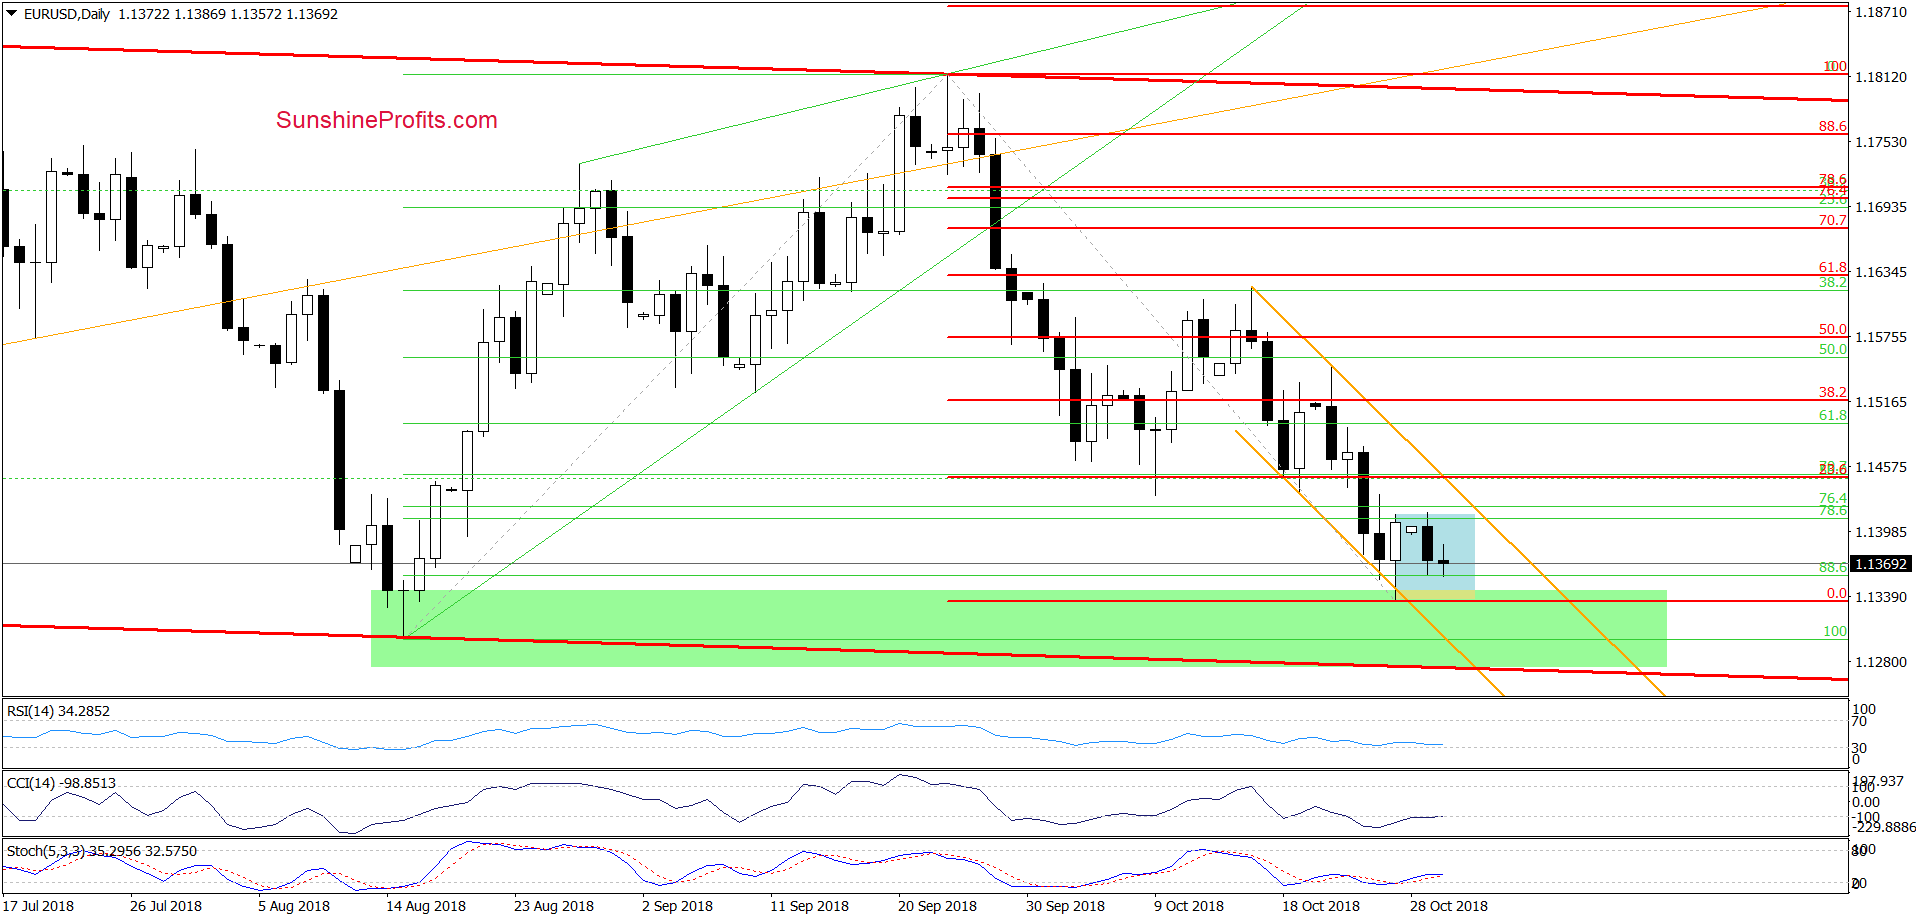
Looking at the daily chart, we see that the overall situation in the short (or even very short) term hasn’t changed much as EUR/USD remains in a blue consolidation inside the very short-term orange declining trend channel.
This suggests that as long as we do not see a breakout above the upper line of the consolidation and the upper order of the channel higher values of EUR/USD are not likely to be seen. The same applies to potential pro-declining currency bears’ plans. Until they break through below the lower line of the consolidation and the recent low, the way to fresh lows and the lower border of the channel is closed.
Connecting the dots, waiting at the sidelines for another profitable opportunity is justified from the risk/reward perspective.
Trading position (short-term; our opinion): None positions are justified from the risk/reward perspective.
USD/JPY
In our last commentary on this currency pair, we wrote the following:
(…) it is worth keeping in mind that even the bears try to go to the north once again, the green zone based on the previous lows and the 61.8% Fibonacci retracement are not far from current levels, giving currency bulls another support and a reason to act.
Additionally, the blue support line based on March and August lows continues to keep declines in check, increasing the likelihood of another upswing at the beginning of the next week.
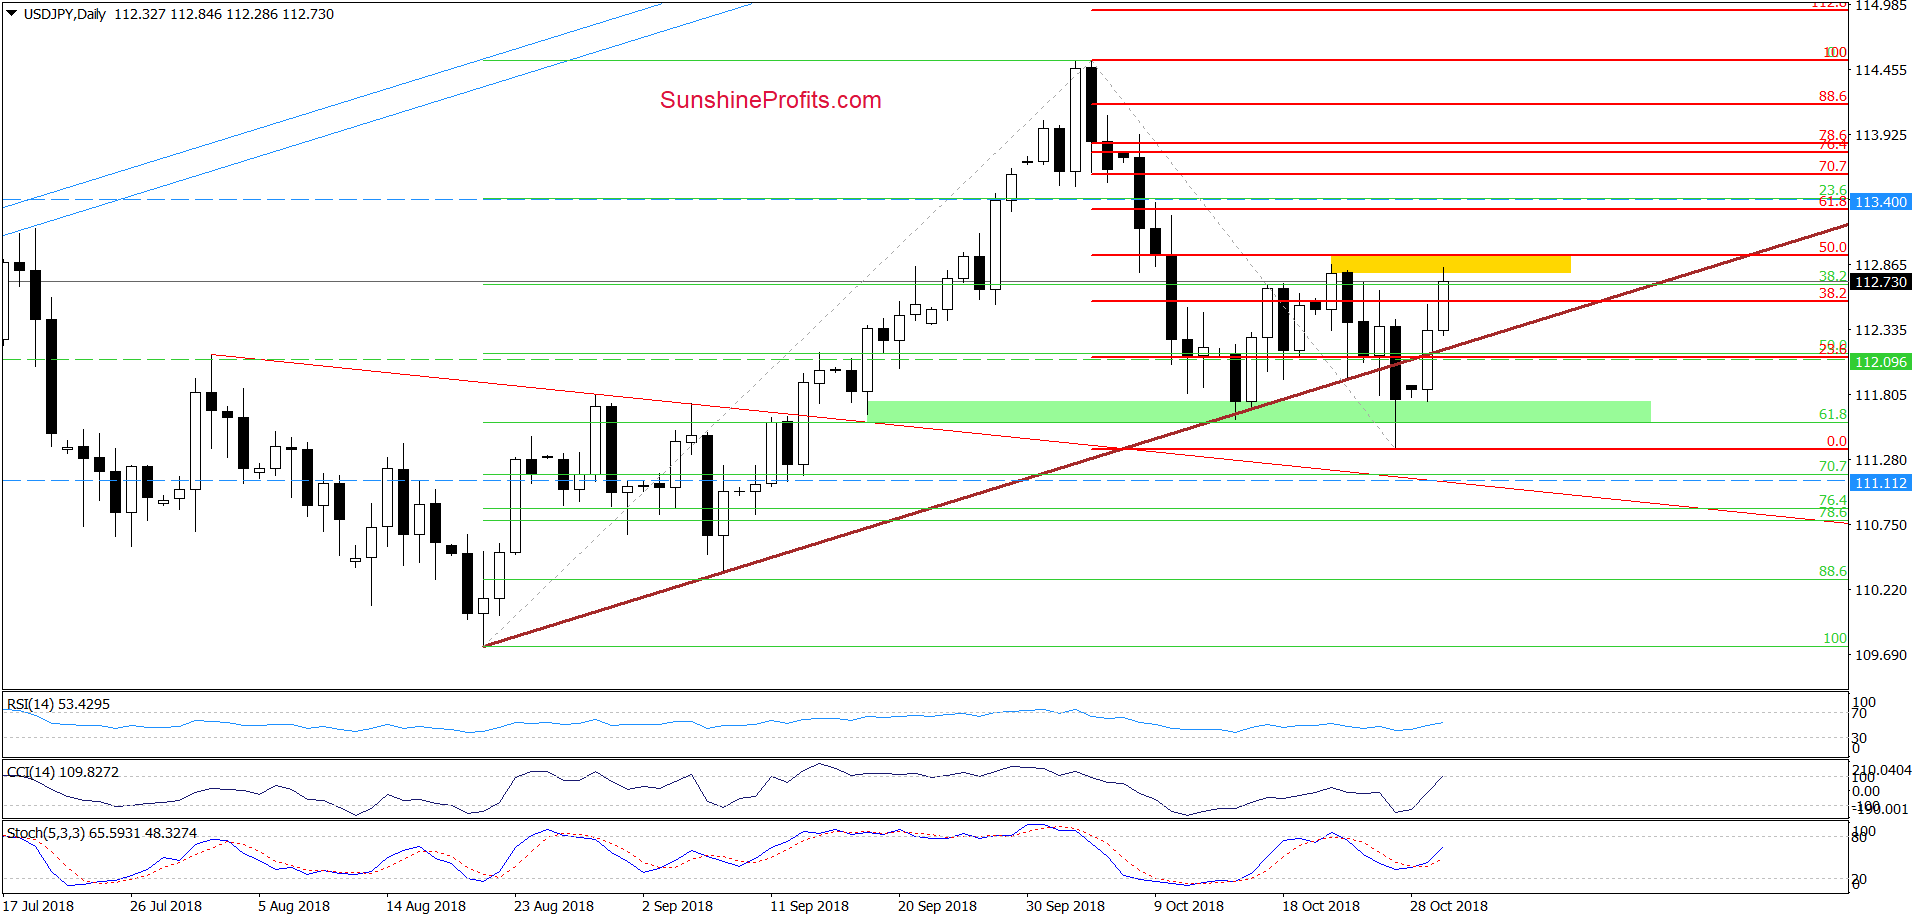
From today’s point of view, we see that USD/JPY declined sharply on Friday, which caused a drop below the brown support line based on the August and September lows and a test of the above-mentioned supports.
Nevertheless, despite this deterioration, currency bulls stayed cool and took the pair higher on Monday (as we had expected), which resulted in an invalidation of the earlier breakdown. This positive development triggered further improvement and the exchange rate climbed to the yellow resistance zone (created by the recent high and the 50% Fibonacci retracement) earlier today.
Although this area can trigger a pullback, we should keep in mind that the buy signals generated by the indicators continue to support further improvement in the very near future.
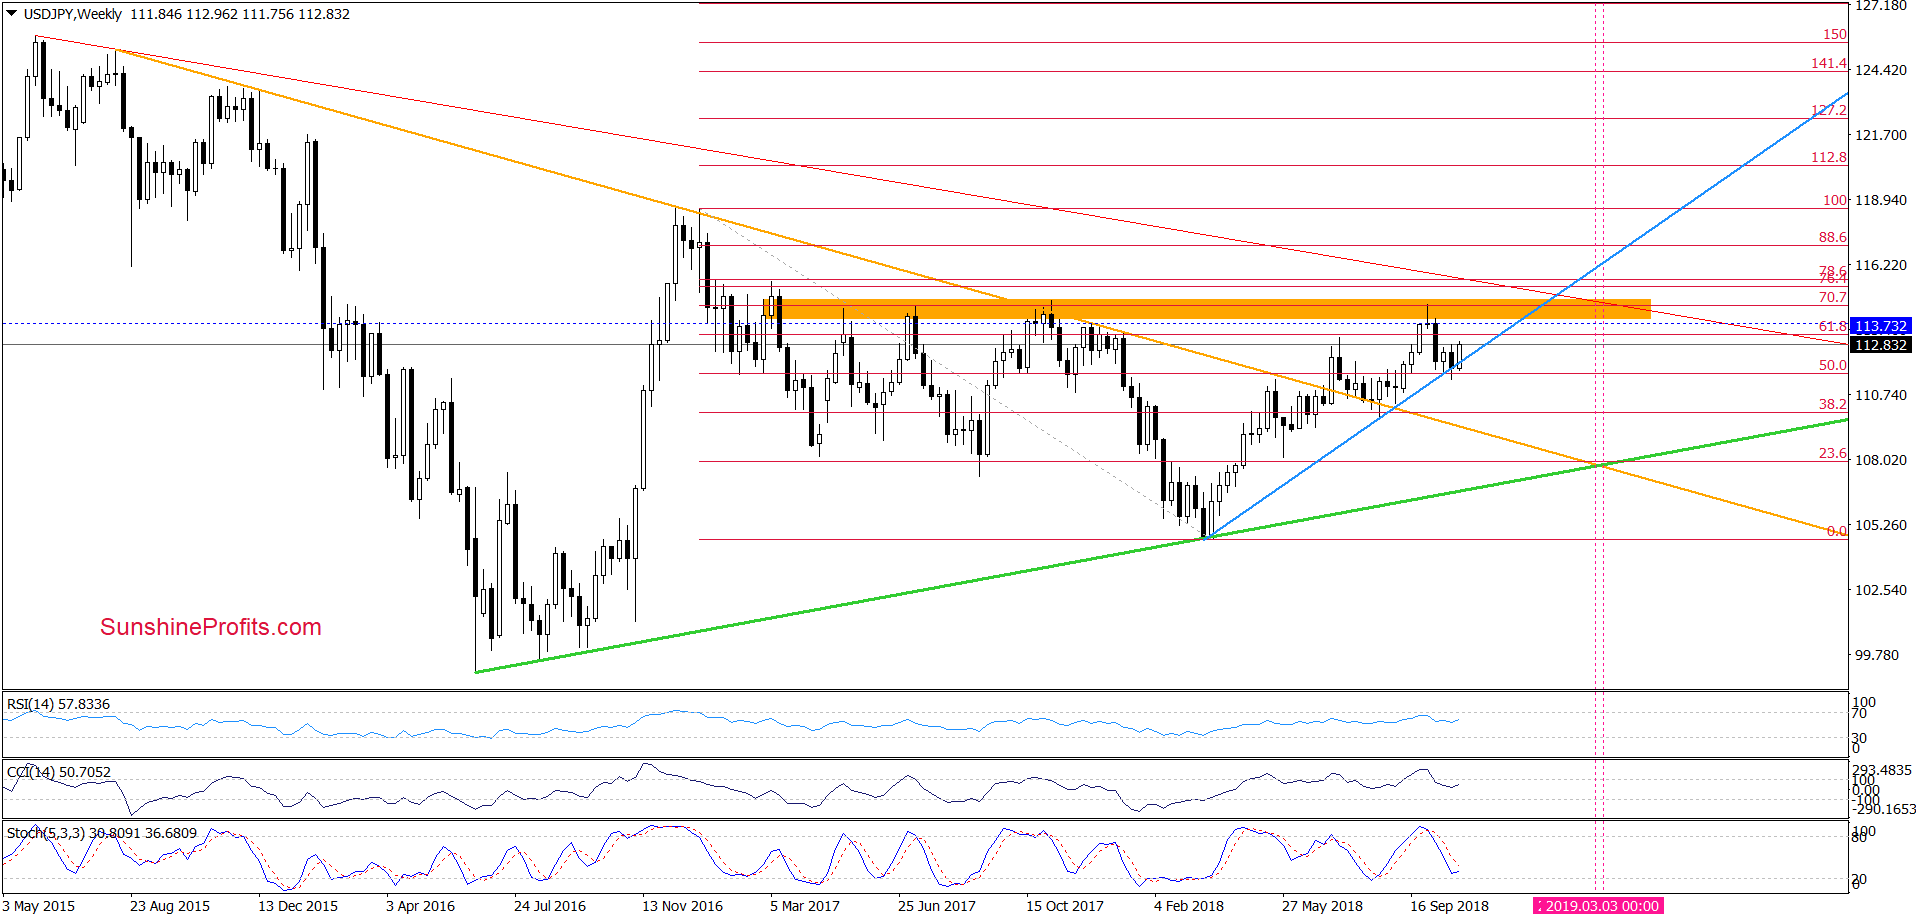
On top of that, this week’s rebound also invalidated a tiny breakdown under the long-term blue support line (based on the March and August lows) seen on the weekly chart, above, which increases the probability that USD/JPY will head north in the coming week.
How high can it go?
In our opinion, if the pair breaks above the yellow resistance area, we’ll see an increase to (at least) our initial upside target at 113.40 in the coming week.
Trading position (short-term; our opinion): long positions with a stop-loss order at 111.11 and the initial upside target at 113.40 are justified from the risk/reward perspective.
AUD/USD
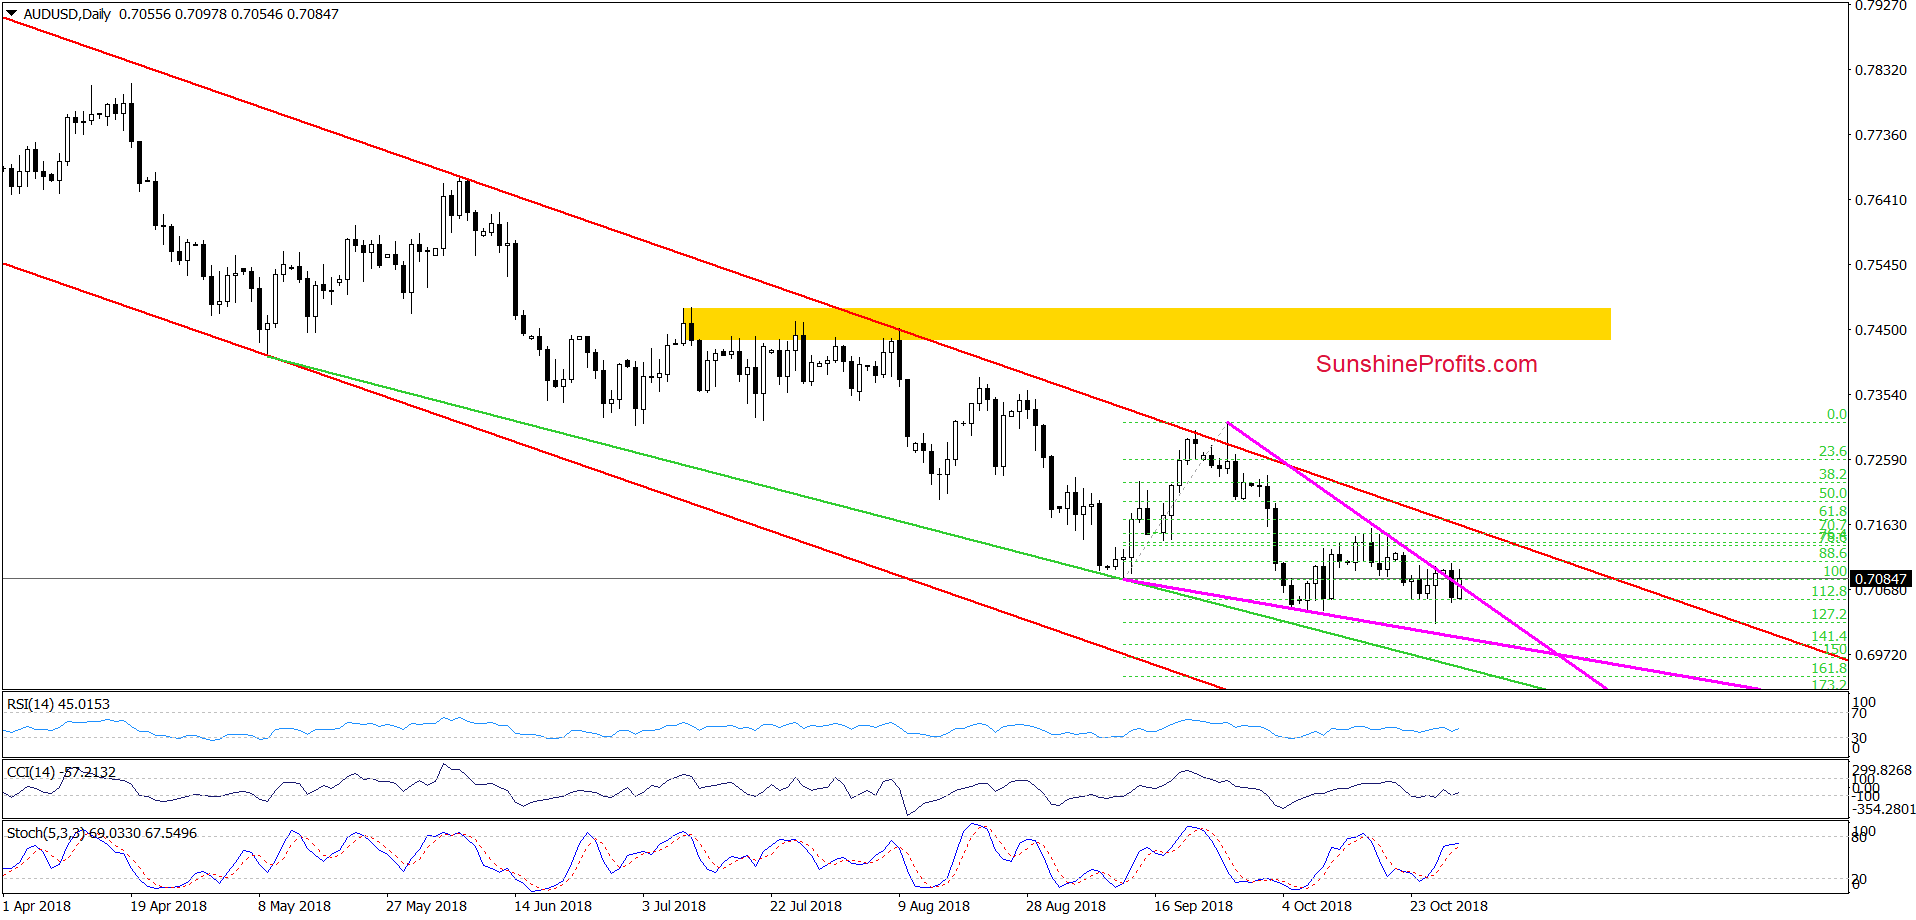
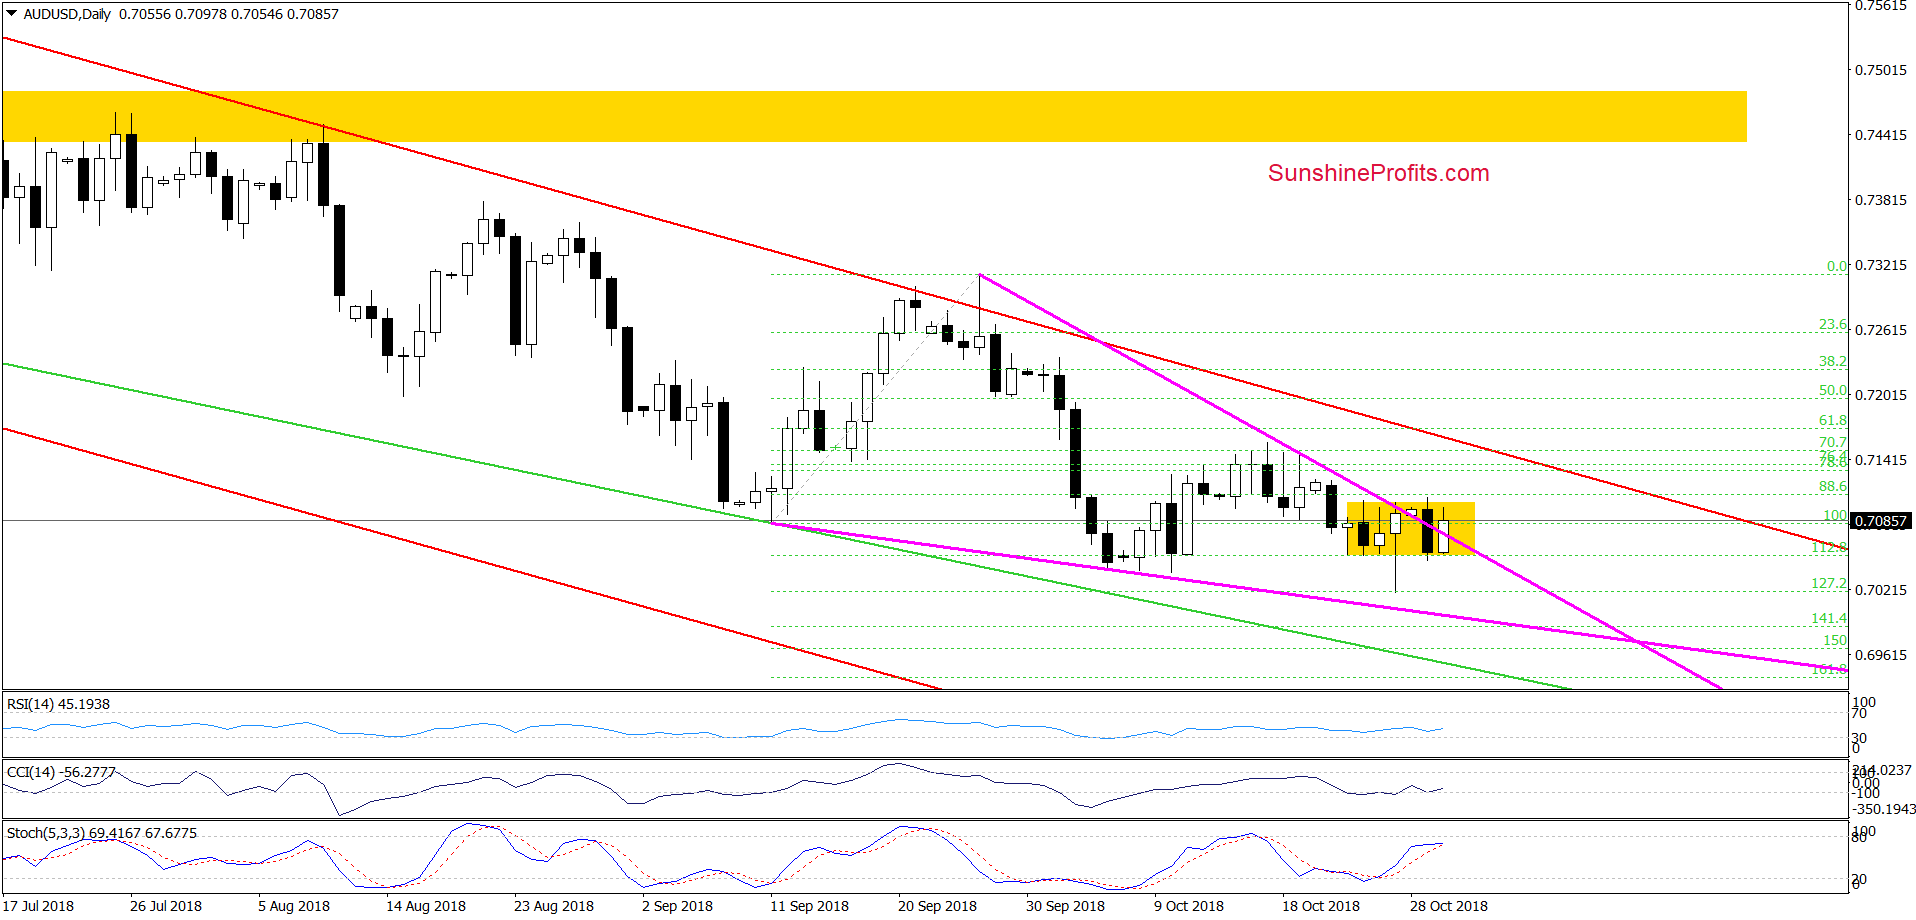
On the daily chart, we see that although AUD/USD moved sharply lower on Friday (which allowed us to close our short positions with profit), this deterioration was very temporary and currency bulls invalidated the breakdown under the early-October lows.
Yesterday, their opponents managed to invalidate the tiny breakout above the upper border of the pink declining triangle, but the buy signals generated by the indicators tempted buyers to re-fight for higher levels during today's session.
Thanks to their determination, the currency pair returned above the pink triangle, which suggests that further increases may be around the corner. If this is the case and AUD/USD extends gains from here, we’ll likely see a test of the mid-October highs or even the upper border of the red declining trend channel in the following days.
Finishing today’s alert, please keep in mind that if the pair breaks above these levels and there will be no pro-declining technical factors, we will consider opening long positions. Until this time, we decided to wait at the sidelines for another profitable opportunity. We will keep you informed should anything change, or should we see a confirmation/invalidation of the above.
Trading position (short-term; our opinion): None positions are justified from the risk/reward perspective.
Thank you.
Nadia Simmons
Forex & Oil Trading Strategist
Przemyslaw Radomski, CFA
Founder, Editor-in-chief, Gold & Silver Fund Manager
Gold & Silver Trading Alerts
Forex Trading Alerts
Oil Investment Updates
Oil Trading Alerts

