

The current situation in USD/JPY looks like preparations before a bigger move. Currency bulls and bears check how high and how low their opponents can push the exchange rate, but who has more technical arguments on its side?
In our opinion the following forex trading positions are justified - summary:
- EUR/USD: short (a stop-loss order at 1.1.2806; the initial downside target at 1.2186)
- GBP/USD: short (a stop-loss order at 1.1.4548; the initial downside target at 1.3820)
- USD/JPY: none
- USD/CAD: none
- USD/CHF: none
- AUD/USD: short (a stop-loss order at 0.8222; the initial downside target at 0.7730)
EUR/USD
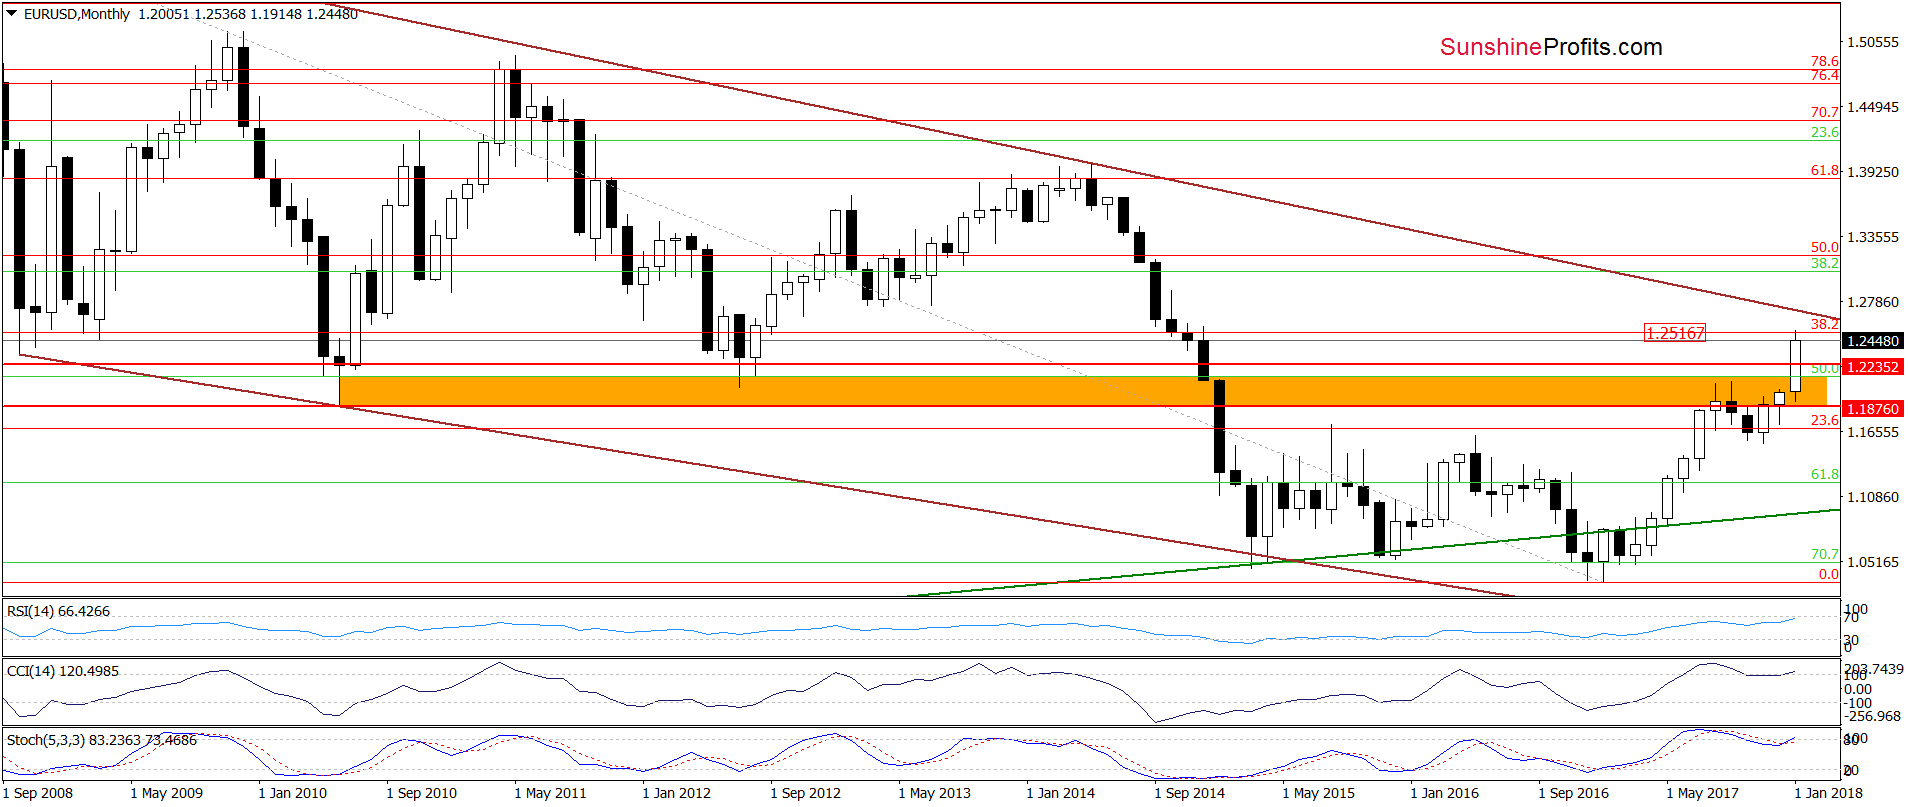
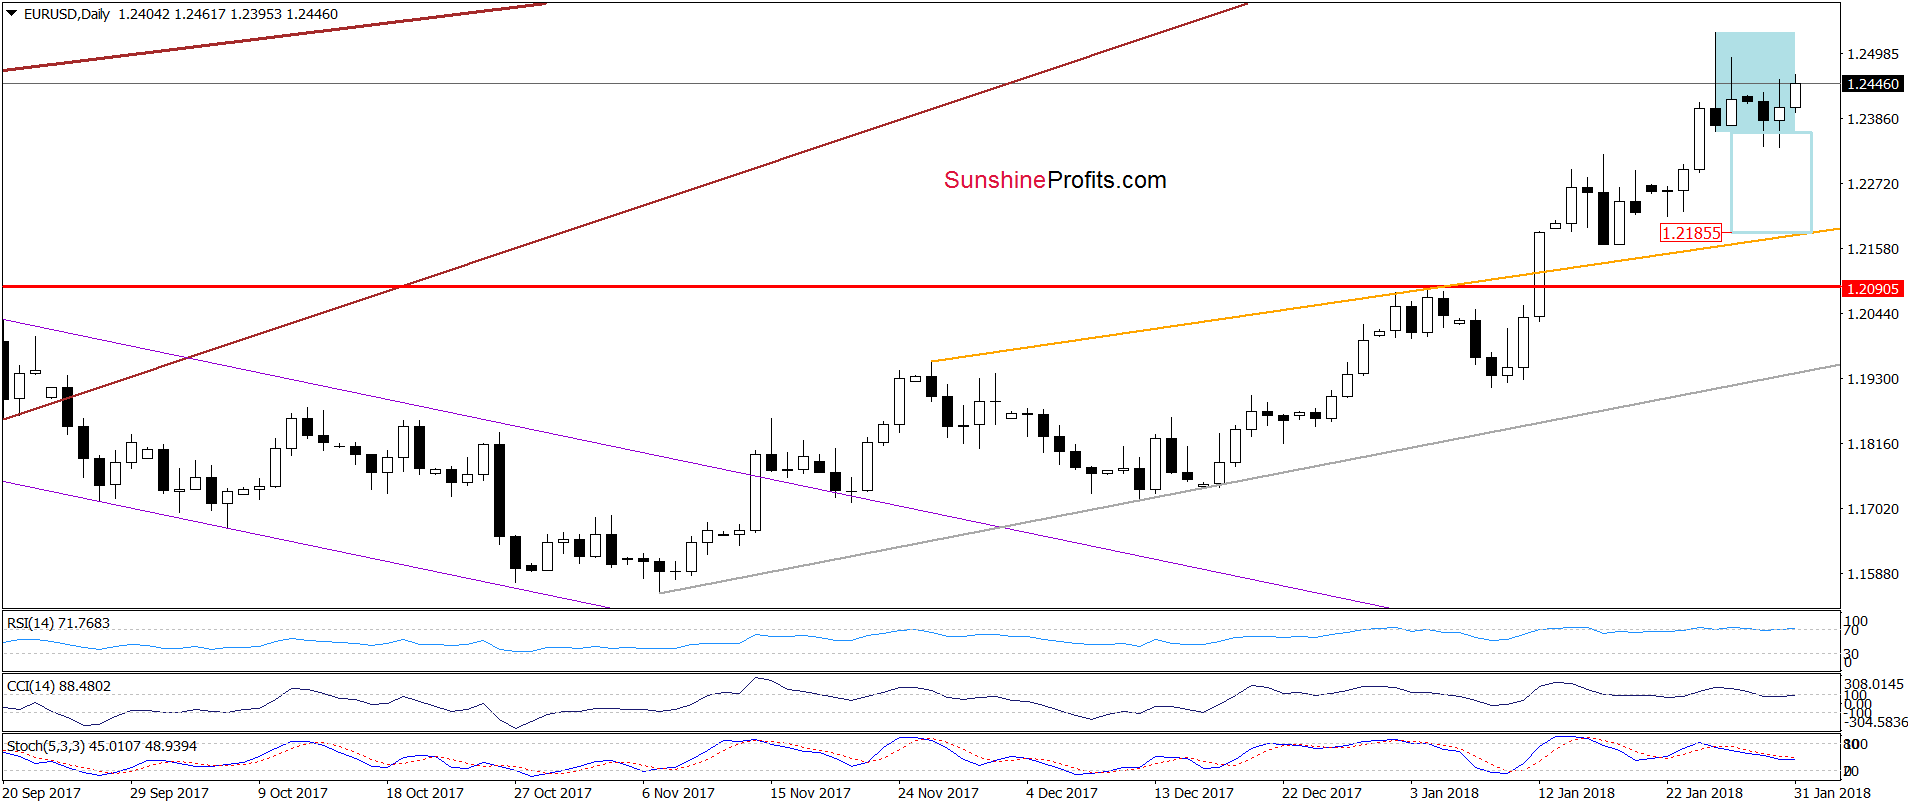
Looking at the above charts, we see that currency bulls didn’t give up and pushed EUR/USD higher earlier today. Despite this increase, the exchange rate remains in the blue consolidation and the 38.2% Fibonacci retracement based on the entire 2008-2017 downward move together with the pro-bearish candlestick formation (the shooting star) continue to block the way to higher levels.
Nevertheless, taking into account the upcoming outcome of the Federal Reserve's policy meeting (the last under the leadership of Janet Yellen) and probably greater variability, we think that it would be wise to consider the worst possible scenario for currency bears. So, what could happen if EUR/USD extends increases later in the day?
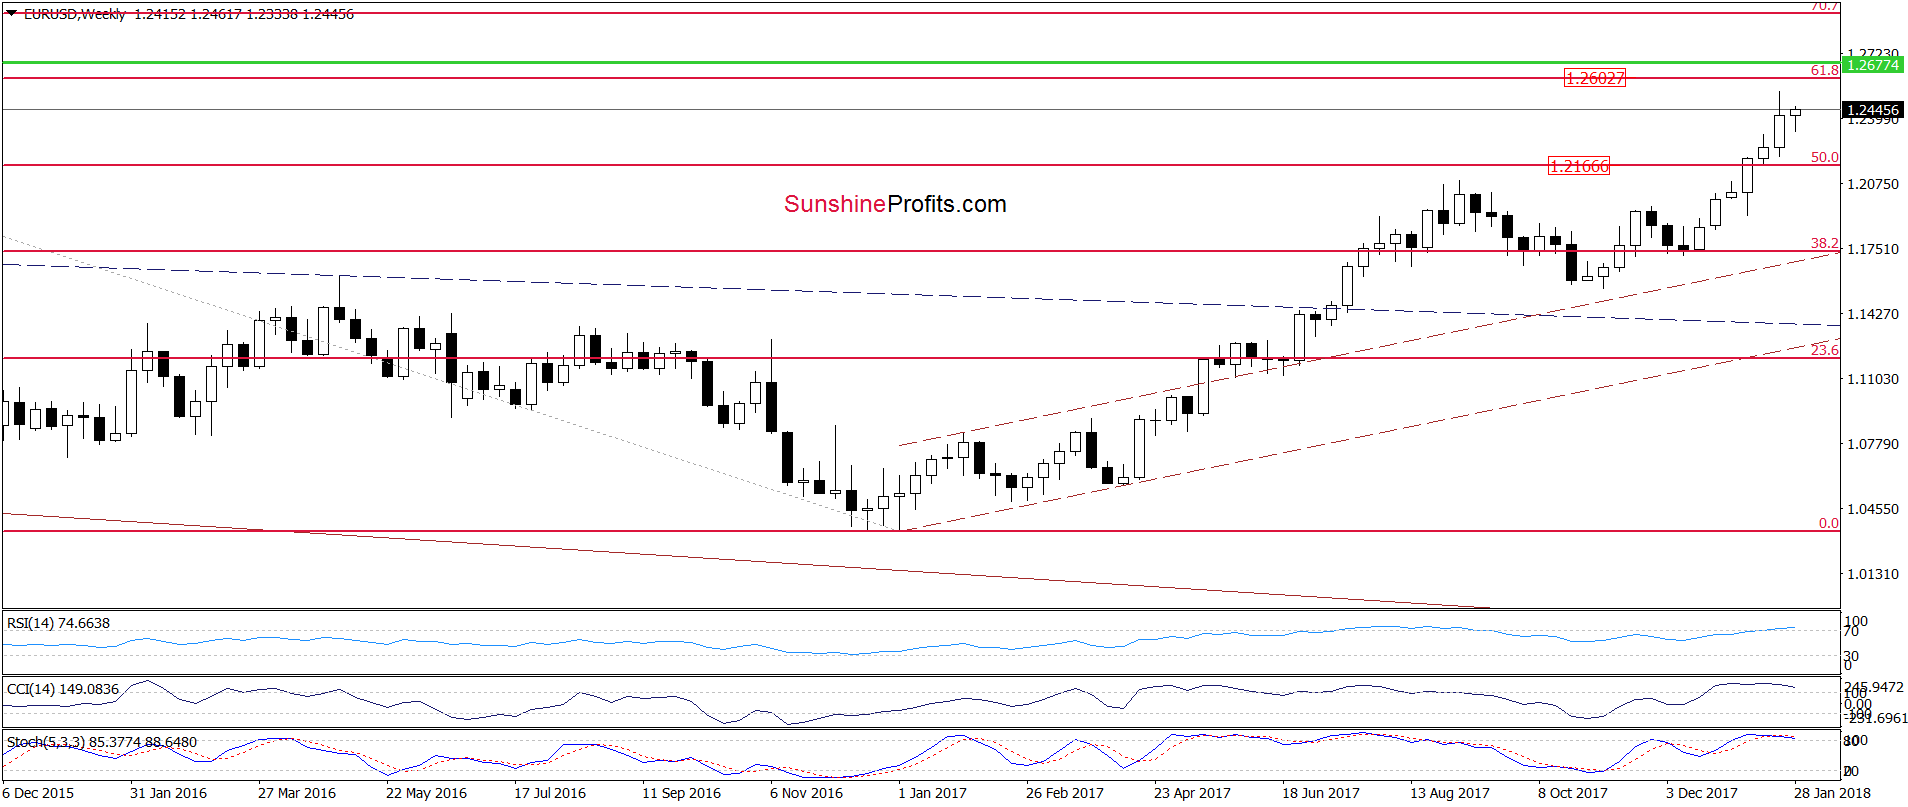
In our opinion, even if we see such price action, the space for gains seems limited as the 61.8% Fibonacci retracement marked on the weekly chart above is quite close from current levels.
However, to be more confident that our stop-loss order will not close our position during today's potential turmoil, we decided to raise it to 1.2806 (slightly above the long-term resistance line seen more clearly on the monthly chart).
Trading position (short-term; our opinion): Short positions (with a stop-loss order at 1.2806 and the initial downside target at 1.2186) are justified from the risk/reward perspective. We will keep you informed should anything change, or should we see a confirmation/invalidation of the above.
GBP/USD
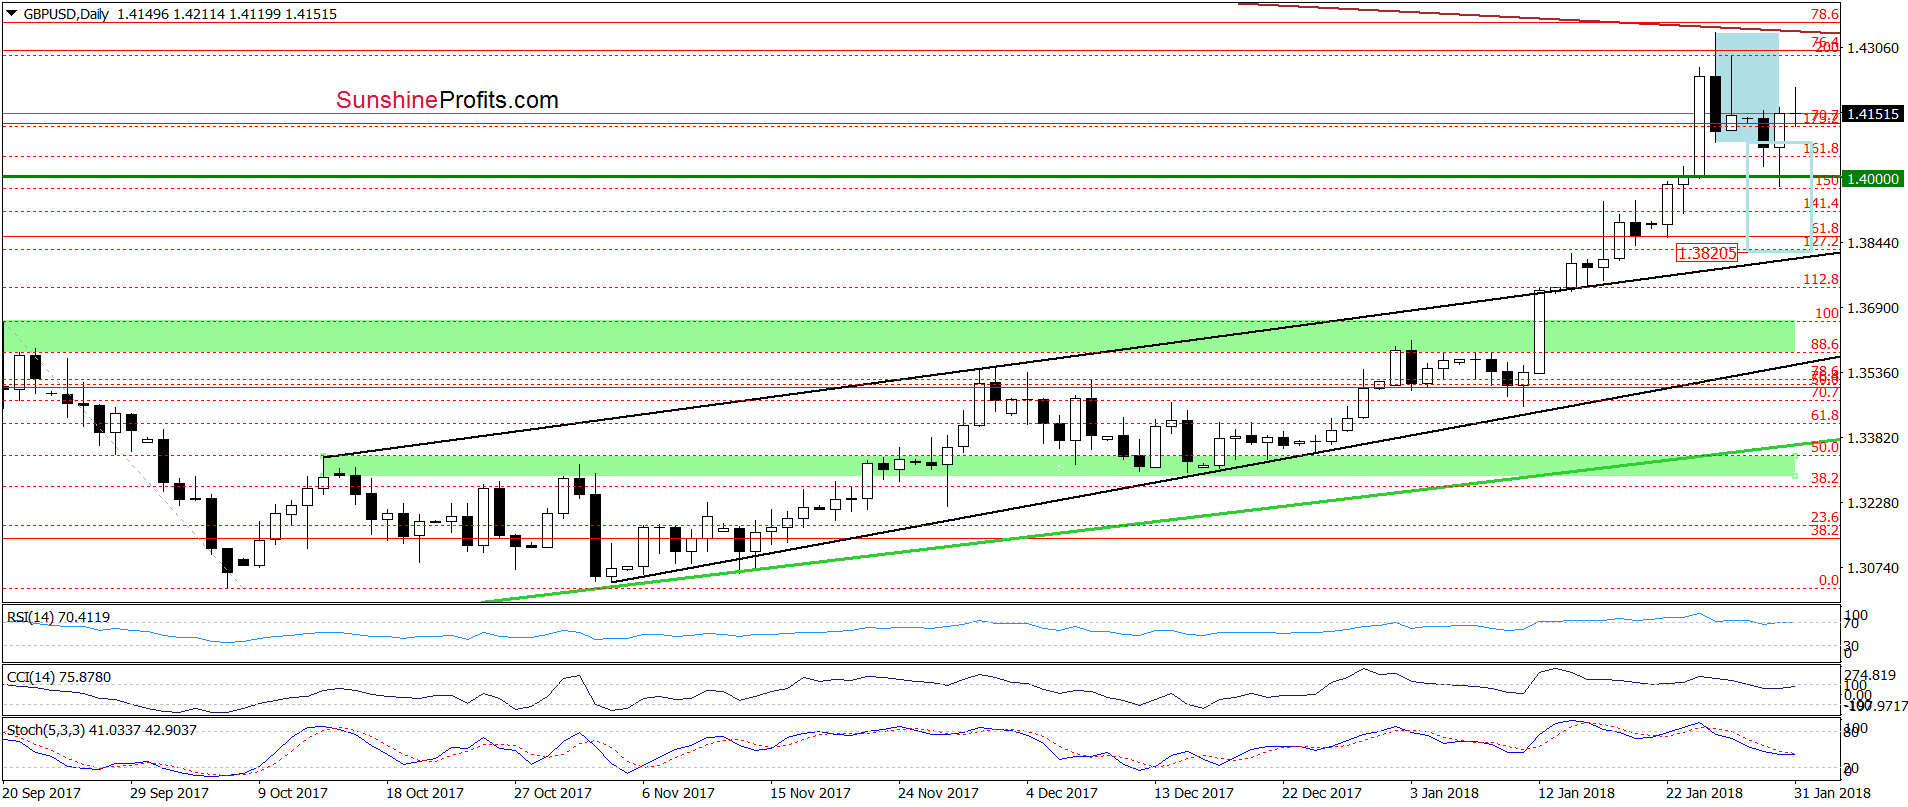
The first thing that catches the eye on the daily chart is an invalidation of the breakdown below the lower border of the blue consolidation. Usually, such price action translates into further improvement, but this time there is something important in the cards, which could stop currency bulls.
What do we mean?
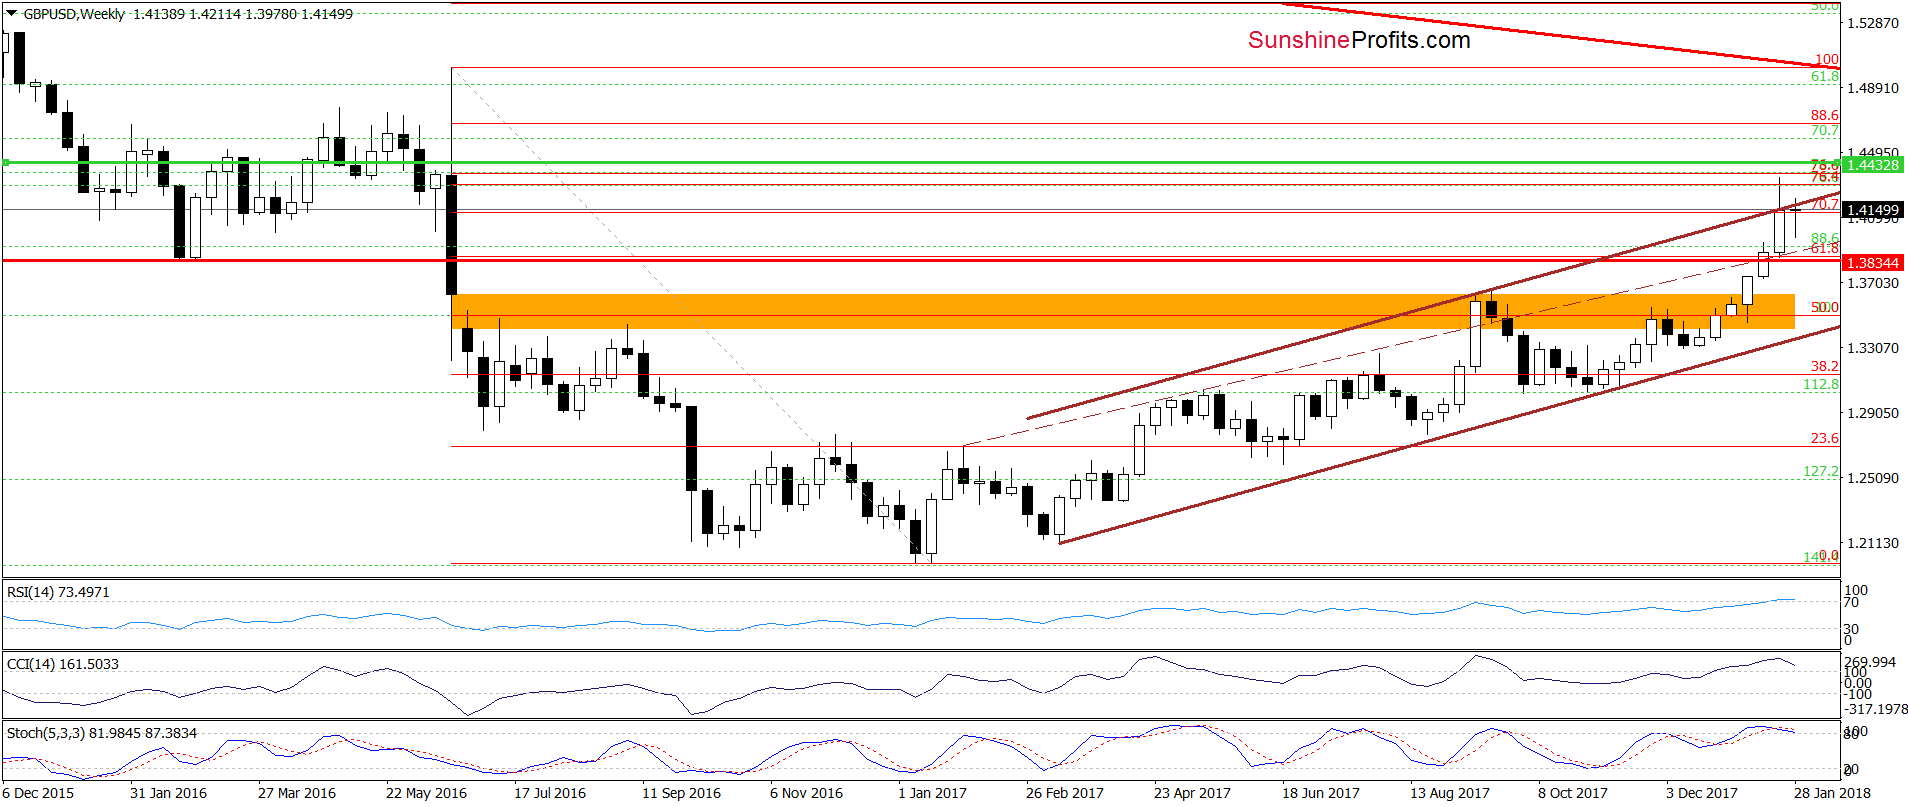
The previously-broken upper border of the brown rising trend channel. As you see on the weekly chart, the recent increase took the exchange rate to this important resistance line, which looks like a verification of the earlier breakdown.
Additionally, the current position of the daily and weekly indicators together with the pro-bearish shooting star (seen on the first chart) suggest that lower values of GBP/USD are just around the corner.
How low could GBP/USD go if we see a reversal? In our opinion, if the pair comes back under the lower border of the blue consolidation, we’ll see a drop to at least 1.3820, where the size of the downward move will correspond to the height of the formation. In this area is also the previously-broken upper line of the black rising trend channel, which could pause declines. Nevertheless, we will continue to monitor the market in the coming days and if anything invalidates our outlook we will send you an additional message.
Finishing today’s commentary on this currency pair we would like to add that we decided to raise our stop-loss order to 1.4548 ahead of today’s Fed decision.
Trading position (short-term; our opinion): Short (with a stop-loss order at 1.4548 and the initial downside target at 1.3820) are justified from the risk/reward perspective. We will keep you informed should anything change, or should we see a confirmation/invalidation of the above.
USD/JPY
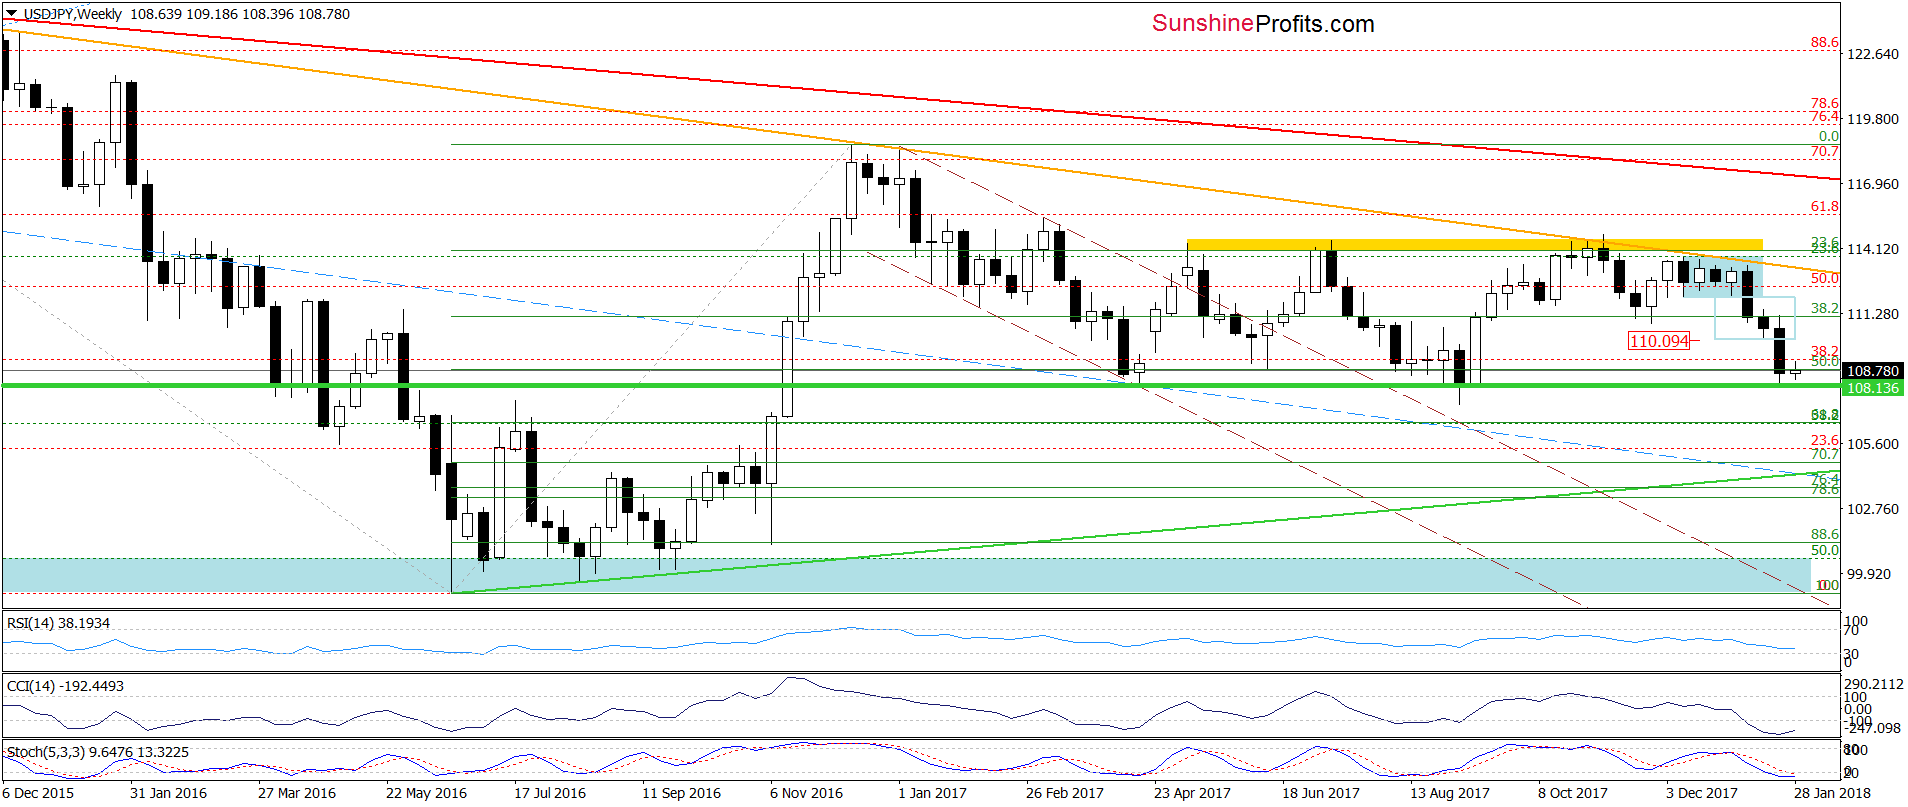
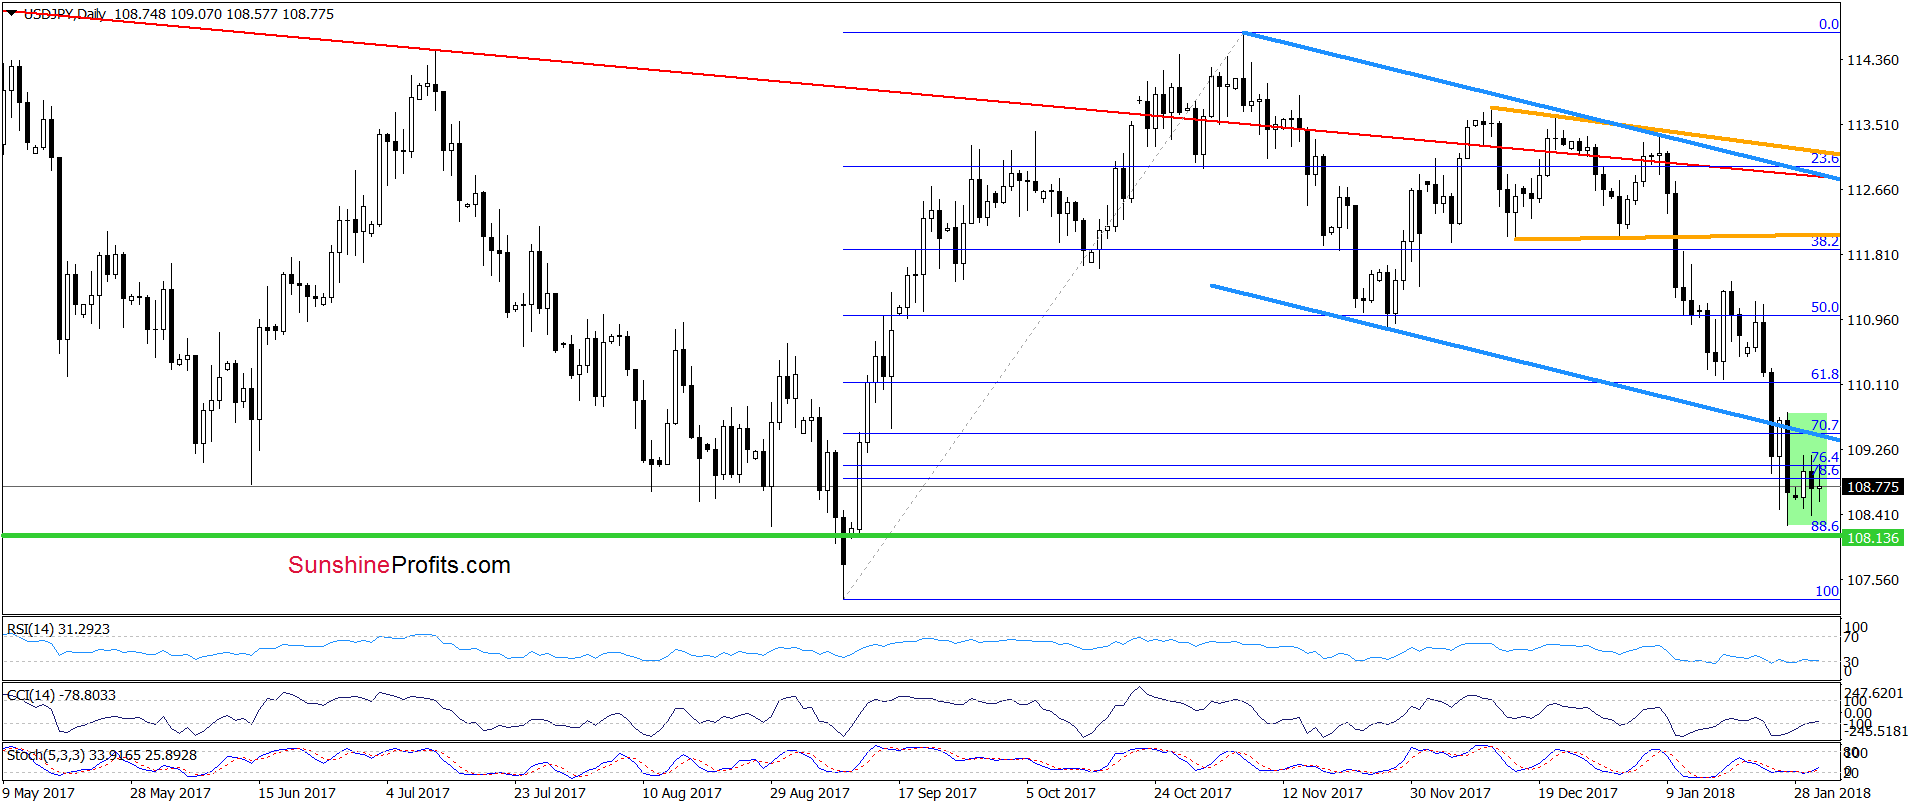
From today’s point of view, we see that the overall situation hasn’t changed much since Monday, because USD/JPY is still trading in the green consolidation between the previously-broken lower border of the blue declining trend channel and the green horizontal support line.
Such price action makes the very short-term picture a bit unclear. Nevertheless, the current position of the weekly and daily indicators (the latter generated the buy signals) suggests higher values of the exchange rate.
When can we expect a bigger move to the upside? In our opinion, it will be more likely and reliable if the pair invalidates the breakdown under the lower border of the blue declining trend channel. If we see such price action, we will likely open long positions.
Trading position (short-term; our opinion): No positions are justified from the risk/reward perspective now. We will keep you informed should anything change, or should we see a confirmation/invalidation of the above.
Thank you.
Nadia Simmons
Forex & Oil Trading Strategist
Przemyslaw Radomski, CFA
Founder, Editor-in-chief, Gold & Silver Fund Manager
Gold & Silver Trading Alerts
Forex Trading Alerts
Oil Investment Updates
Oil Trading Alerts

