

Yesterday, USD/JPY broke below important short-term support zone, but rebounded earlier today. Is this a verification of the drop below the Fibonacci retracement or something more?
In our opinion the following forex trading positions are justified - summary:
- EUR/USD: none
- GBP/USD: none
- USD/JPY: none
- USD/CAD: none
- USD/CHF: none
- AUD/USD: short (a stop-loss order at 0.8006; the initial downside target at 0.7730)
EUR/USD
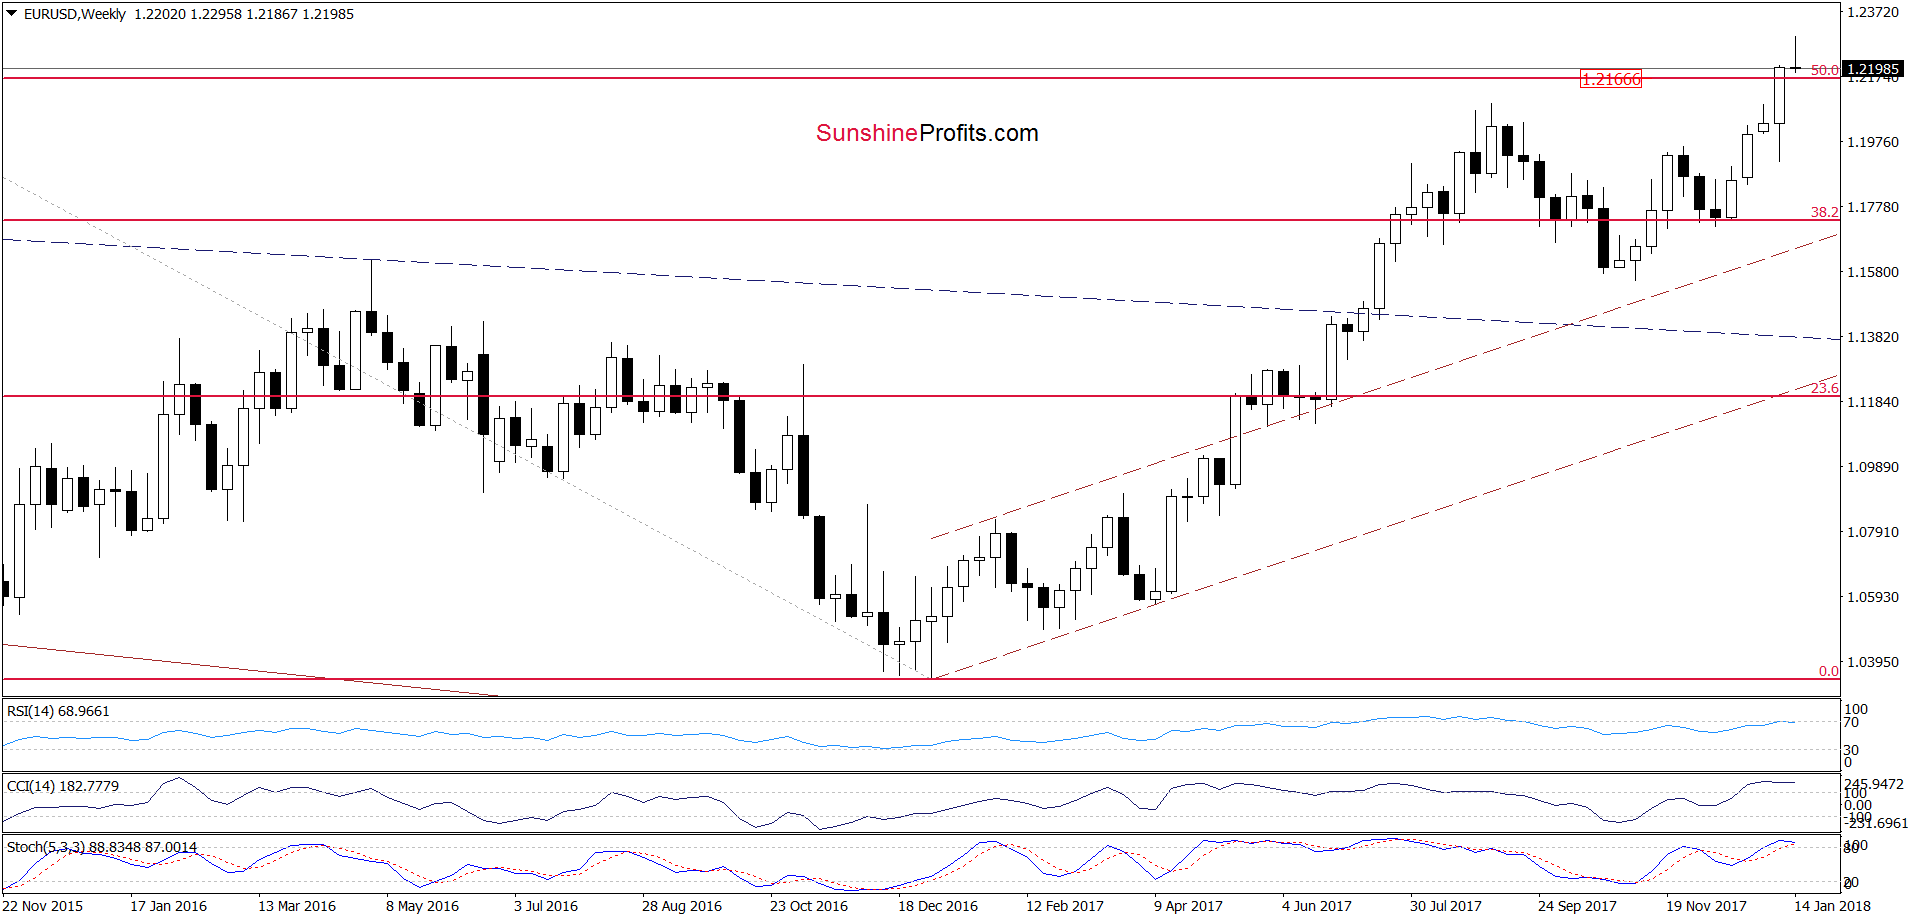
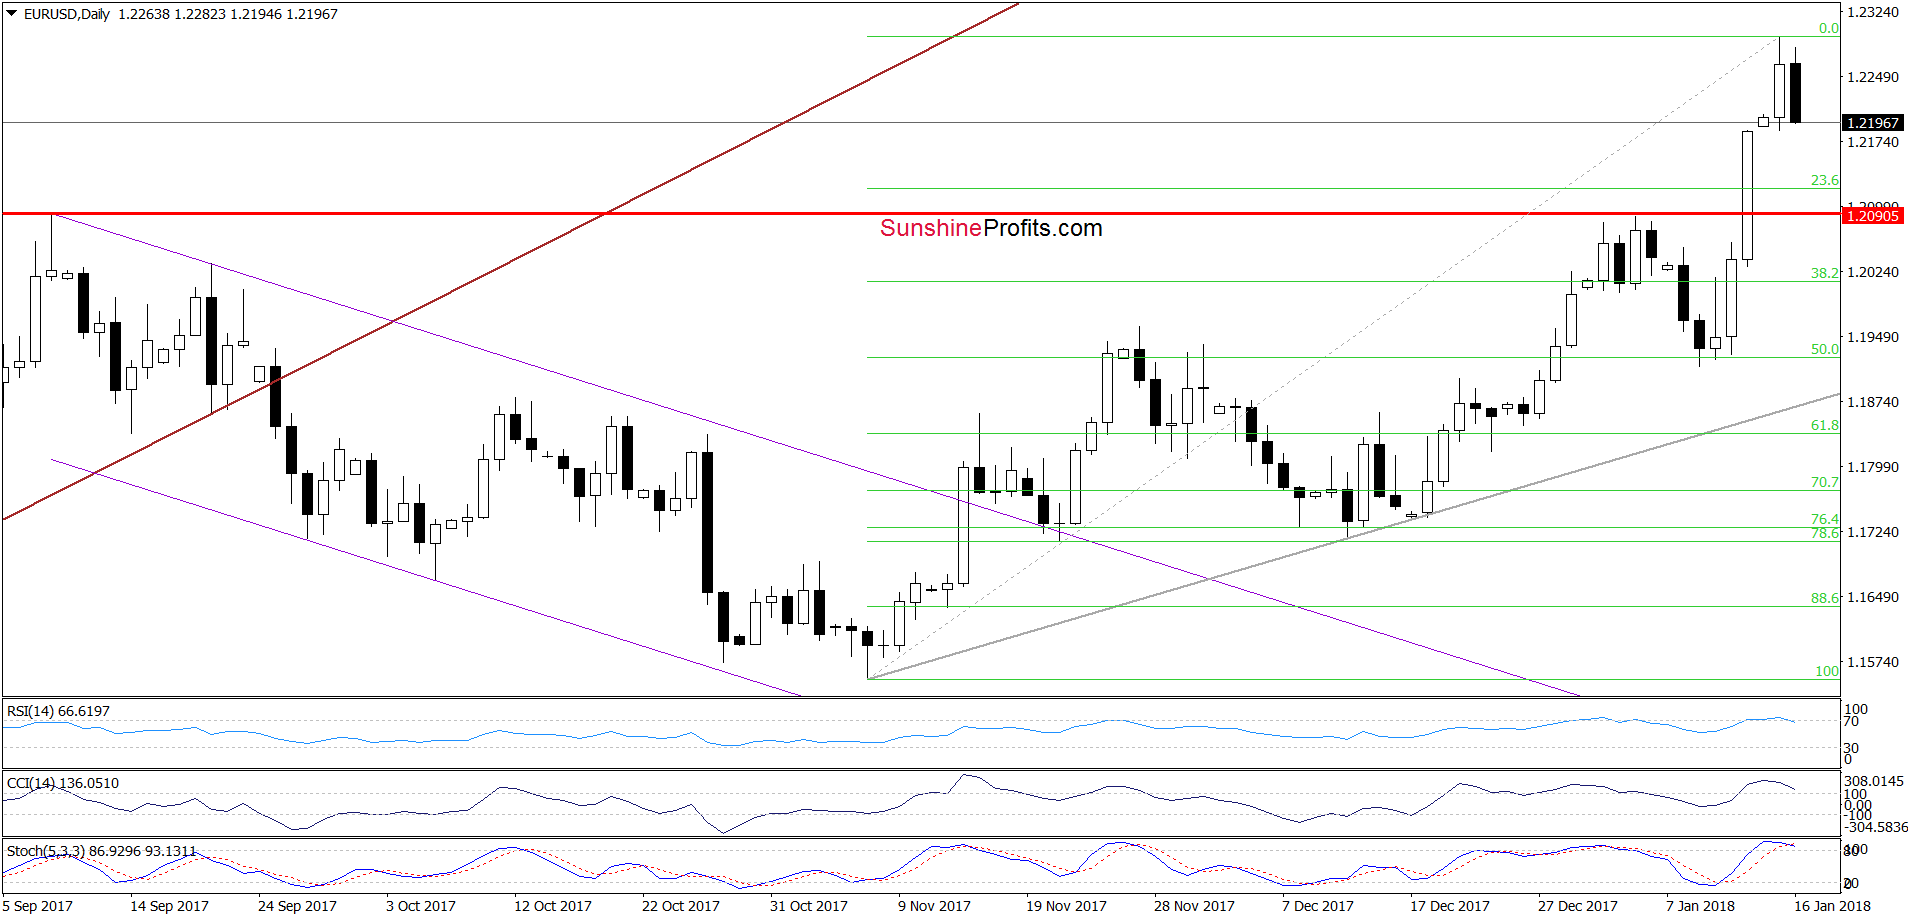
Looking at the above charts, we see that EUR/USD extended gains above the 50% Fibonacci retracement, which triggered our stop-loss order. We realize that such an unpleasant ending of the extended weekend may arouse your dissatisfaction, but the 2018 has just begun and we deeply believe that there are still many profitable transactions ahead of us.
However, returning to our charts… as you see, the pair reversed and declined earlier today, erasing almost entire yesterday’s increase, which together with the current position of the indicators suggests further deterioration.
Nevertheless, in our opinion, a bigger move to the downside will be more likely and reliable only if we see an invalidation of the breakout above the above-mentioned Fibonacci retracement. Until this time, a pullback and a verification of the breakout above the September and January 2018 highs seems to be a more credible scenario.
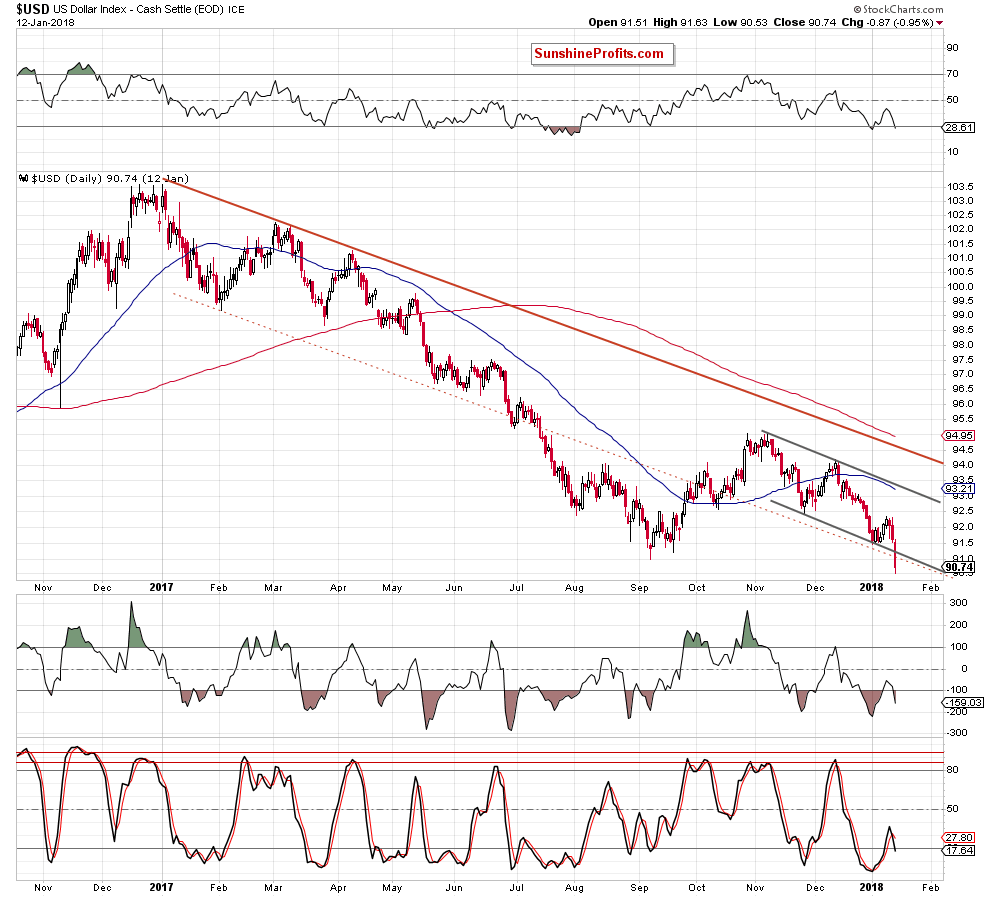
Why? Because, we think that the USD Index will verify the breakdown under the lower border of the red declining trend channel at the same time. Therefore, in our opinion, as long as there is no invalidation of the breakdown under this line (you can see it on the chart below) opening short positions in EUR/USD is not justified from the risk/reward perspective.
Trading position (short-term; our opinion): No positions are justified from the risk/reward perspective. We will keep you informed should anything change, or should we see a confirmation/invalidation of the above.
USD/JPY
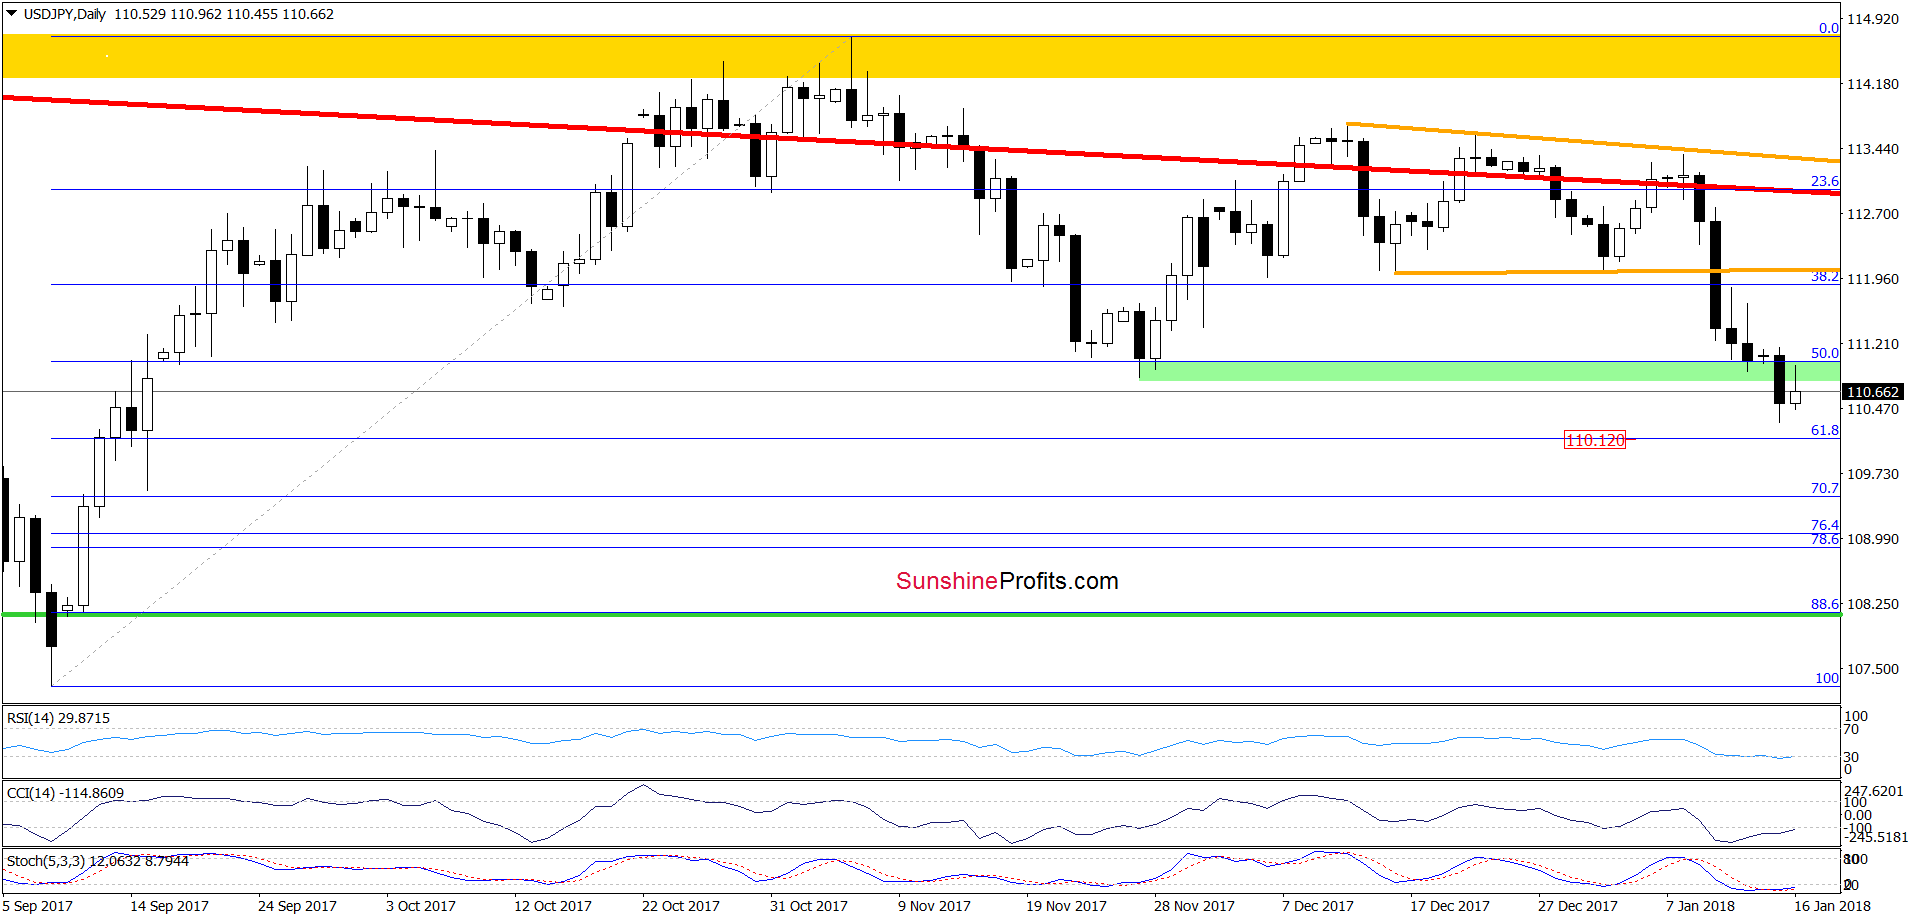
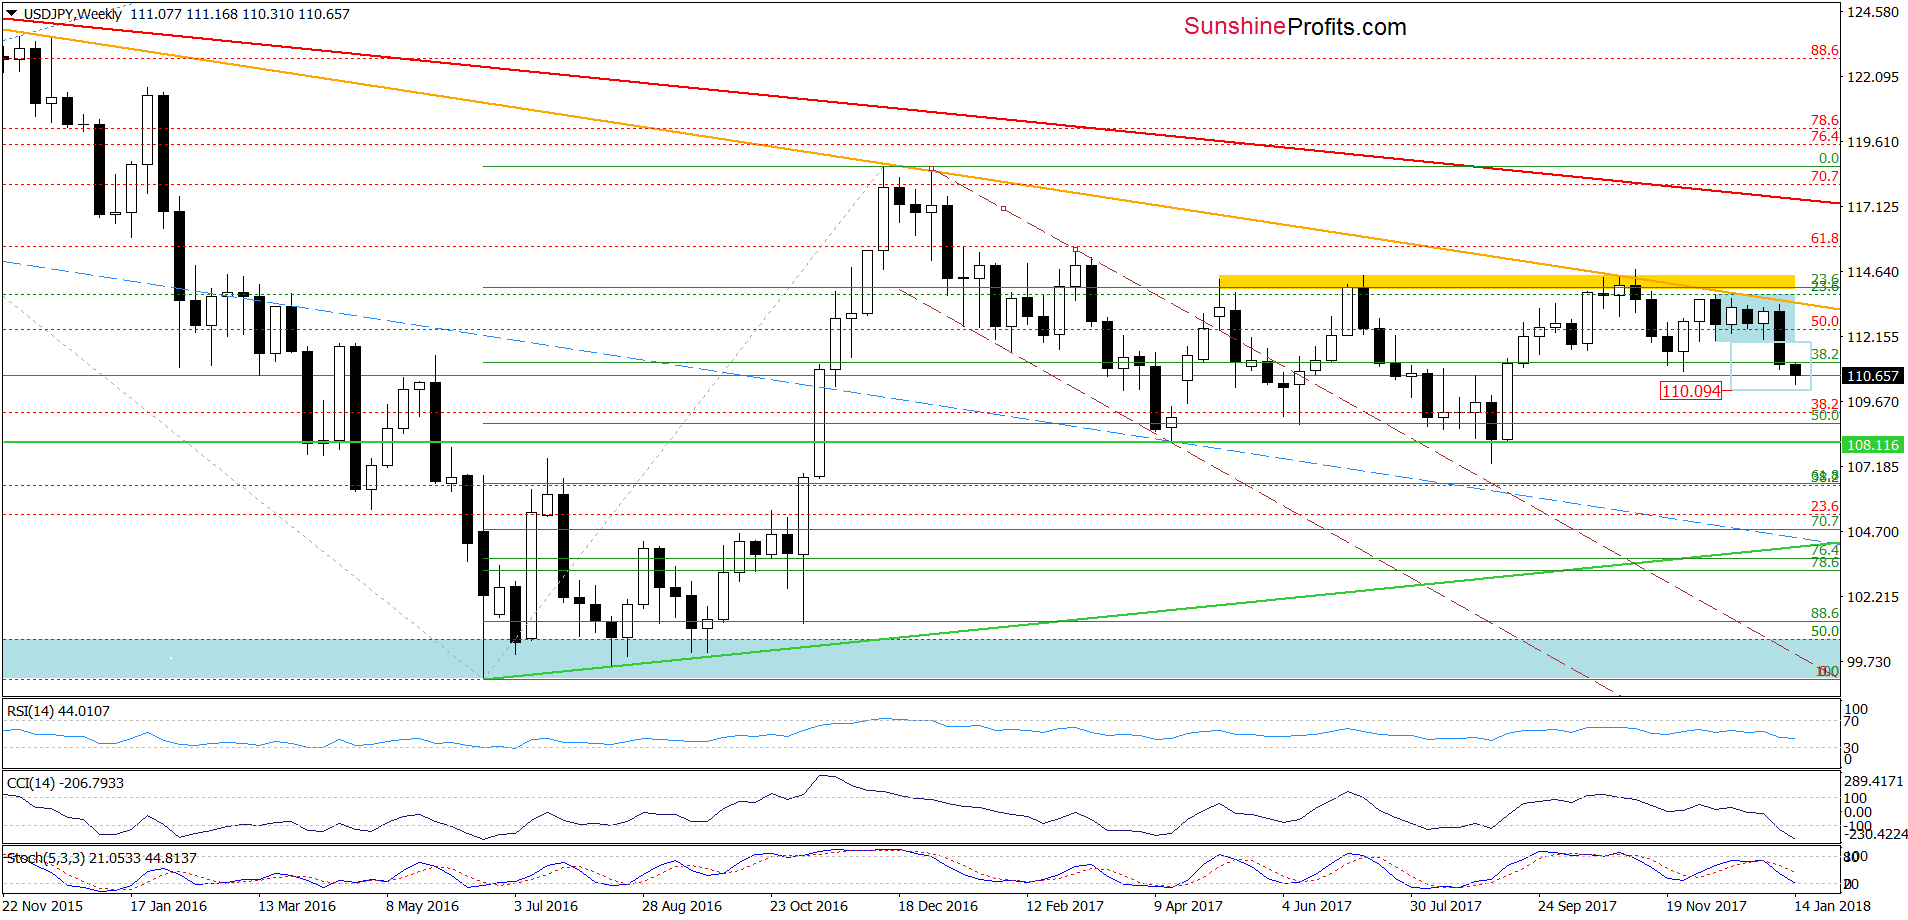
From today’s point of view, we see that USD/JPY not only tested, but also dropped under the green support zone (created by the November lows and the 50% Fibonacci retracement) yesterday. Although the pair rebounded earlier today, we think that as long as there is no invalidation of the breakdown further improvement is not likely to be seen.
Nevertheless, the current position of the indicators suggests that we may see a verification of the breakdown under the lower border of the orange wedge in the coming days (which would be in tune with the rebound in the USD index and a decline in the euro).
But did declines in the greenback are over? To be more confident about currencies’ future we’ll see the result of the battle between bulls and bears in the above-mentioned areas, which should give us more clues about the U.S. dollar next move. However, considering the entire 2018 decline in the context of the Elliott wave theory, we think that one more move to the downside in USD/JPY and a test of the 61.8% Fibonacci retracement (at 110.12) is very likely.
What’s interesting, in this area the size of the downward move will also be equal to the height of the blue consolidation marked on the weekly chart below.
Trading position (short-term; our opinion): No positions are justified from the risk/reward perspective now. We will keep you informed should anything change, or should we see a confirmation/invalidation of the above.
USD/CHF
On Thursday, we wrote the following:
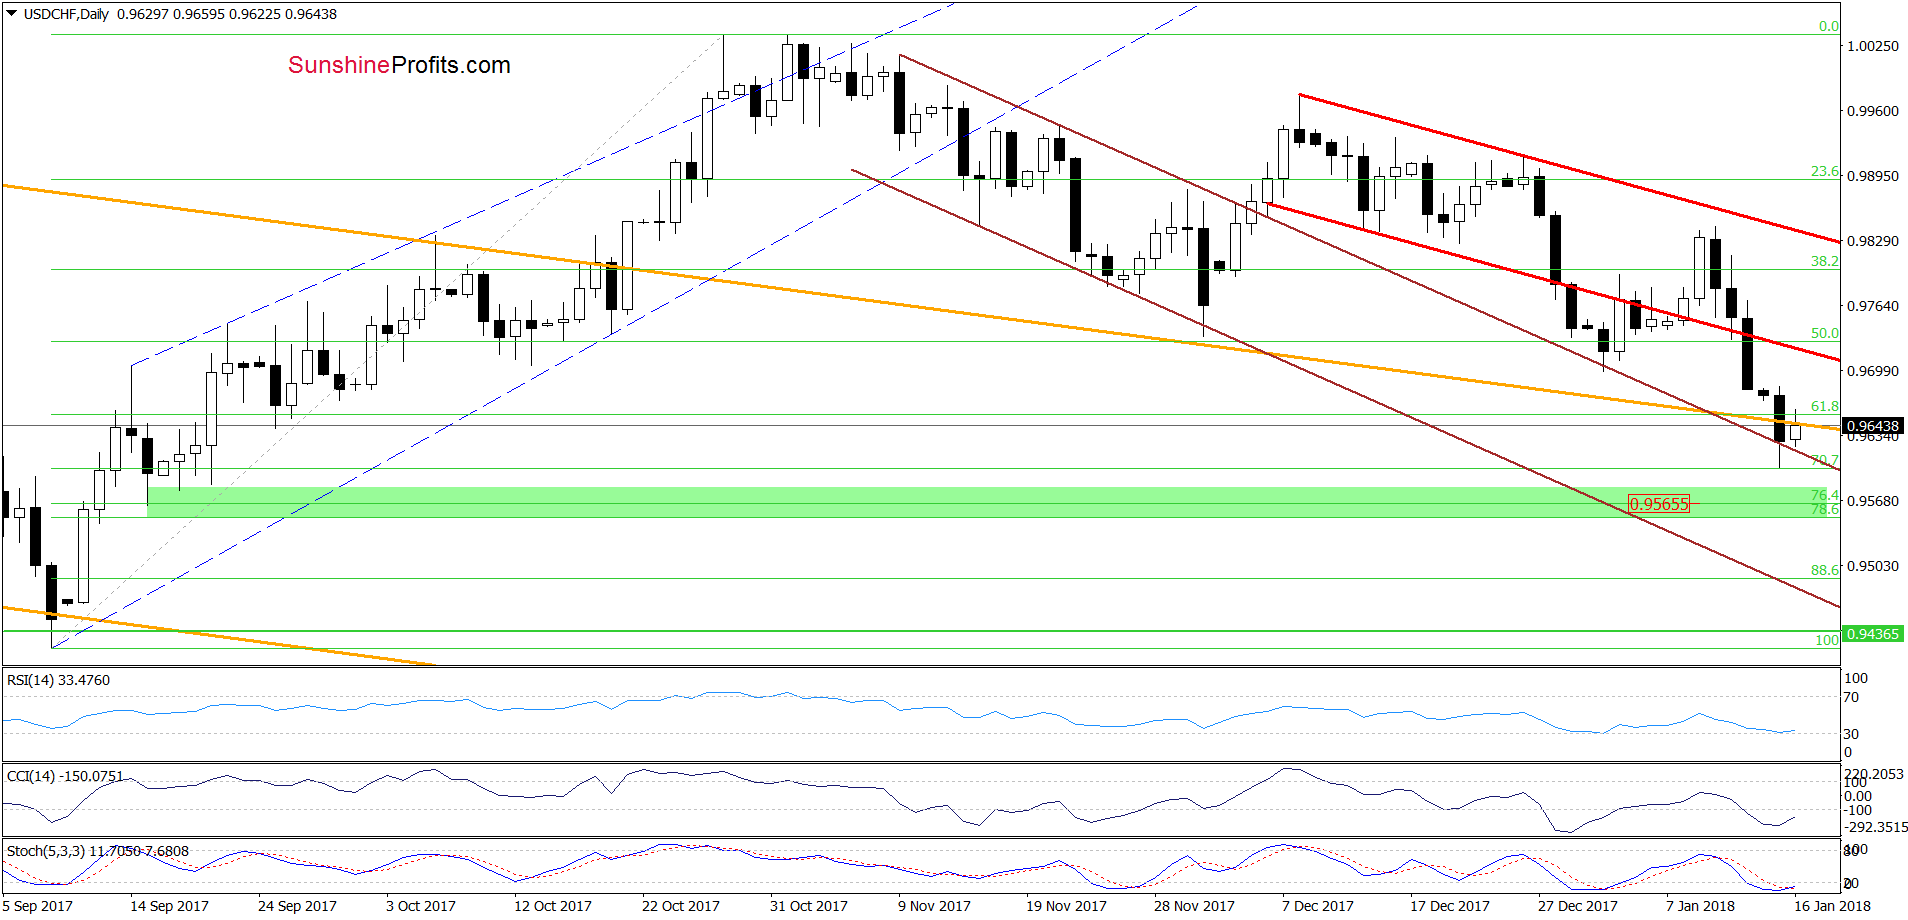
(…) USD/CHF reversed and declined sharply, reaching the previously-broken lower border of the red declining trend channel, which could pause currency bears. Nevertheless, when we take into account the fact that the Stochastic Oscillator generated the sell signal, it seems that the pair will extend declines and test the early January low or even the blue support line (the lower border of the blue declining trend channel seen on the weekly chart) in the coming days.
As you see on the daily chart, USD/CHF broke below the lower border of the red declining trend channel (as we had expected), which resulted in a drop to the previously-broken upper border of he brown declining trend channel. Thanks to this decline, the exchange rate approached the above-mentioned long-term blue line, which encouraged currency bulls to act earlier today. Additionally, the current position of he indicators suggest that we may see a verification of the breakdown under the lower line of the red channel marked on the daily chart.
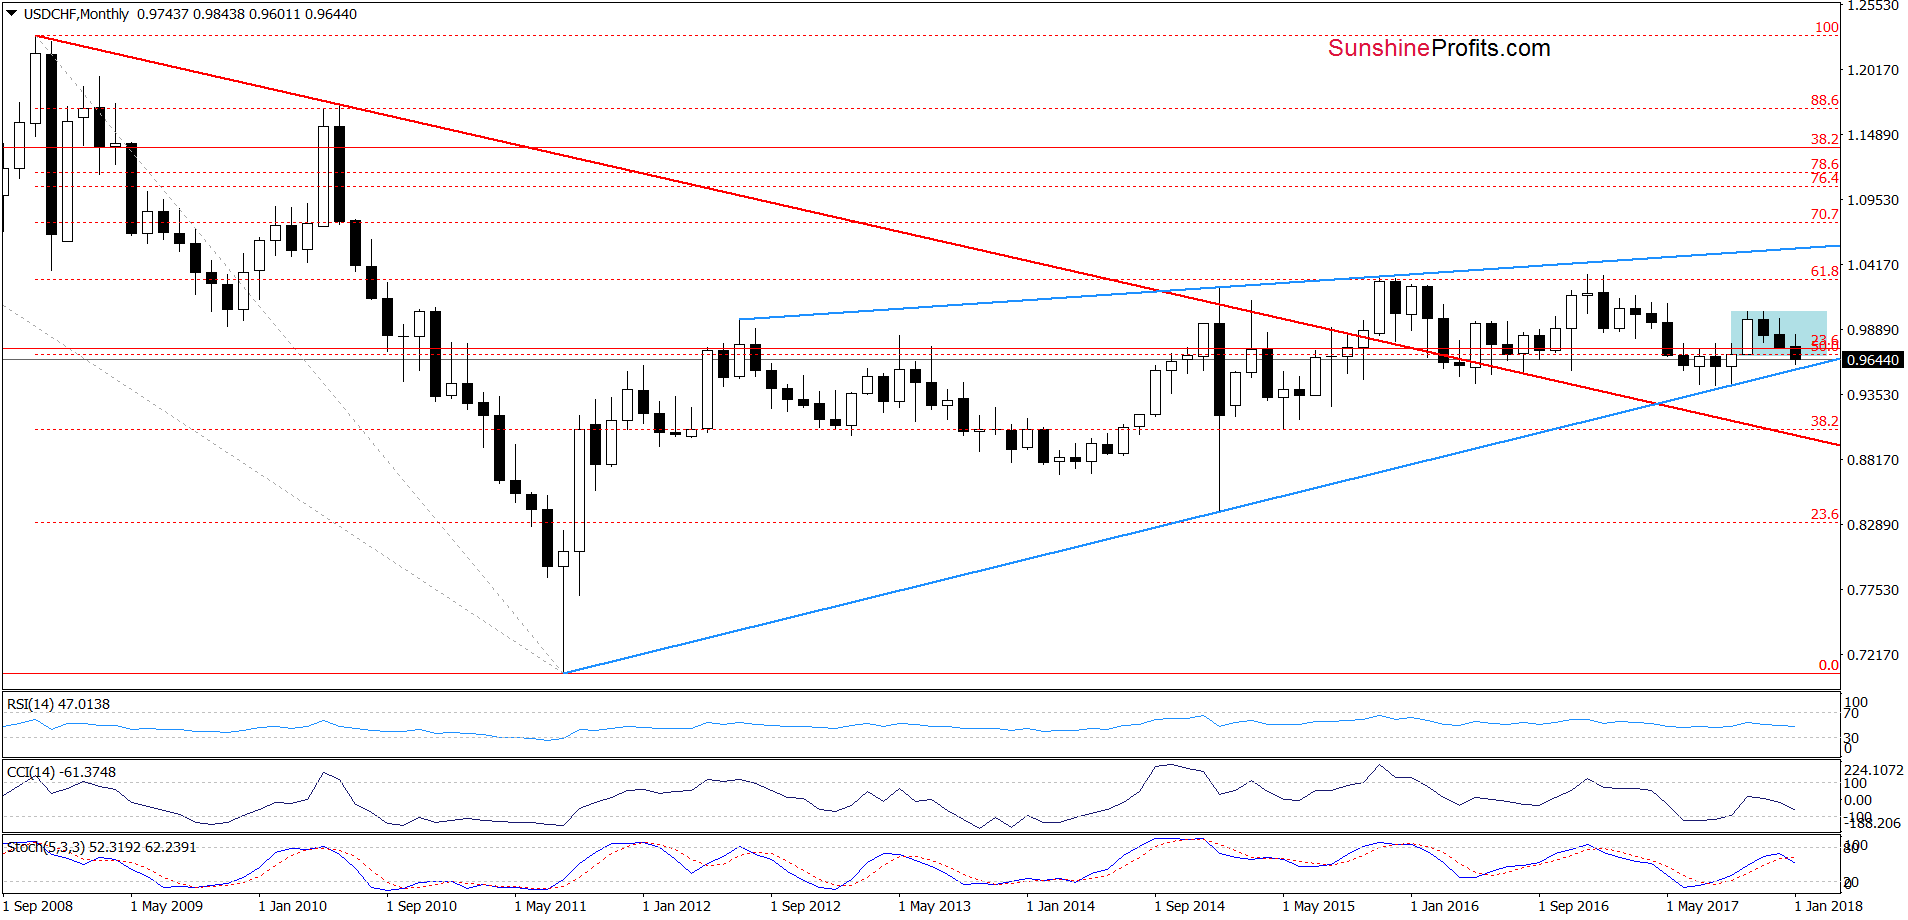
Nevertheless, similarly to what we wrote earlier in the case of USD/JPY we think that the move will be temporary and one more downswing is still ahead of us. How low could the pair go if the situation developed in line with our assumptions? We think that USD/CHF will test the green support zone seen on the daily chart, which (what’s interesting) is intersected by the above-mentioned long-term blue line (based on important lows and marked on the monthly chart below).
Trading position (short-term; our opinion): No positions are justified from the risk/reward perspective at the moment. We will keep you informed should anything change, or should we see a confirmation/invalidation of the above.
Thank you.
Nadia Simmons
Forex & Oil Trading Strategist
Przemyslaw Radomski, CFA
Founder, Editor-in-chief, Gold & Silver Fund Manager
Gold & Silver Trading Alerts
Forex Trading Alerts
Oil Investment Updates
Oil Trading Alerts

