

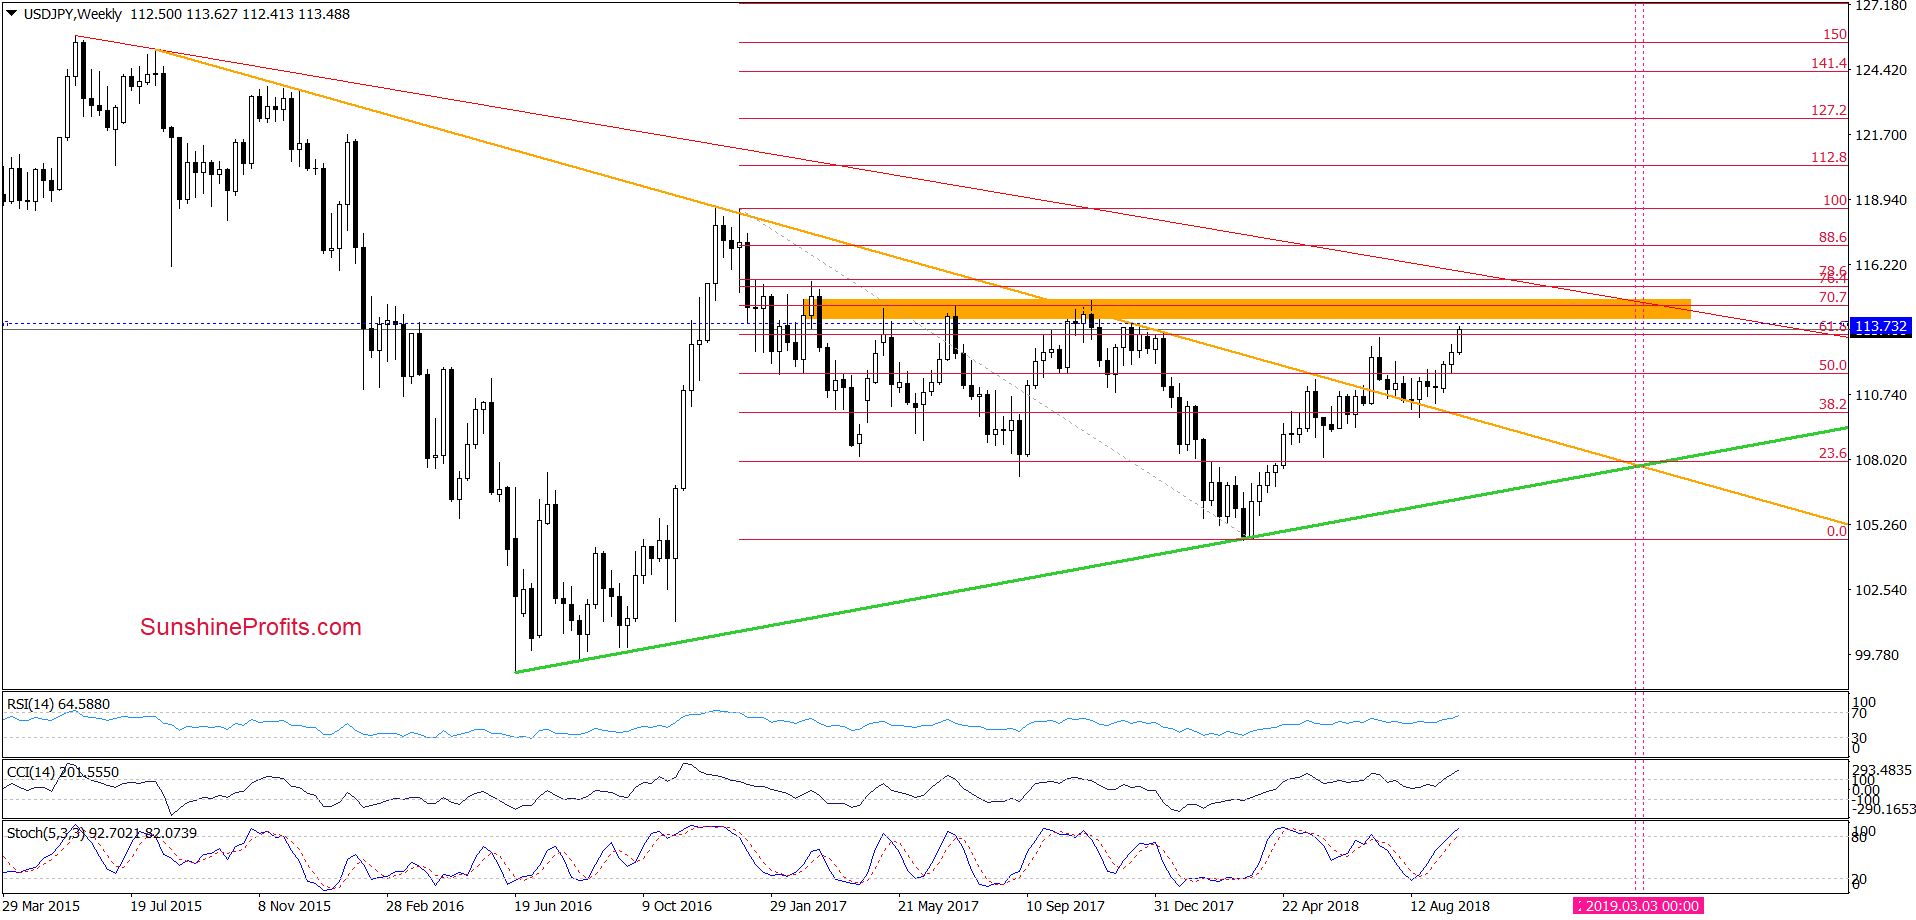
On Thursday, USD/JPY moved sharply higher, breaking not only above the upper border of the short-term rising trend channel, but also above the July peak. Bullish development? Yes. Further rally?
- EUR/USD: short (a stop-loss order at 1.1878; the initial downside target at 1.1343)
- GBP/USD: short (a stop-loss order at 1.3256; the initial downside target at 1.2923)
- USD/JPY: half of the long positions (a stop-loss order at 112.47; the next upside target at 114.03)
- USD/CAD: none
- USD/CHF: none
- AUD/USD: none
In other words, we decided to close half of our long positions and take profits off the table as USD/JPY reached our next upside target.
EUR/USD
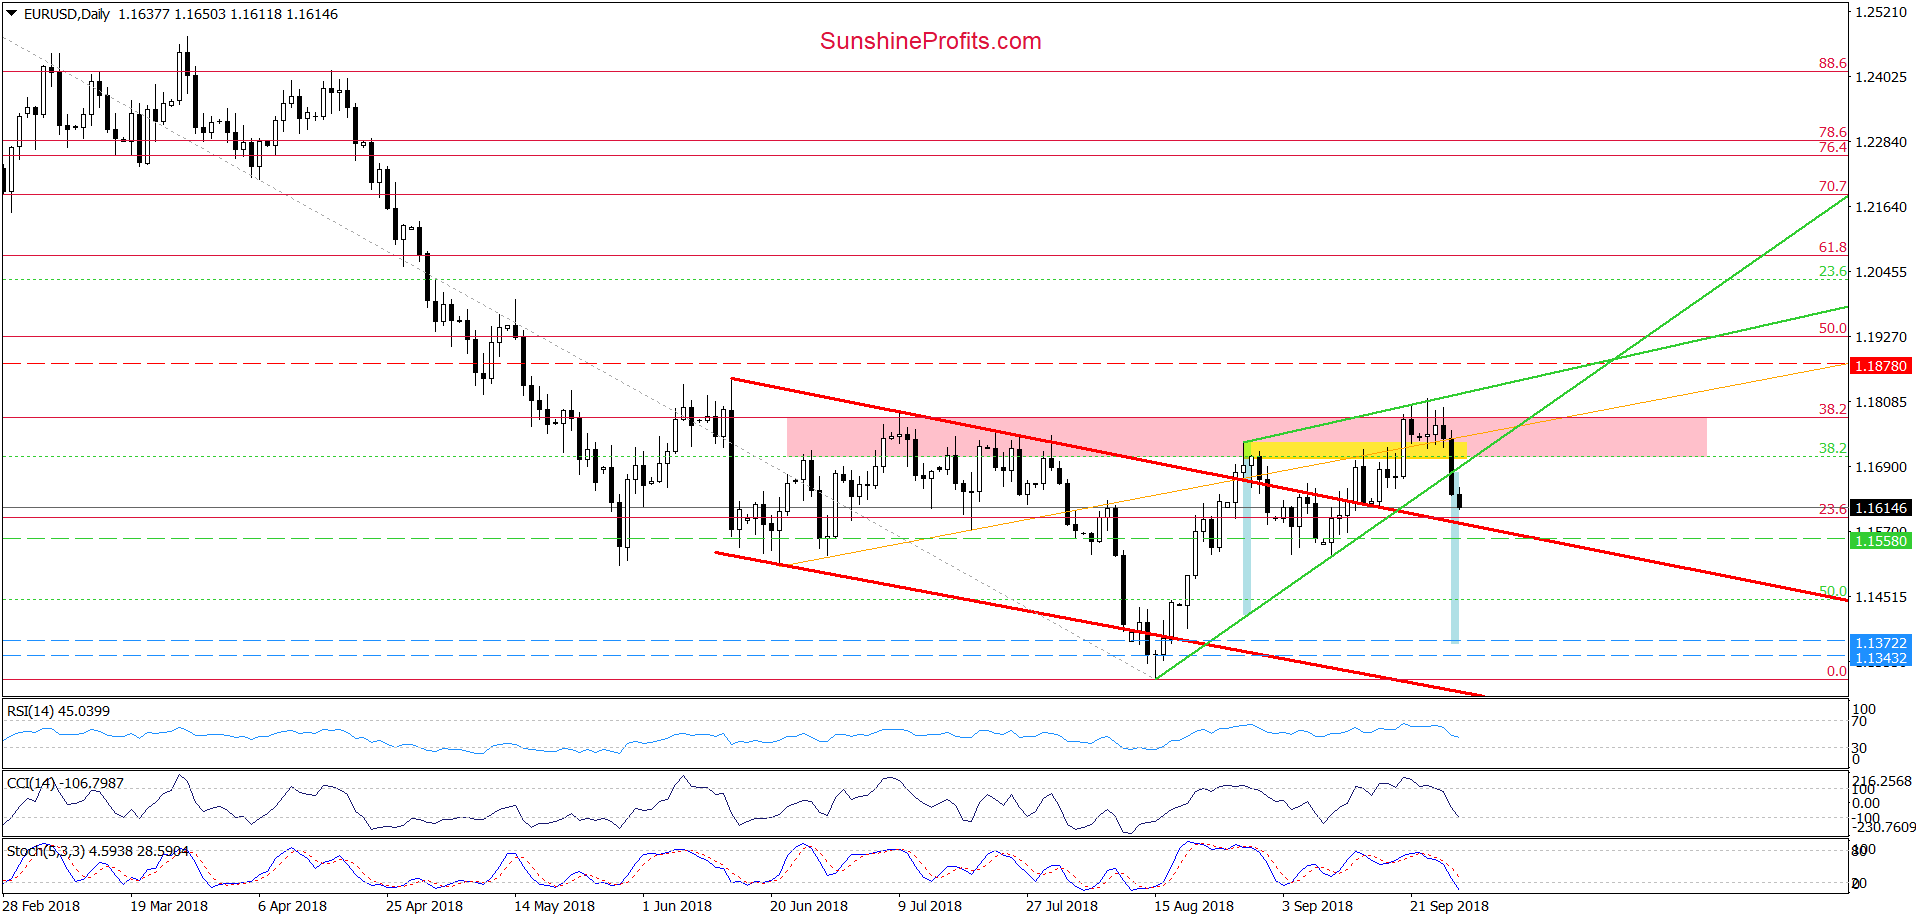
Looking at the daily chart, we see that EUR/USD moved sharply lower during yesterday’s session, which resulted in a breakdown below the green support line based on recent lows.
This bearish development triggered further deterioration earlier today, which means that the exchange rate will test the previously-broken upper border of the red declining trend channel later in the day.
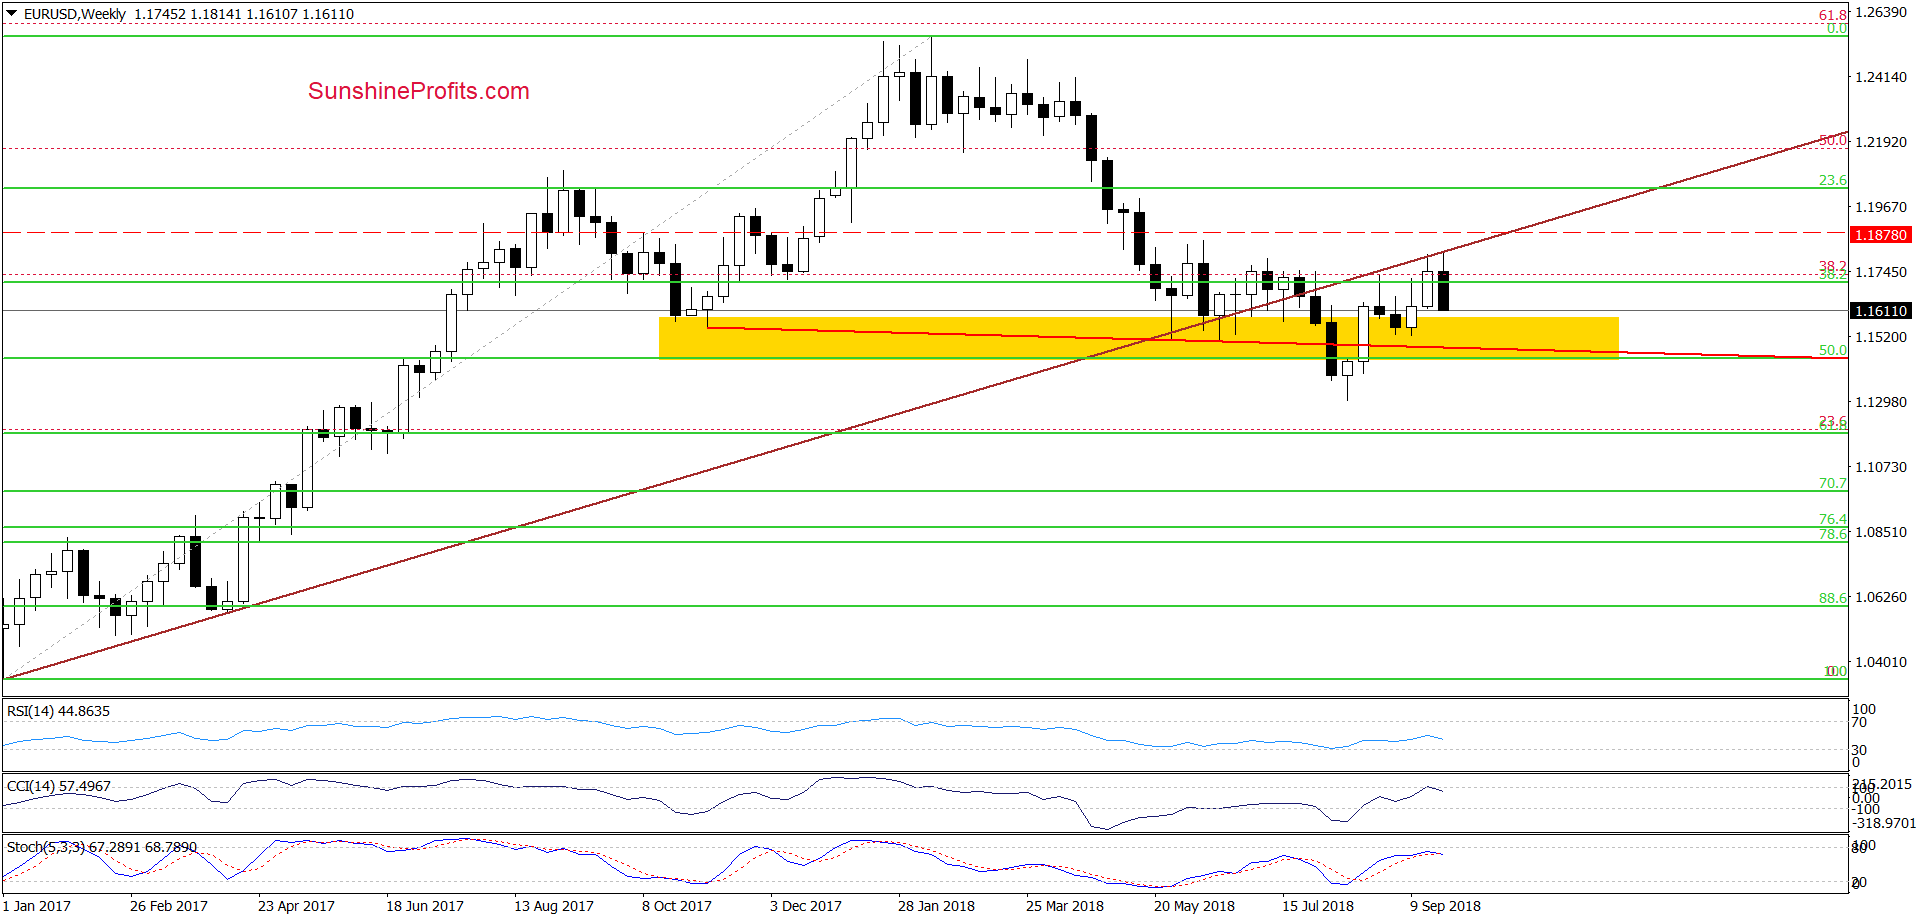
If it is broken (which is very likely, taking into account the medium-term picture (a verification of he earlier breakdown under the brown rising line) and the sell signals generated by the daily indicators), the way to September lows will be open.
Finishing today’s commentary on this currency pair, we would like to add that the upcoming downward move could reach even to around 1.1372, where the size of the move would correspond to the height of the green triangle. Therefore, we believe that short positions continue to be justified from the risk/reward perspective.
Trading position (short-term; our opinion): Short positions with a stop-loss order at 1.1878 and the initial downside target at 1.1343 are justified from the risk/reward perspective.
GBP/USD
On Wednesday, we wrote the following:
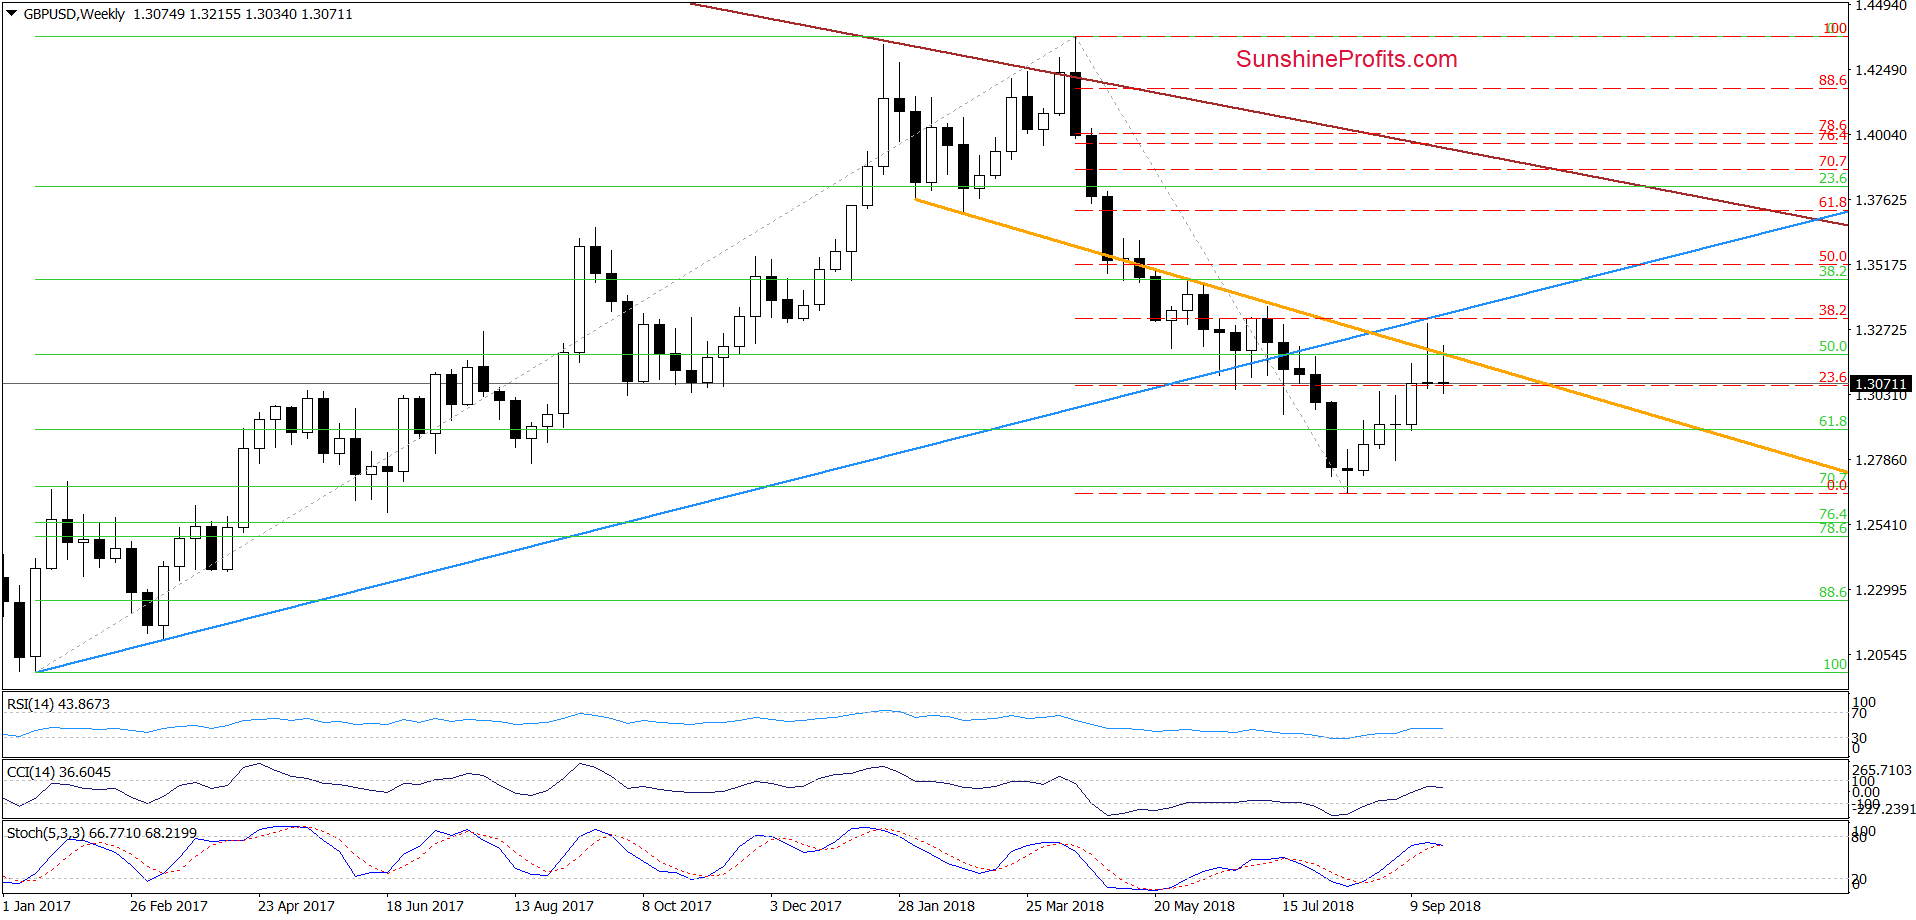
(…) despite this week’s move to the upside, GBP/USD is still trading under the previously-broken orange resistance line, which was strong enough to stop currency bull several times in the past (mainly in May and June).
(…) the buyers tried to break above it in the previous week, but the blue resistance line and the 38.2% Fibonacci retracement stopped them, triggering a sharp pullback, which took the exchange rate under the orange line.
Therefore, in our opinion, as long as there is no successful breakout above these resistances, lower values of GBP/USD are more likely than sizable move to the north.
On the above chart, we see that the situation developed in line with the above scenario and currency bears took GBP/USD lower once again.
How did this price action affect the very short-term chart? Let’s check.
In our last commentary on this currency pair, we wrote:
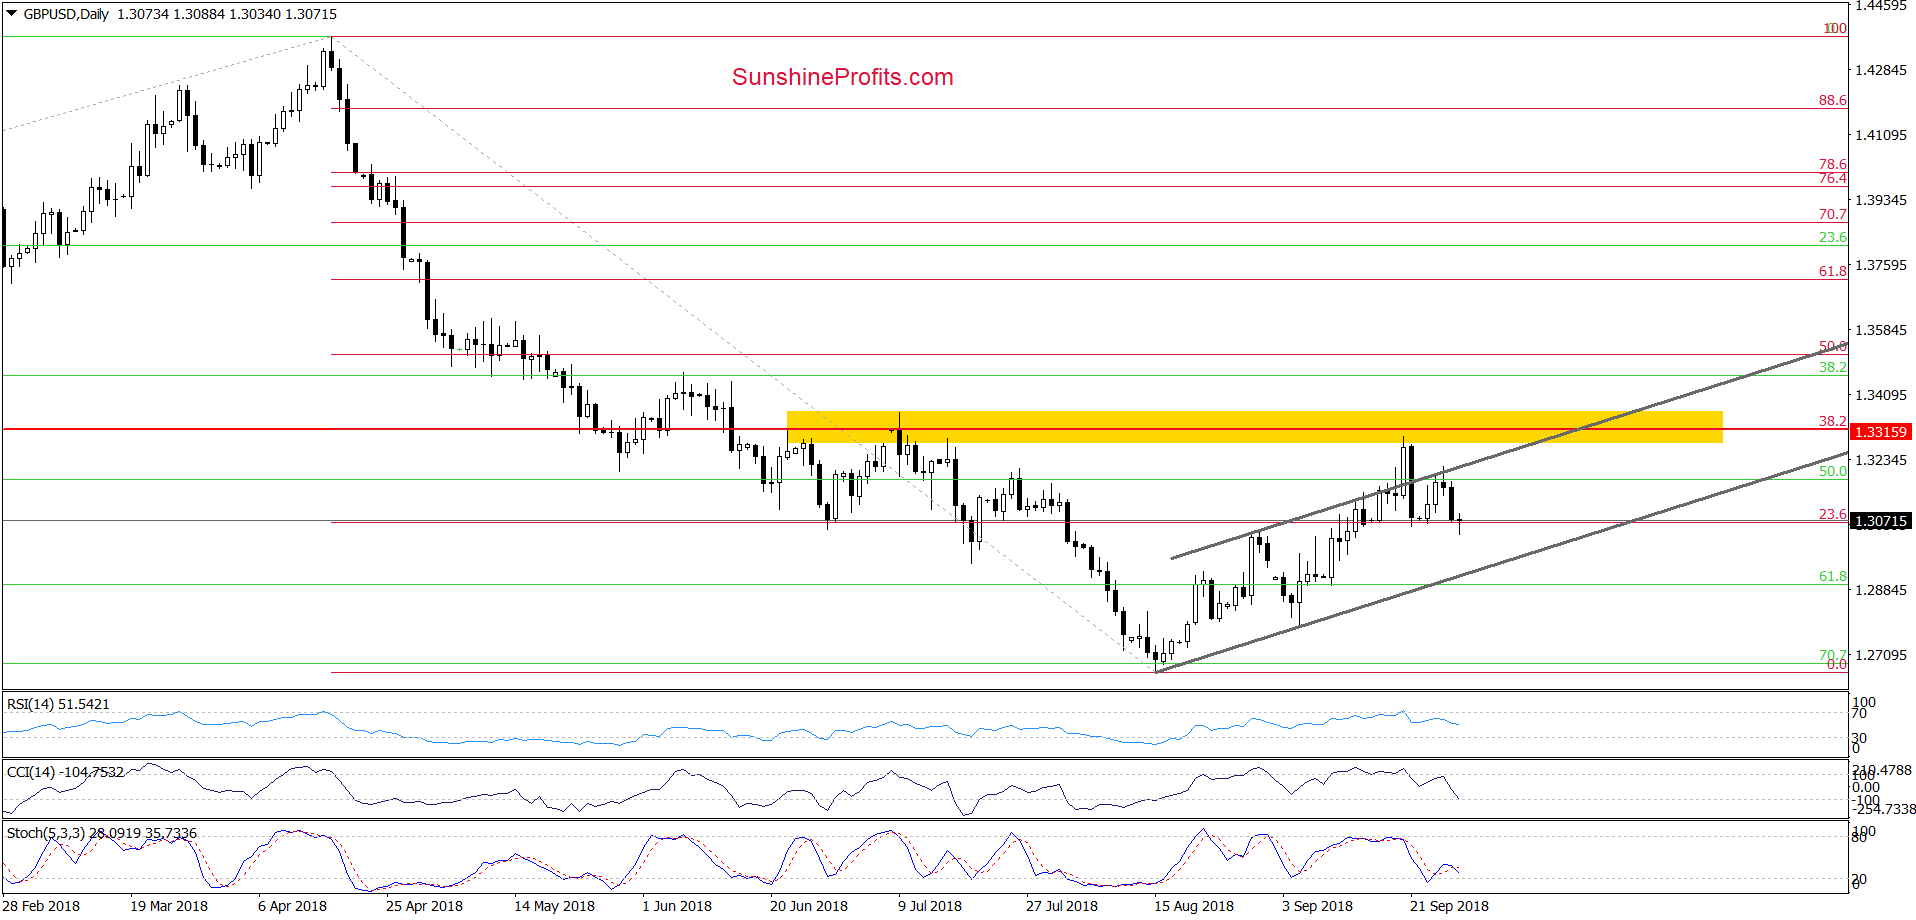
(…) GBP/USD bounced off the last week’s lows and came back to the previously-broken upper border of the grey rising trend channel, which looks like a verification of Thursday breakdown under this line.
If this is the case and currency bulls show weakness in this area, we’ll see another attempt to go lower in the very near future. Additionally, if the pair breaks under the Friday low, the way to the lower border of the grey trend channel will be open and we’ll likely open short positions. (…)
From this perspective, we see that currency bulls failed, and the pair slipped to the Friday low earlier today. Additionally, the Stochastic Oscillator re-generated the sell signal, increasing the likelihood of further deterioration and a drop to the above-mentioned downside target.
Therefore, we think that opening short positions is justified at the moment (all needed details below). At this point, please note that if the lower line of the trend channel is broken, GBP/USD could test September low or even mid-August lows in the following days. We will keep you informed should anything change, or should we see a confirmation/invalidation of the above.
Trading position (short-term; our opinion): Short positions with a stop-loss order at 1.3256 and the initial downside target at 1.2923 are justified from the risk/reward perspective.
USD/JPY
Quoting our last commentary on this currency pair:
(…) the exchange rate is still trading above the very short-term black dashed support line based on the September lows, which means that as long as there is no daily closure under these supports one more upswing and a test of July peak is very likely.
From today’s point of view, we see that currency bulls not only tested the July peak, but also took USD/JPY above this resistance during yesterday’s session, making our long positions even more profitable.
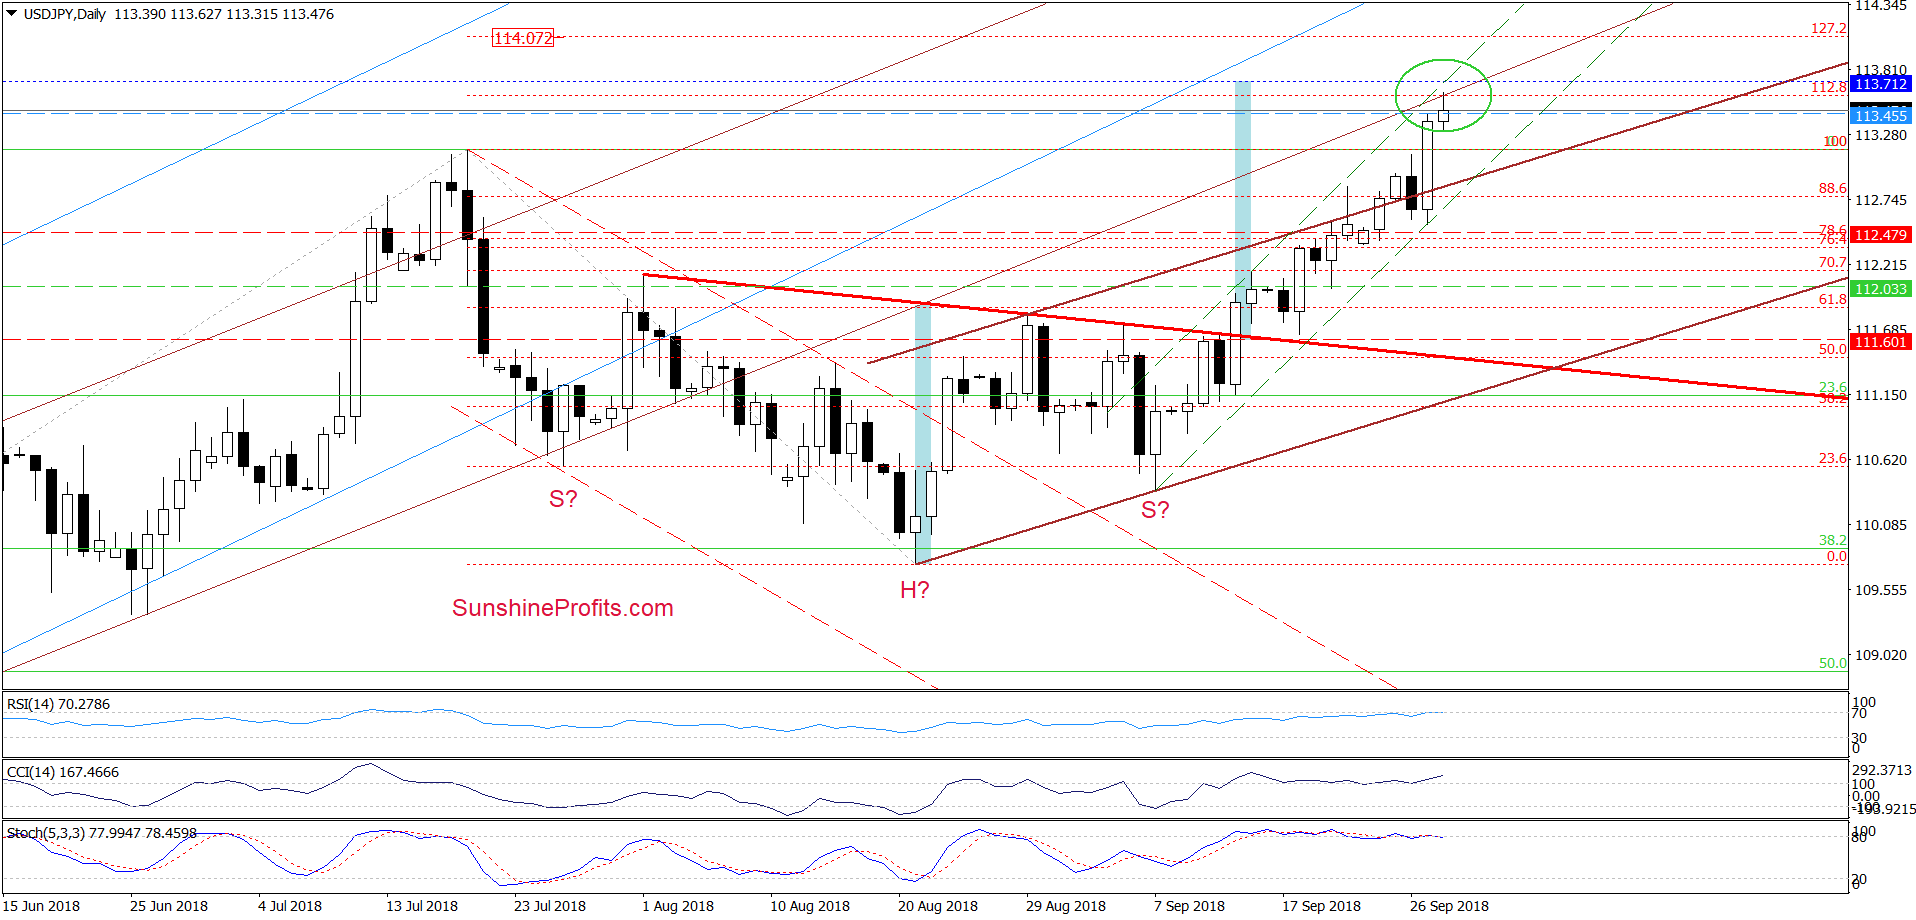
Earlier today, the exchange rate extended gains, reaching our next upside target. Thanks to this move, the pair also climbed to the 112.8% Fibonacci extension, the previously-broken lower border of the brown rising trend channel and approached the upper border of the very short-term black rising trend channel (marked with dashed lines).
Additionally, slightly above today’s intraday high, the size of the upward move will correspond to the height of the reverse head and shoulders formation, which could encourage some currency bulls to take profits off the table.
So, what’s next for the pair?
On one hand, the combination of the above-mentioned factors in combination with the current position of the daily indicators suggests that reversal and correction may be just around the corner. On the other hand, “the trend is still our friend” as USD/JPY broke above the previous important peak and remains above the upper line of the rising trend channel.
Taking all the above into account, we decided to close half of our long positions (as a reminder, we opened them when USD/JPY was trading at around 112) and take profits off the table.
And what about the other half of the position?
In our opinion, the best solution for this moment is to raise the stop-loss level to 112.47, because even if a strong pullback would trigger its activation, the remaining part of the position will also be closed with a profit. At this point, it is also worth noting that we decided to move our upside target to 114.03, which is slightly below 127.2% Fibonacci extension.
Trading position (short-term; our opinion): half of already existing profitable long positions (with a stop-loss order at 112.47 and the next upside target at 114.03) are justified from the risk/reward perspective.
Thank you.
Nadia Simmons
Forex & Oil Trading Strategist
Przemyslaw Radomski, CFA
Founder, Editor-in-chief, Gold & Silver Fund Manager
Gold & Silver Trading Alerts
Forex Trading Alerts
Oil Investment Updates
Oil Trading Alerts

