

On Friday, currency bulls showed that they still have the strength to fight for higher levels, which approached USD/JPY to the resistance area created by the July peaks. Are they strong enough to push the exchange rate higher once again?
- EUR/USD: short (a stop-loss order at 1.1878; the initial downside target at 1.1343)
- GBP/USD: none
- USD/JPY: long (a stop-loss order at 111.37; the initial upside target at 112.88)
- USD/CAD: none
- USD/CHF: none
- AUD/USD: none
EUR/USD
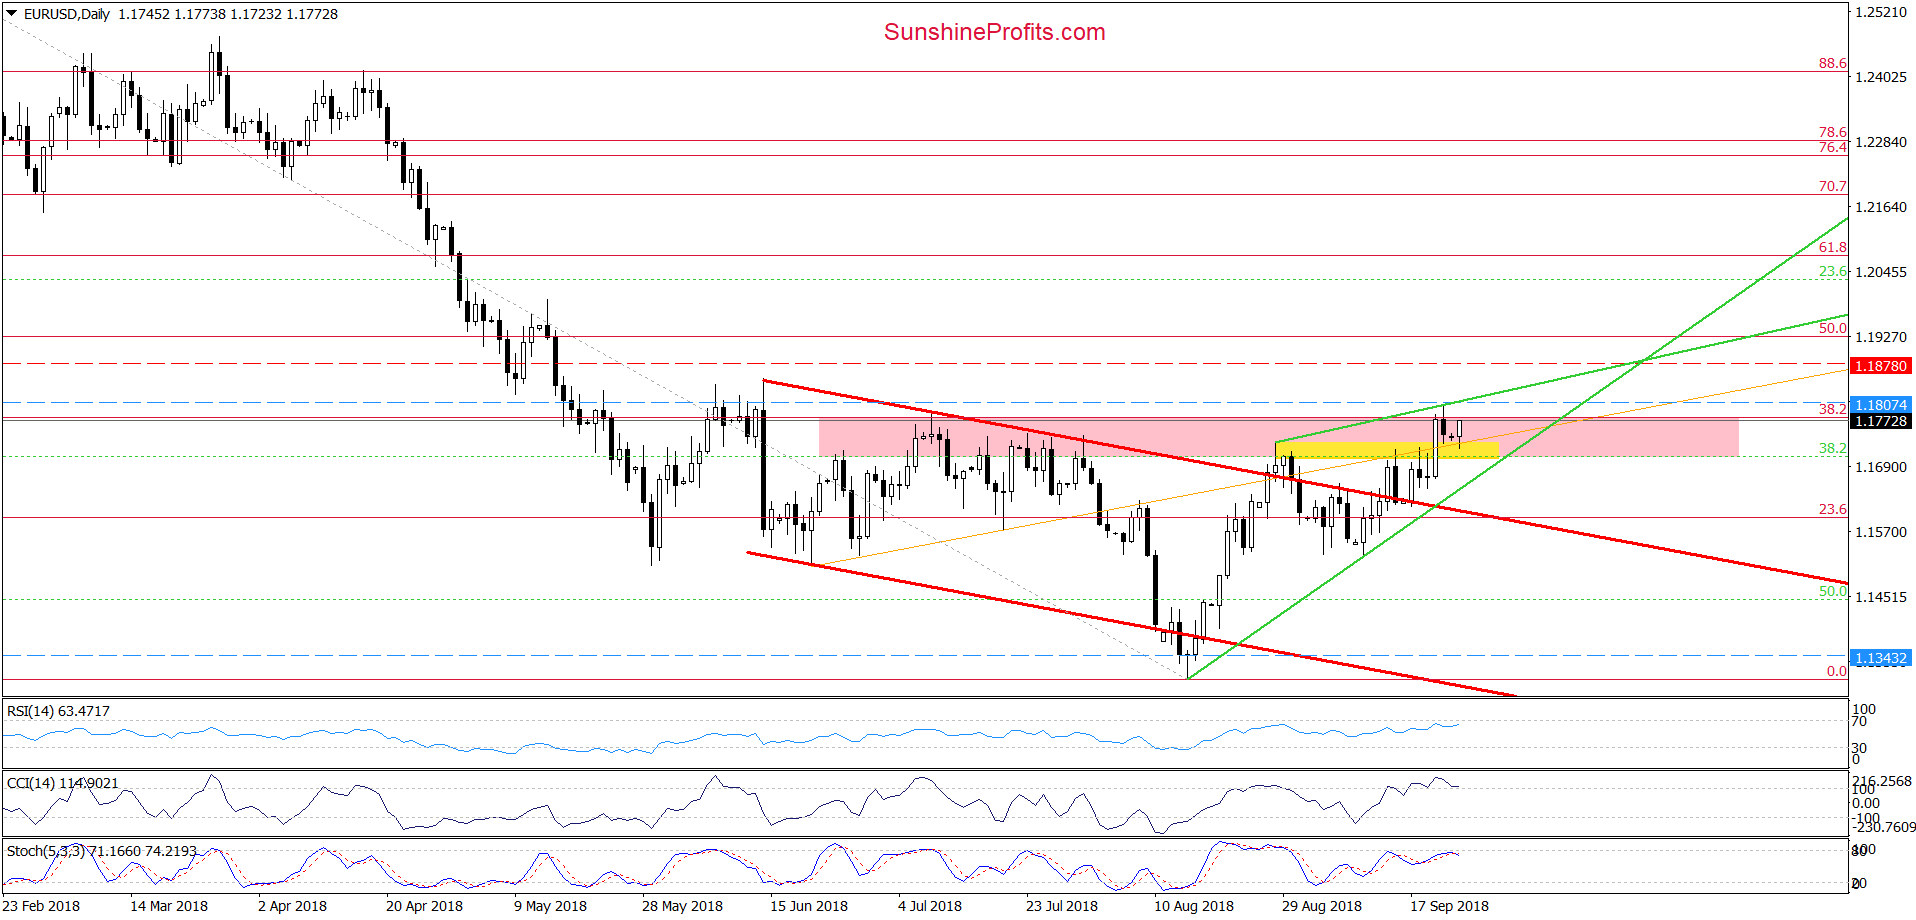
On Friday, EUR/USD climbed above the 38.2% Fibonacci retracement (based on the entire February-August downward move) and the upper line of the pink resistance zone, but then invalidated the earlier breakout, closing the day slightly above the previously-broken yellow zone and the orange line, which serve as the nearest support.
Despite this deterioration, currency bulls didn’t lay down their arms and took another fight for higher levels earlier today. Thanks to their determination, the exchange rate increased to Friday’s highs, but we continue to think that lower values of the exchange rate are just around the corner - especially when we add an additional resistance (the green resistance line based on the previous peaks) and the current situation in the medium term.
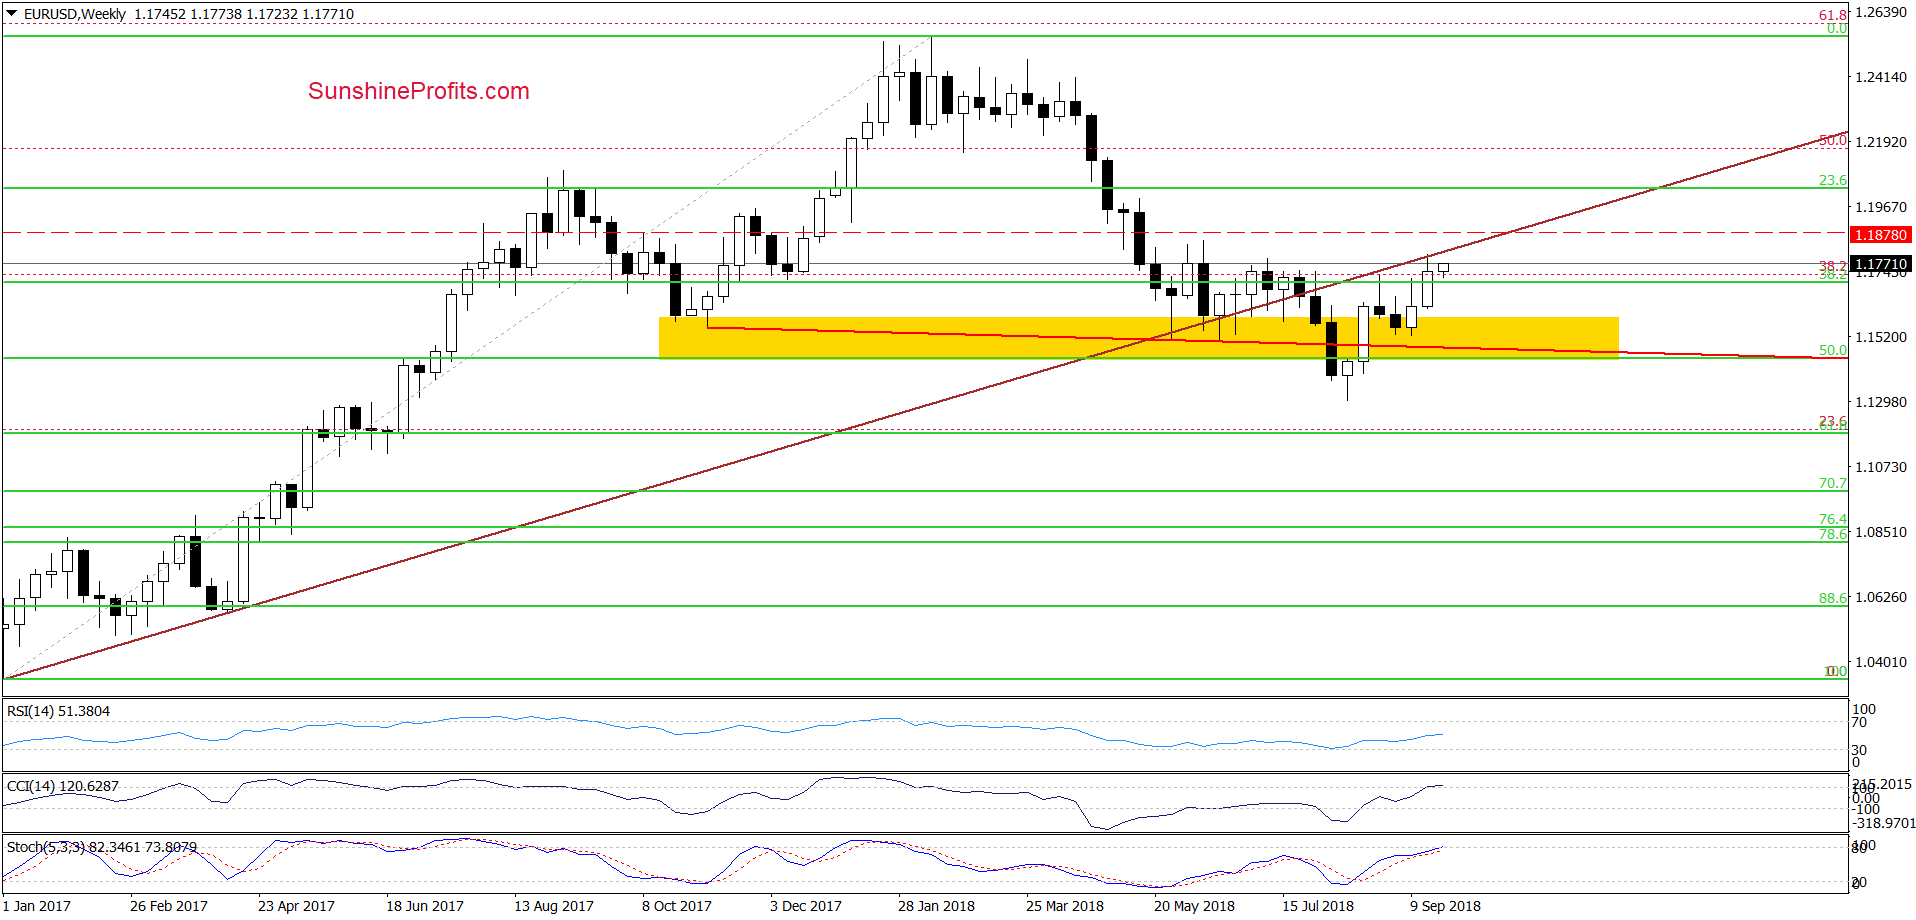
As you see on the weekly chart, EUR/USD climbed to the previously-broken long-term brown line, but then pulled back and closed the week below it, which looks like a verification of the late-July breakdown.
Earlier today, currency bulls triggered one more move to the north, which suggests that we could see another verification in the very short term. Nevertheless, in our opinion, as long as there is no invalidation of the breakdown under this line the way to higher levels is closed and one more reversal is very likely – especially when we factor in the similarity to the past about which we wrote on Friday:
(…) similar price action we saw at the end of August. Back then, the proximity to this important resistance encouraged currency bears to show their claws, which turned into decline.
This time, the sellers have on their side one more argument – the above-mentioned 38.2% Fibonacci retracement, which together with the upper line of the pink resistance zone and the long-term brown resistance line will likely stop further improvement in the very near future.
Taking all the above into account, we believe that short positions are justified as a bigger move to the downside is just around the corner. Therefore, if the pair closes today’s session below the above-mentioned resistances, we’ll see a test of the green support line based on previous lows in the very near future.
Trading position (short-term; our opinion): Short positions with a stop-loss order at 1.1878 and the initial downside target at 1.1343 are justified from the risk/reward perspective.
GBP/USD
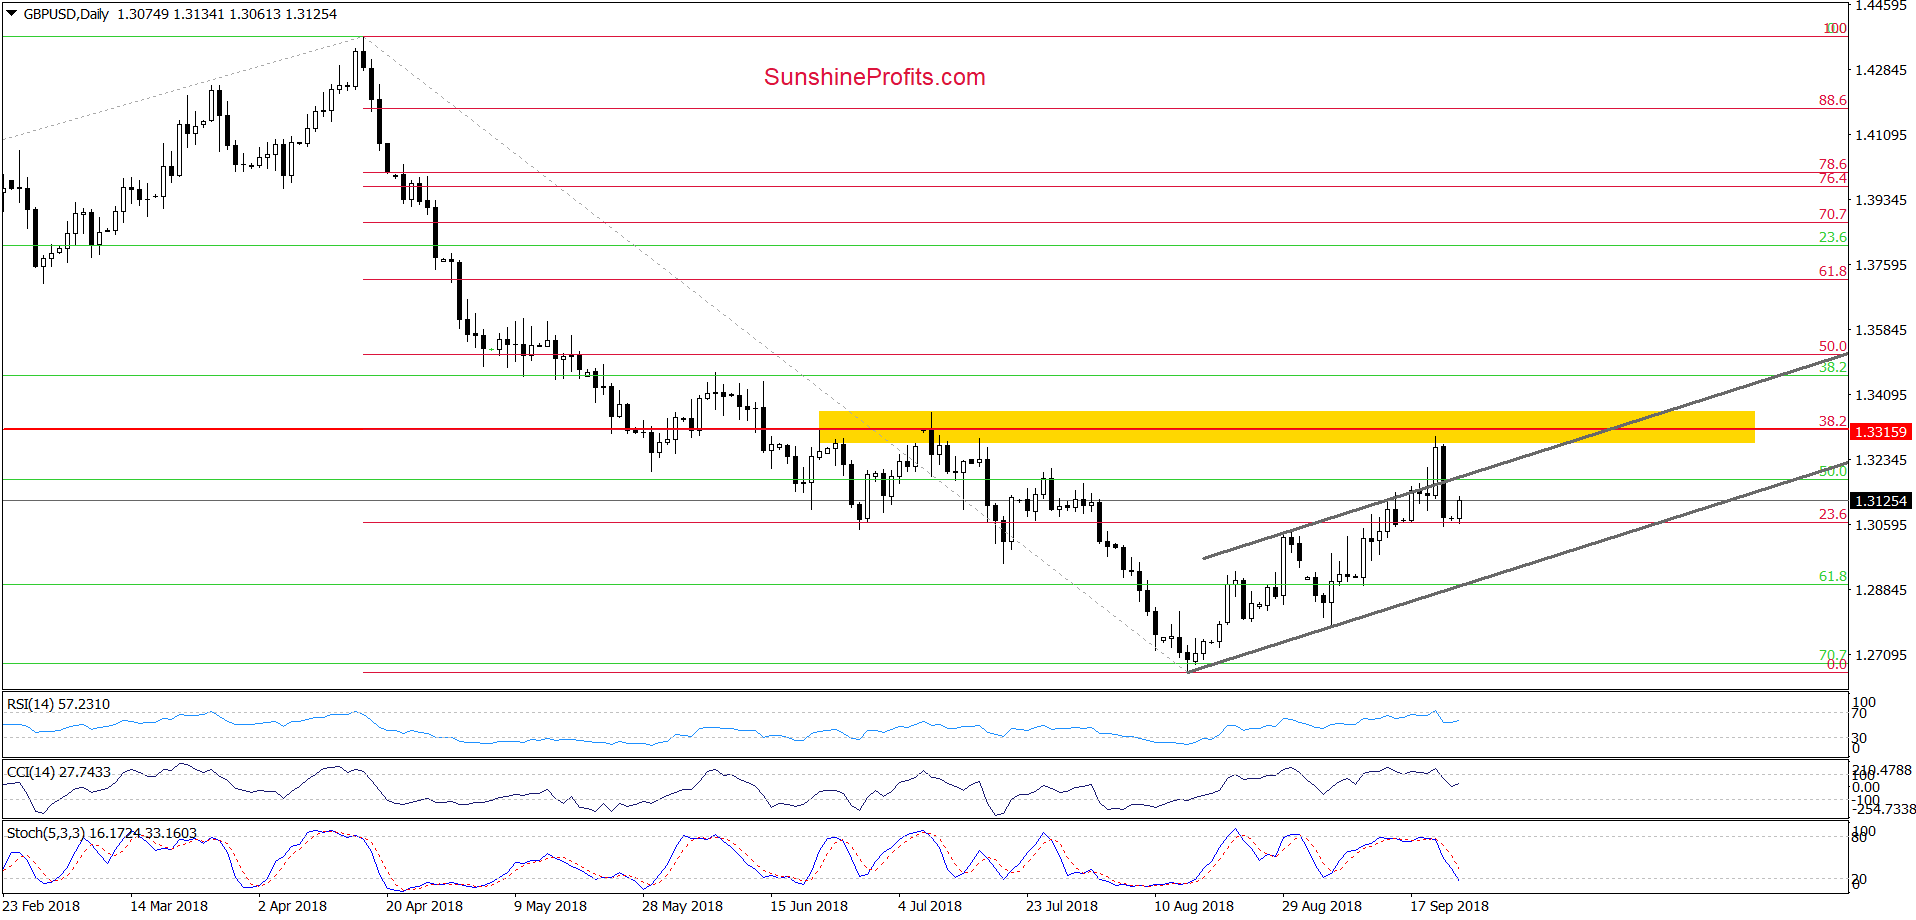
Although GBP/USD climbed to the yellow resistance zone created by the July highs and reinforced by the 38.2% Fibonacci retracement (based on the entire mid-April-mid-August downward move) on Thursday, currency bulls didn’t manage to hold gained levels, which resulted in a sharp move to the downside on the following day.
Thanks to Friday’s decline, the exchange rate invalidated the earlier breakout above the upper border of the grey rising trend channel, which in combination with the sell signals generated by the indicators suggests further deterioration in the following days.
Nevertheless, before we such price action (and a drop to the lower border of the formation) one more upswing and verification of the breakdown under the grey resistance line is likely.
If we see such price action and currency bulls’ weakness in this area, we’ll consider opening short positions. We will keep you informed should anything change, or should we see a confirmation/invalidation of the above.
Trading position (short-term; our opinion): No positions are justified from the risk/reward perspective.
USD/JPY
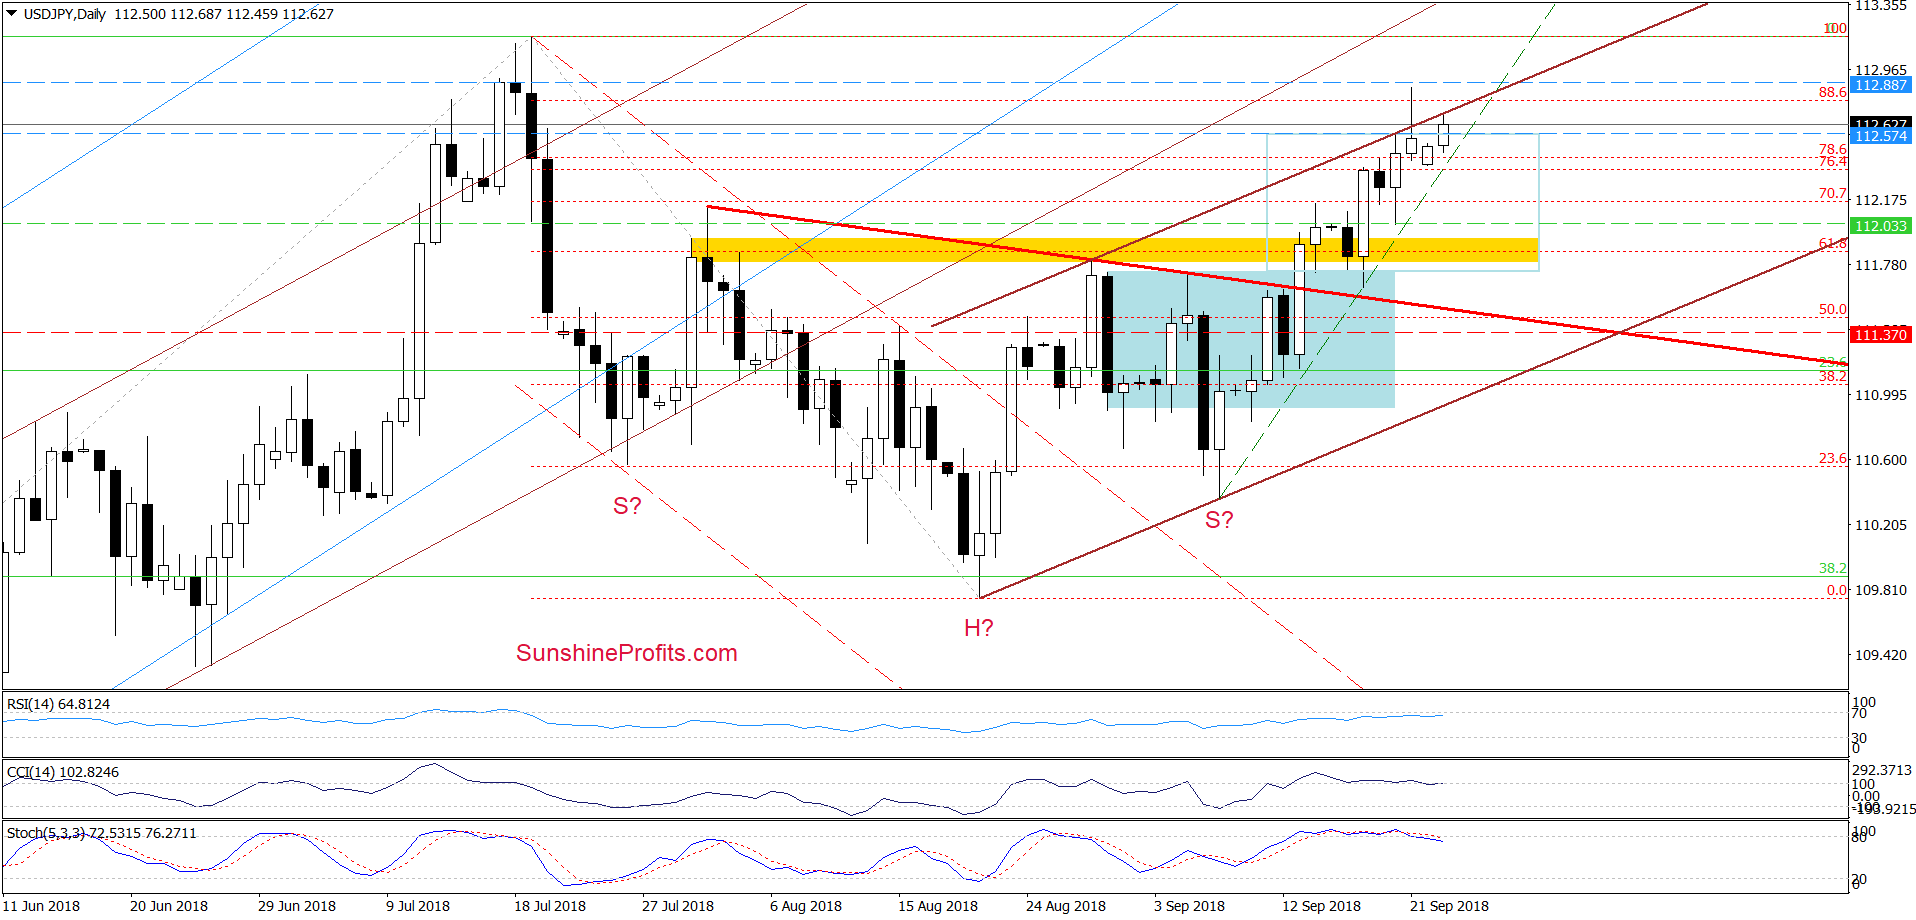
Looking at the daily chart, we see that USD/JPY increased above the upper border of the brown rising trend channel on Friday, but as it turned out, the proximity to the July peaks encouraged currency bears to act.
As a result, the pair pulled back and closed the day below the previously-broken line, invalidating the earlier breakout. Despite this move, the buyers pushed USD/JPY higher once again during today’s session, which could be a verification of Friday’s breakdown.
Nevertheless, we believe that as long as there is no daily closure under the very short-term black dashed support line based on the September lows, (at least) one more upswing and a test of our initial upside target is very likely.
Trading position (short-term; our opinion): Profitable long positions with a stop-loss order at 110.80 and the initial upside target at 112.88 are justified from the risk/reward perspective.
Thank you.
Nadia Simmons
Forex & Oil Trading Strategist
Przemyslaw Radomski, CFA
Founder, Editor-in-chief, Gold & Silver Fund Manager
Gold & Silver Trading Alerts
Forex Trading Alerts
Oil Investment Updates
Oil Trading Alerts

