

After several days inside the consolidation under important resistance, currency bulls finally pushed USD/JPY above the upper line of the formation. But is the road to the north really open?
In our opinion the following forex trading positions are justified - summary:
- EUR/USD: none
- GBP/USD: none
- USD/JPY: none
- USD/CAD: short (a stop-loss order at 1.2717; the next downside target at 1.2510)
- USD/CHF: none
- AUD/USD: none
EUR/USD
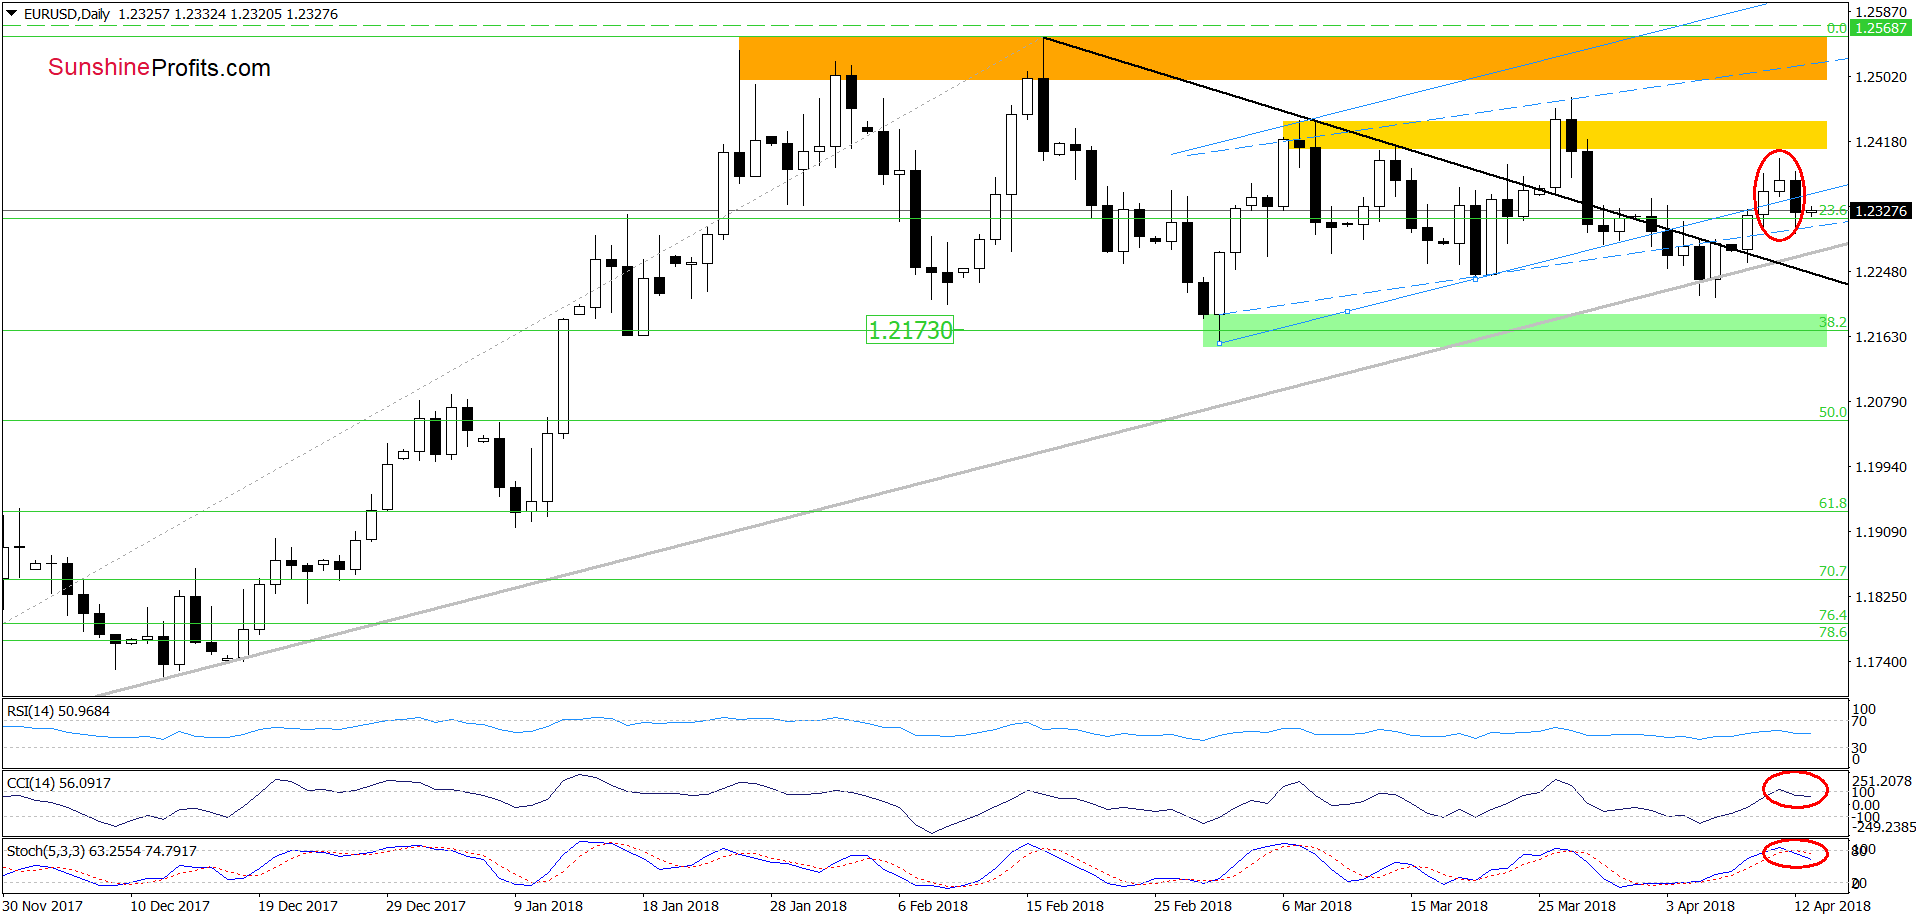
From today’s point of view, we see that the sellers pushed the exchange rate lower yesterday, which resulted in a comeback under the previously-broken lower line of the blue rising trend channel and created an evening star - a bearish candlestick pattern (we marked it with the red ellipse). Additionally, the CCI and the Stochastic Oscillator generated the sell signals, supporting further deterioration in the coming days.
Why we didn’t decide to open short positions? In our opinion, there are 3 major reasons:
First, the pair remains above the medium-term grey rising support line, which stopped currency bears in the previous week.
Second, the exchange rate is also trading above the long-term green line marked on the weekly chart below.
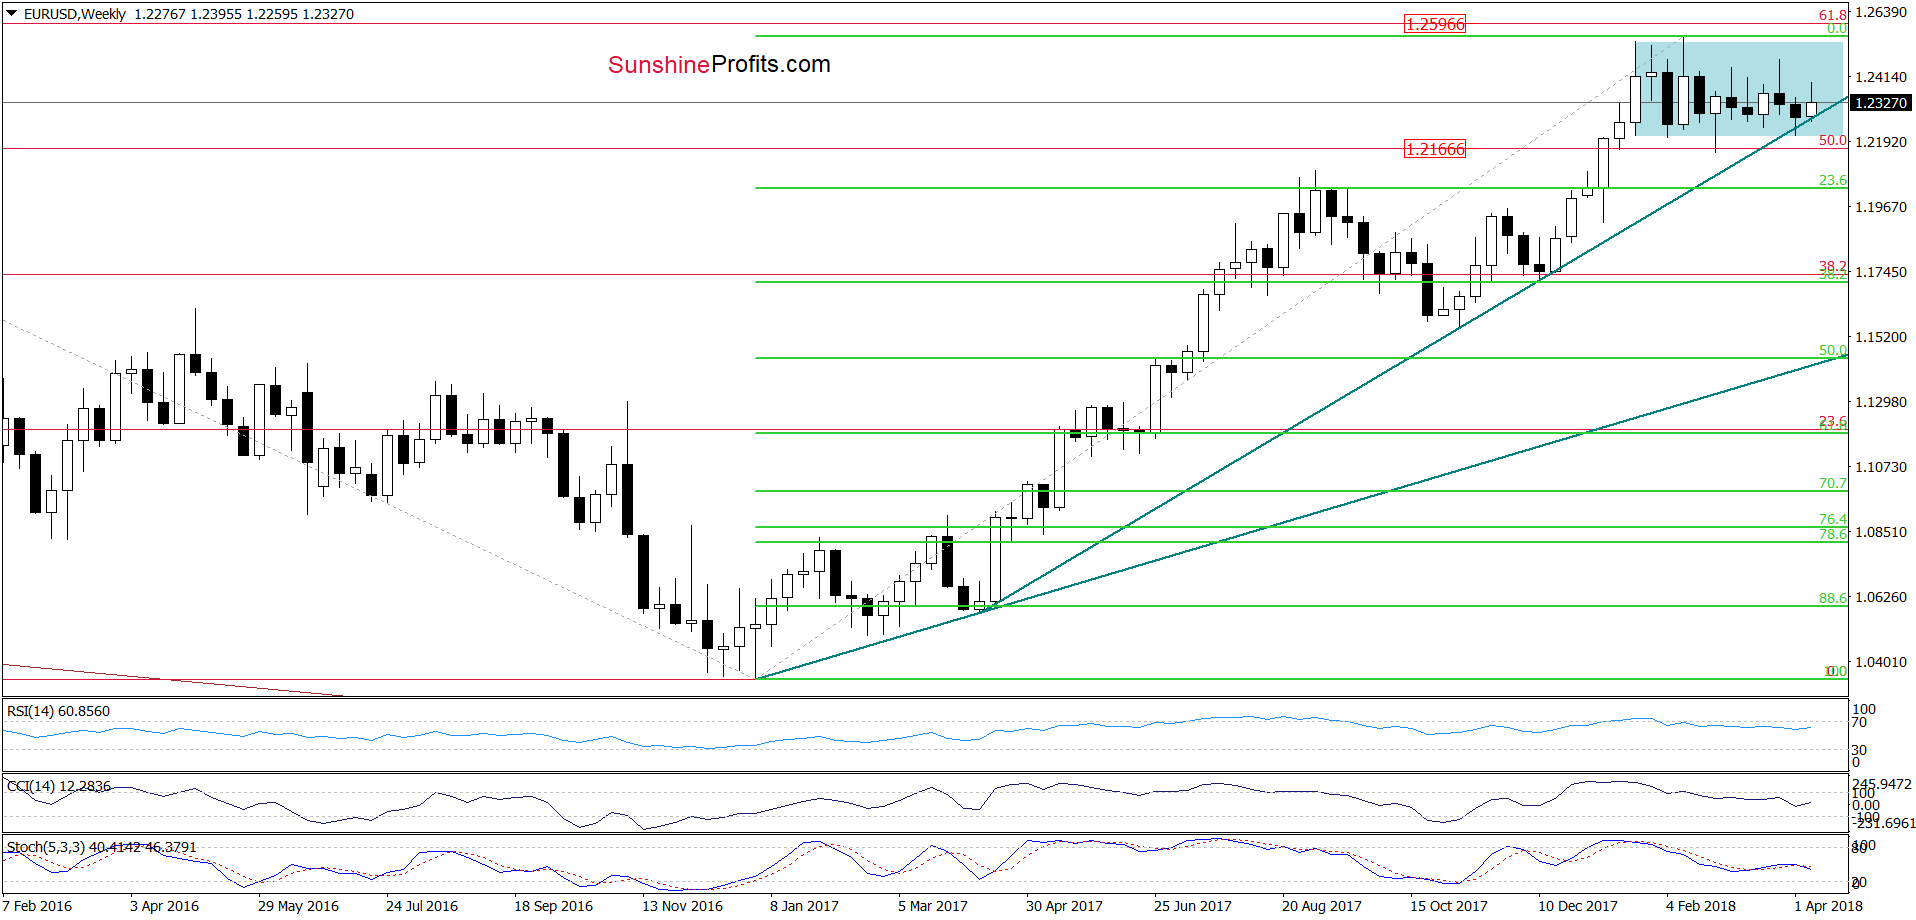
As you see, this line also supported the buyers in the previous week, which increases the importance of this area in the coming days and suggests that as long as there is no successful breakdown below the above-mentioned lines a bigger move to the downside is not likely to be seen.
Third – the current situation in the USD Index.
U.S. Currency Doesn’t Show Strength
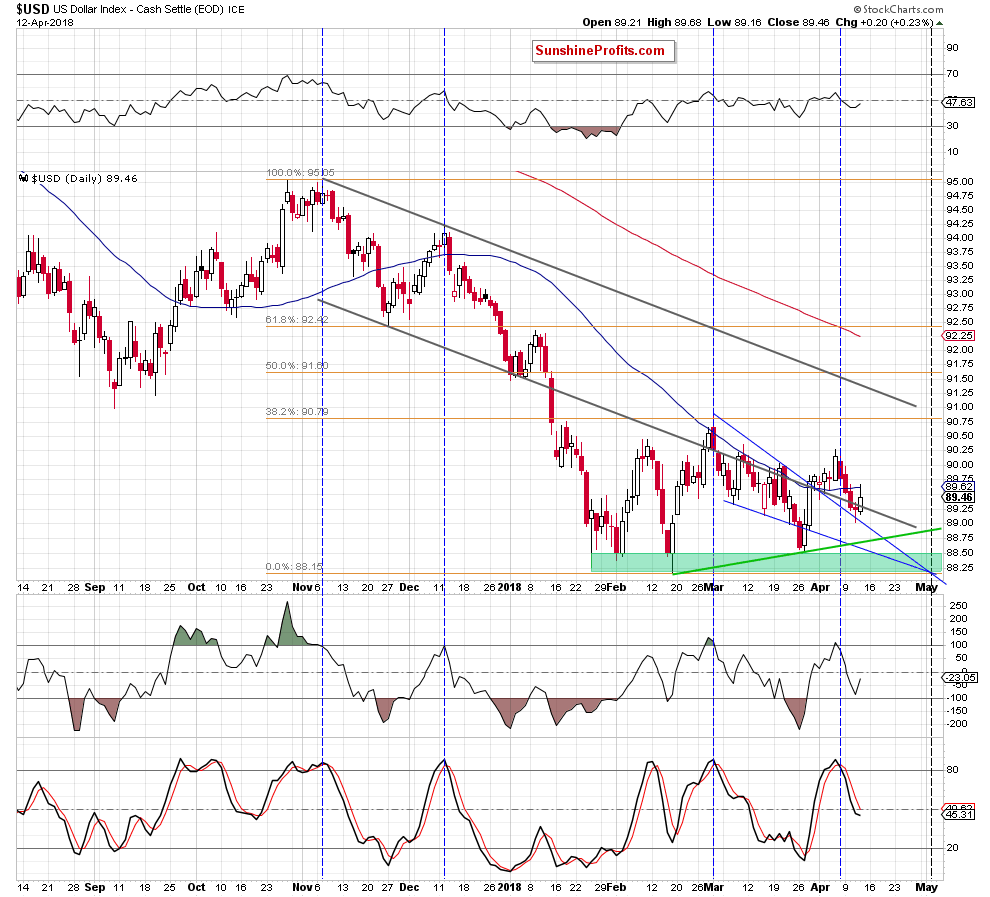
From today’s point of view, we see that USD Index bounced off the upper border of the blue declining wedge and came back above the lower border of the grey declining trend channel, invalidating the earlier breakdown once again.
Although this is a positive development it’s hard to call it bullish, because we saw similar price action several times during recent weeks and none of the previous comebacks resulted in significant improvement.
Additionally, the greenback closed yesterday’s session under the 50-day moving average, which in combination with the sell signals generated by the indicators raises doubts about the buyers’ strength.
Once we know the relationship between the euro and the greenback, let’s examine recent price action in USD/JPY and USD/CAD.
USD/JPY
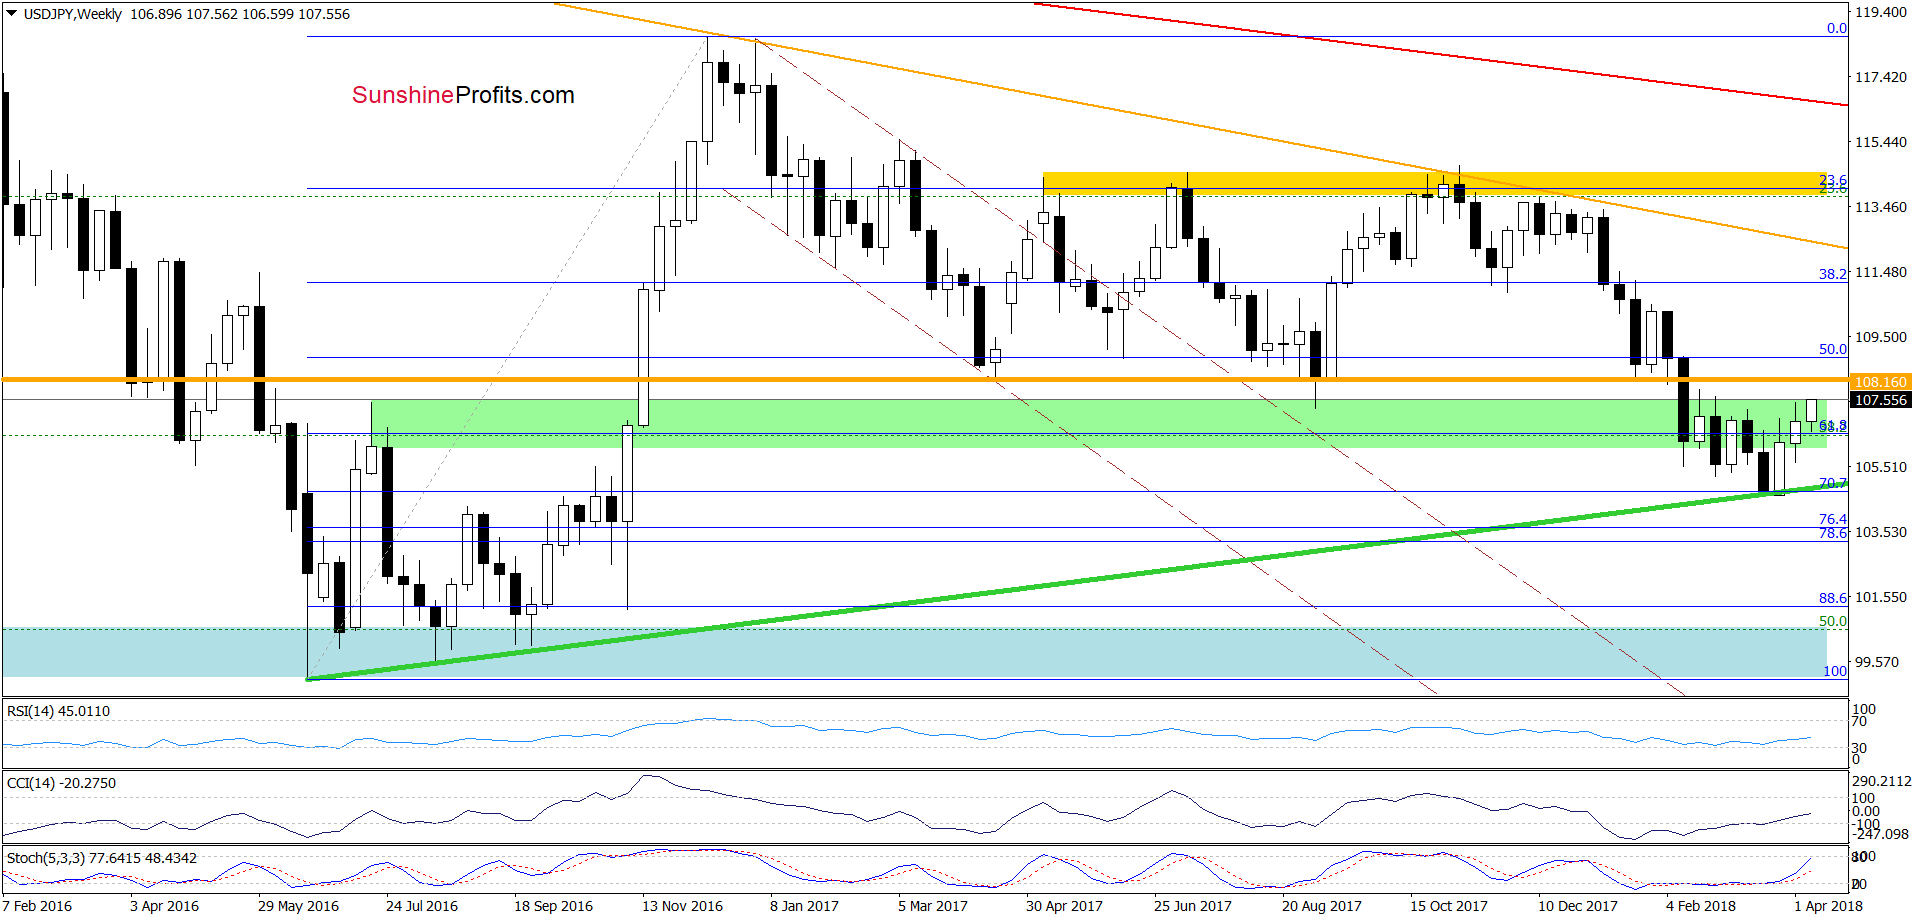
On the medium-term chart, we see that the exchange rate extended gains this week, which in combination with the buy signals generated by the indicators suggests further improvement.
But will we see a significant rally in the coming week? Let’s examine the short-term resistances.
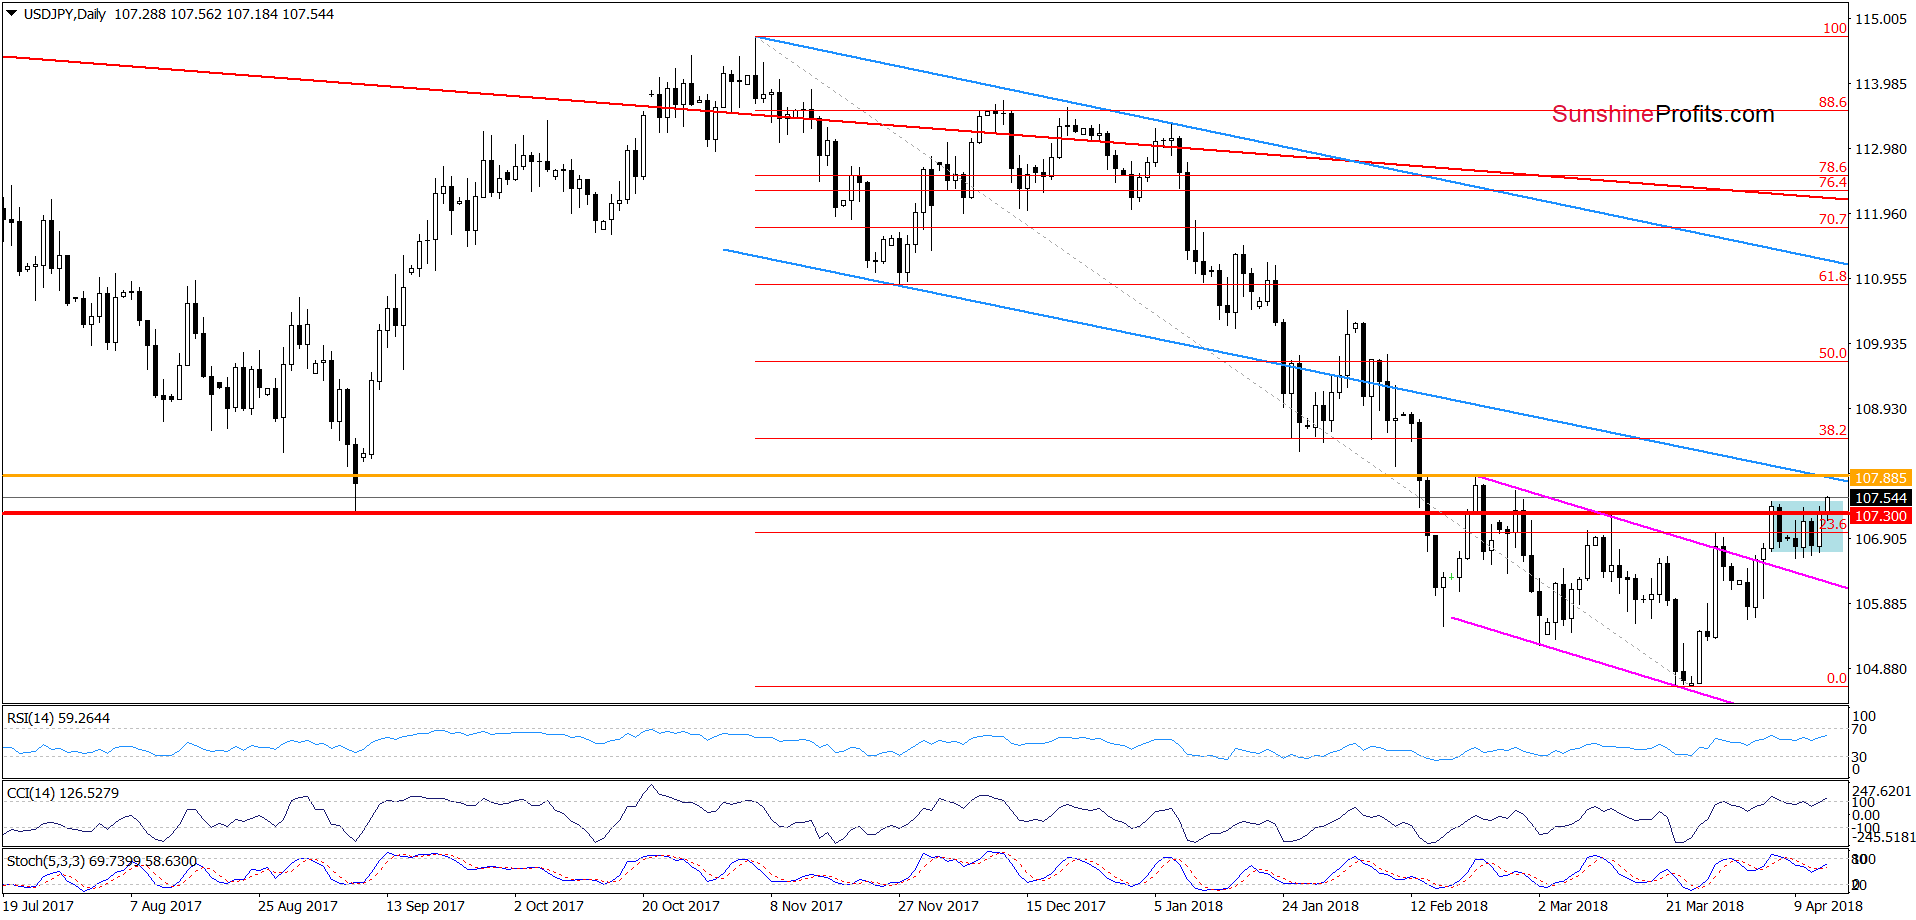
The first thing that catches the eye on the daily chart is breakout above the upper border of the blue consolidation. Although this is a bullish development, we can’t forget that the exchange rate remains under the resistance area created by the orange resistance line based on the late February peak and the previously-broken lower border of the blue declining trend channel.
This suggests that as long as there is no successful breakout above these lines further improvement is questionable and one more reversal can’t be ruled out.
Nevertheless, if currency bulls manage to break above this zone and the 38.2% Fibonacci retracement, we’ll consider opening long positions.
Trading position (short-term; our opinion): No positions are justified from the risk/reward perspective. We will keep you informed should anything change, or should we see a confirmation/invalidation of the above.
USD/CAD
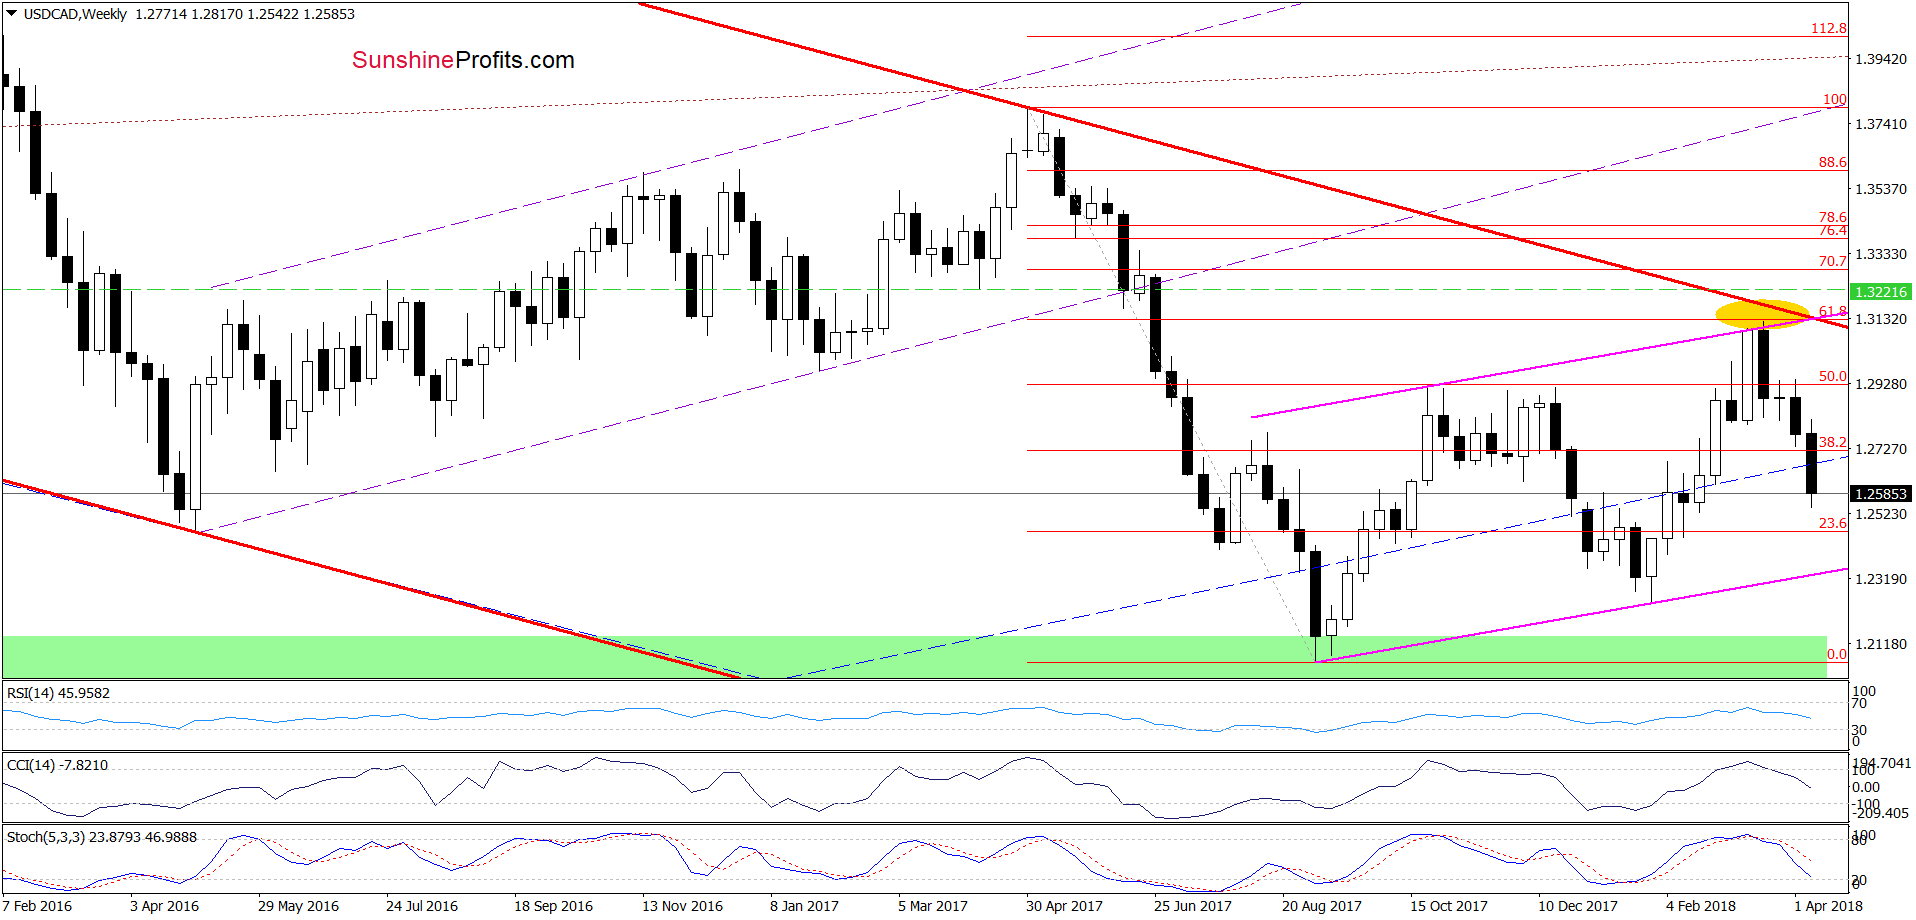
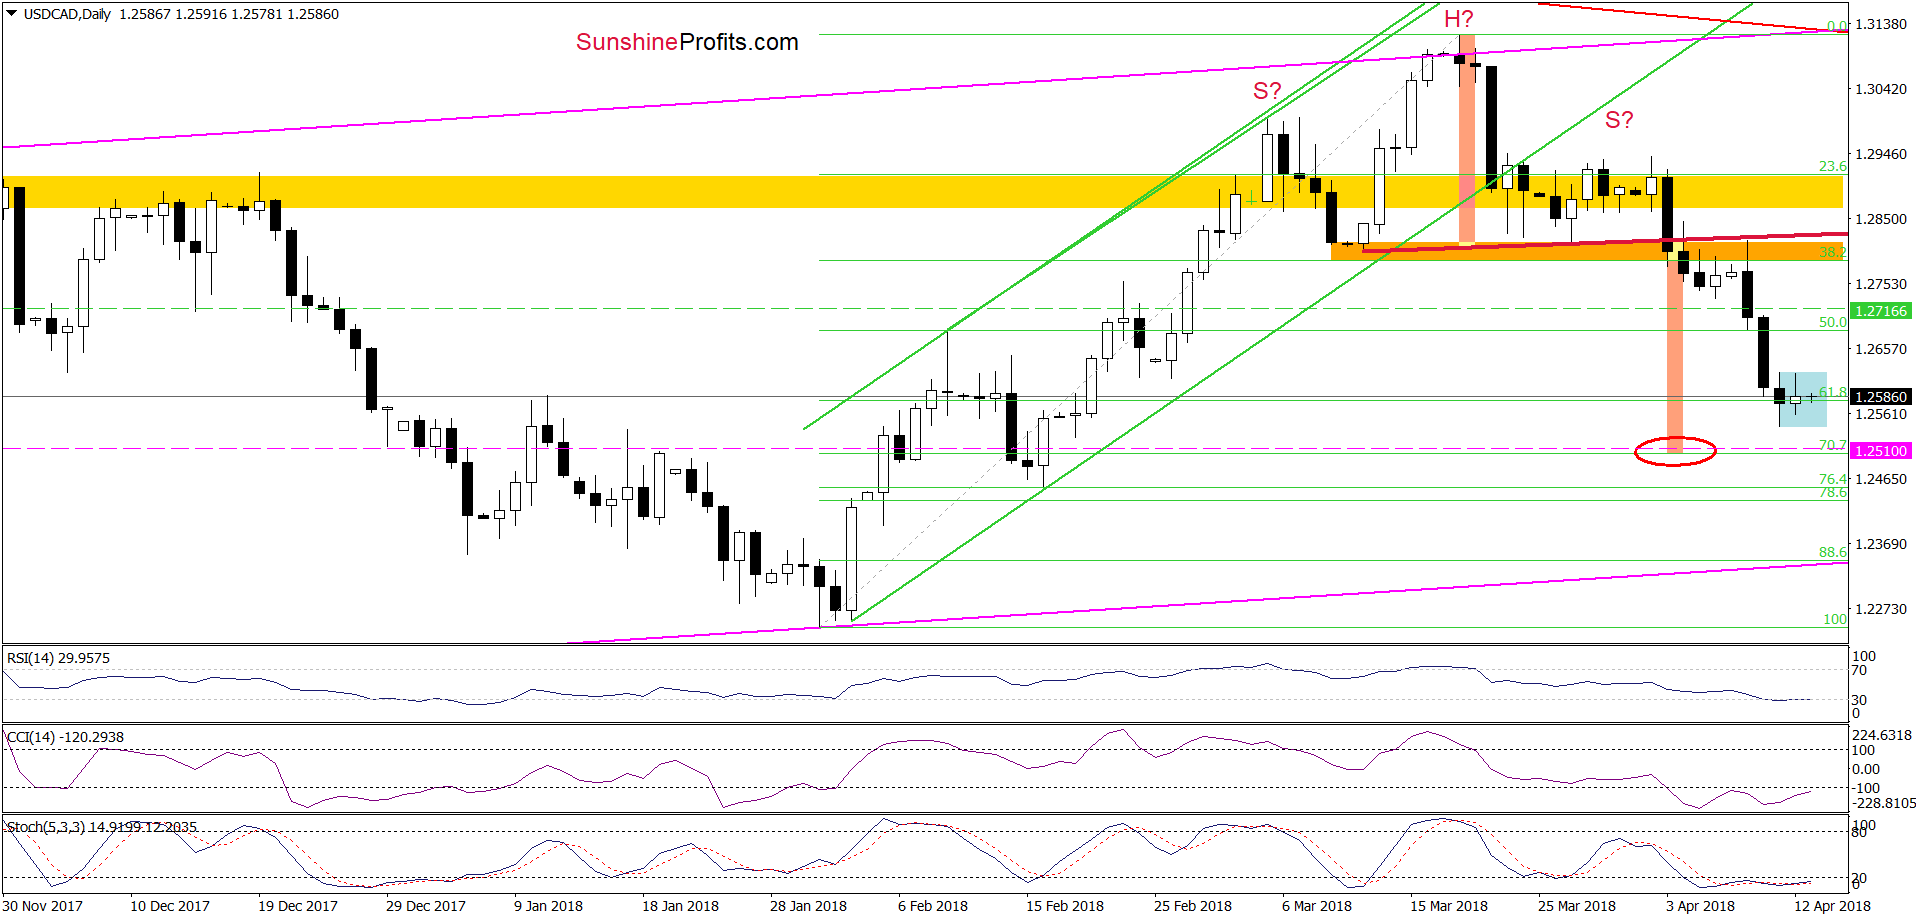
Looking at the charts, we see that the overall situation in the very short term hasn’t changed much as USD/CAD is trading in the blue consolidation around the 61.8% Fibonacci retracement. This suggest that the strength of sellers may decrease in the following days.
On top of that, the CCI and the Stochastic Oscillator are extremely oversold, which increases the probability of rebound in the very near future.
Taking all the above into account, we decided to move our stop loss order lower (to 1.2717) to protect another part of our profits.
Nevertheless, our profitable short positions with the next downside target at 1.2510 are justified from the risk/reward perspective. We will keep you informed should anything change, or should we see a confirmation/invalidation of the above.
Thank you.
Nadia Simmons
Forex & Oil Trading Strategist
Przemyslaw Radomski, CFA
Founder, Editor-in-chief, Gold & Silver Fund Manager
Gold & Silver Trading Alerts
Forex Trading Alerts
Oil Investment Updates
Oil Trading Alerts

