

Although the U.S. dollar declined sharply against the yen earlier this week, two currency bulls’ allies stopped further deterioration, triggering a rebound earlier today. But will they withstand another attack?
In our opinion the following forex trading positions are justified - summary:
- EUR/USD: short (a stop-loss order at 1.2250; the initial downside target at 1.1510)
- GBP/USD: short (a stop-loss order at 1.3773; the next downside target at 1.3000)
- USD/JPY: none
- USD/CAD: none
- USD/CHF: none
- AUD/USD: short (a stop-loss order at 0.8006; the initial downside target at 0.7730)
EUR/USD
Yesterday, we wrote the following:
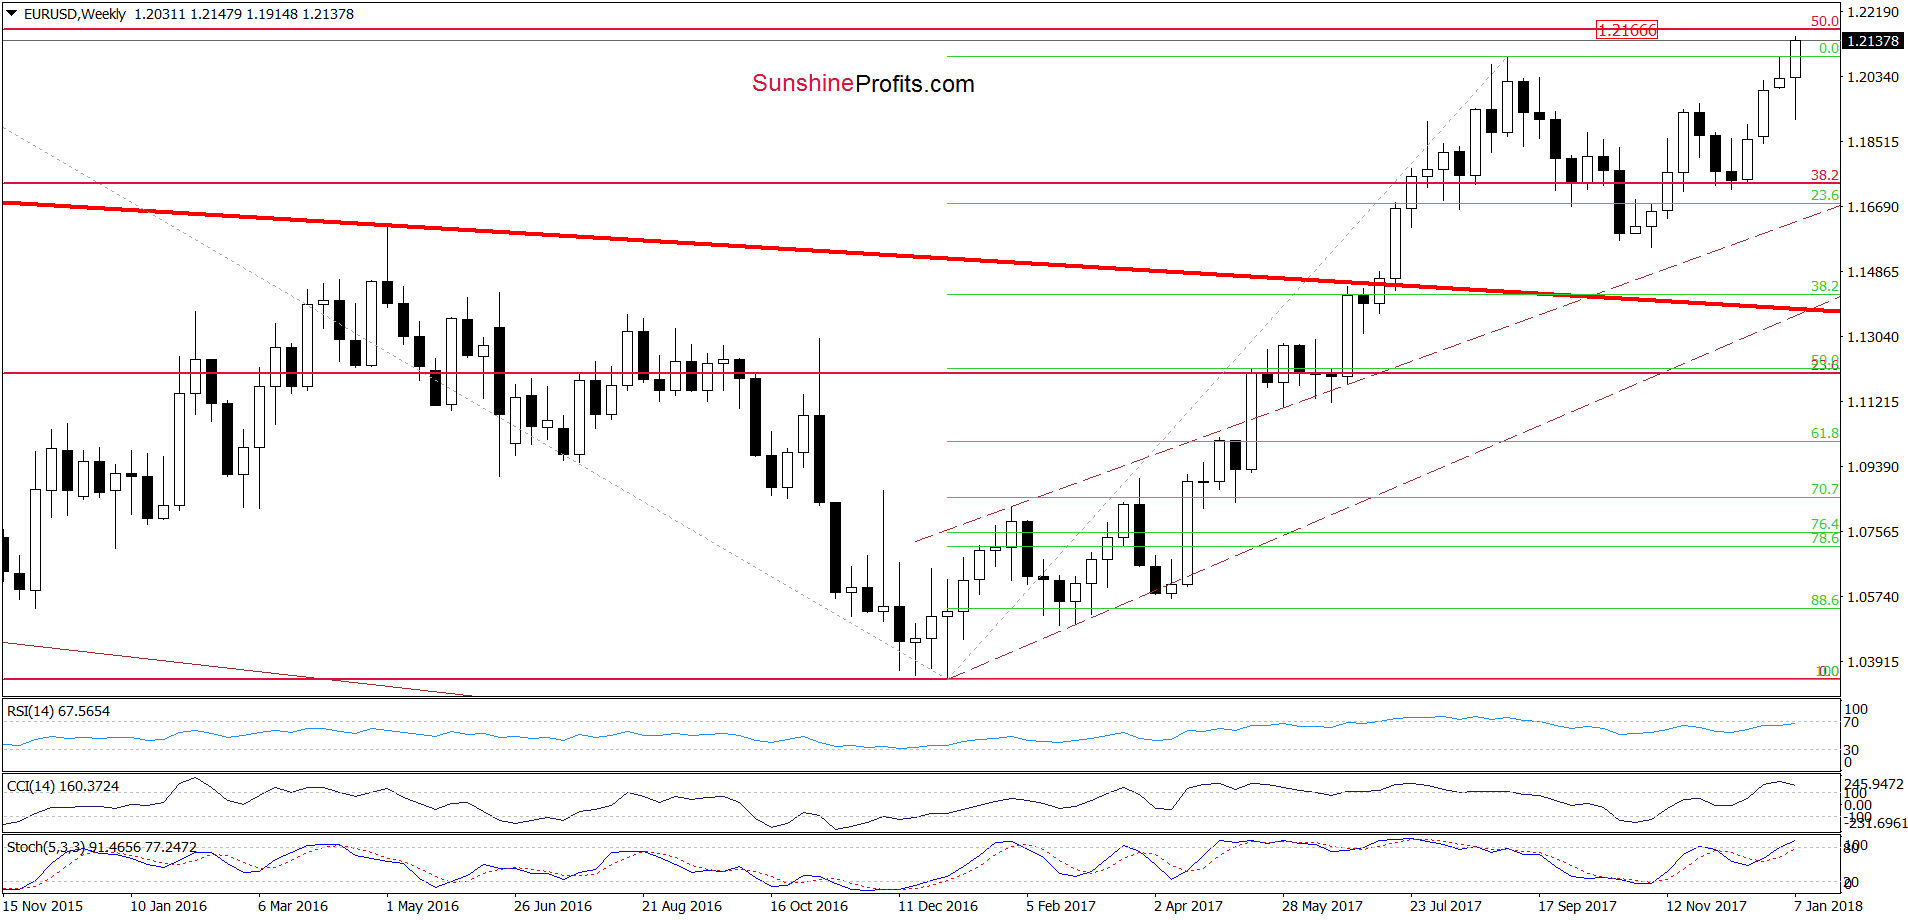
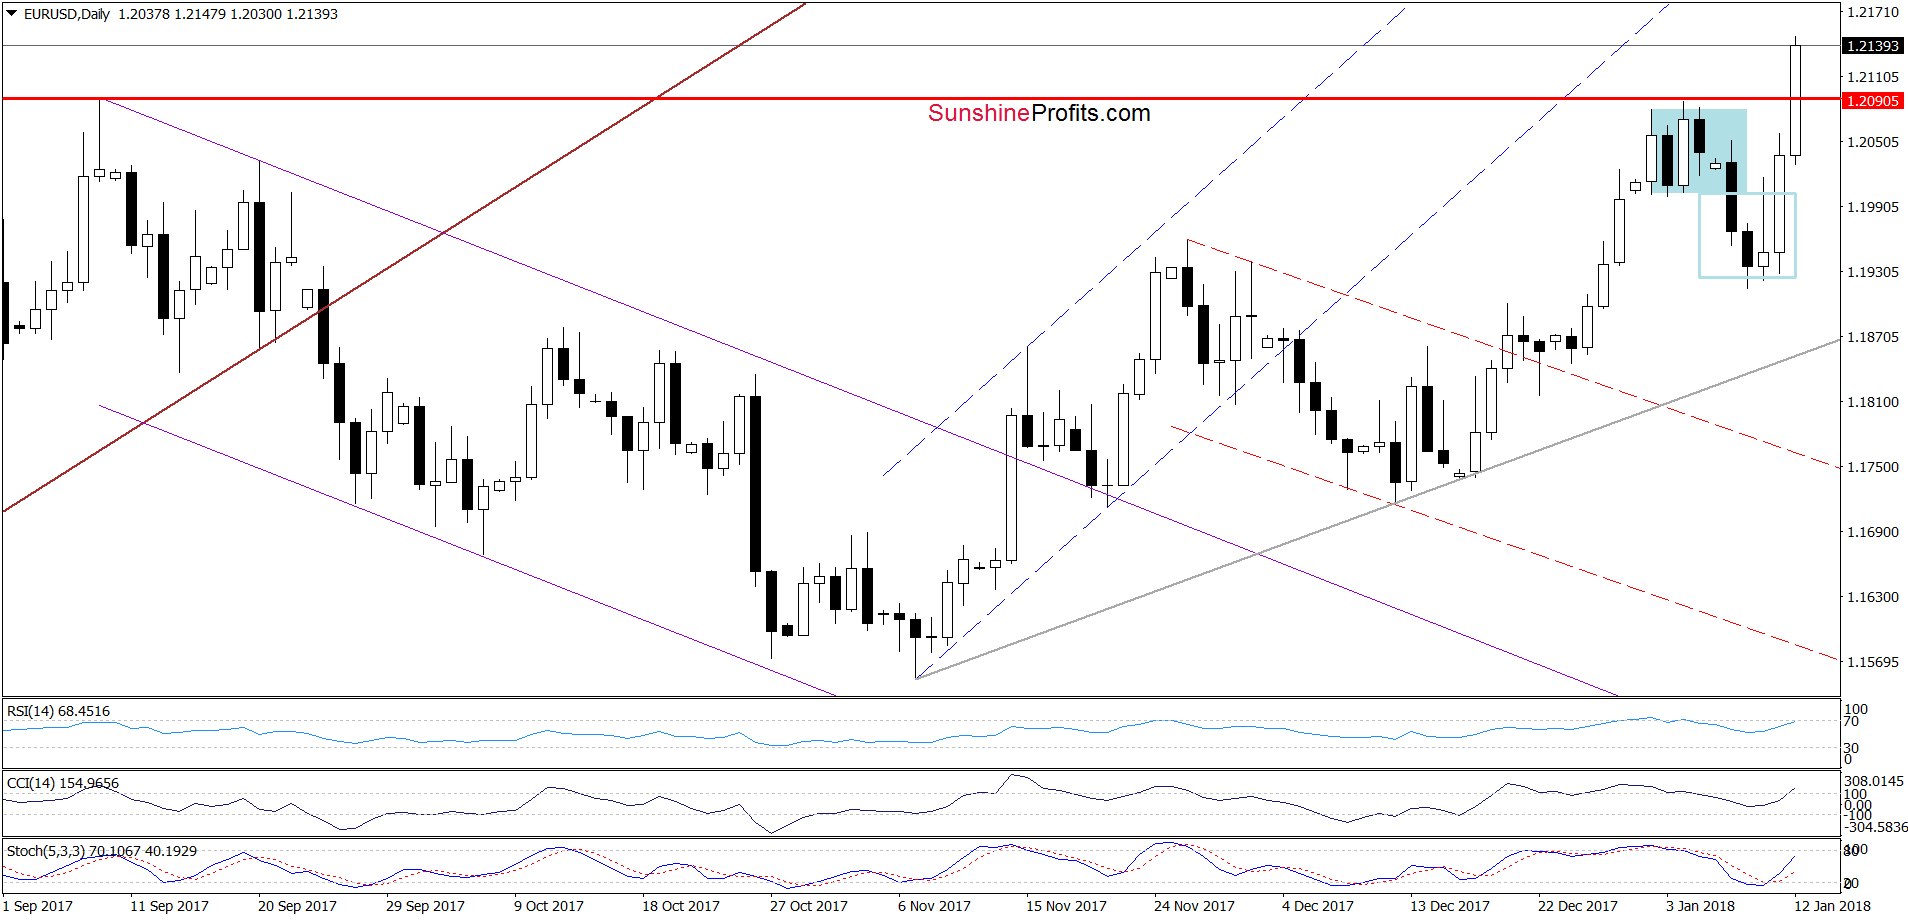
(…) EUR/USD rebounded sharply once again (…) Thanks to this move the exchange rate erased most of the recent decline, which together with the buy signal generated by the Stochastic Oscillator suggests that we may see a test of the 2018 peak or even the 50% Fibonacci retracement (marked on the weekly chart below) in near future.
From today’s point of view, we see that the situation developed in line with the above scenario and the exchange rate climbed to a fresh peak, which suggests that we’ll likely also see a test of our next upside target. Nevertheless, if the pair closes today’s session (and the whole week about this resistance), we’ll consider closing our short positions.
We will keep you informed should anything change, or should we see a confirmation/invalidation of the above.
Trading position (short-term; our opinion): short positions (with a stop-loss order at 1.2250 and the initial downside target at 1.1510) continue to be justified from the risk/reward perspective. We will keep you informed should anything change, or should we see a confirmation/invalidation of the above.
USD/JPY
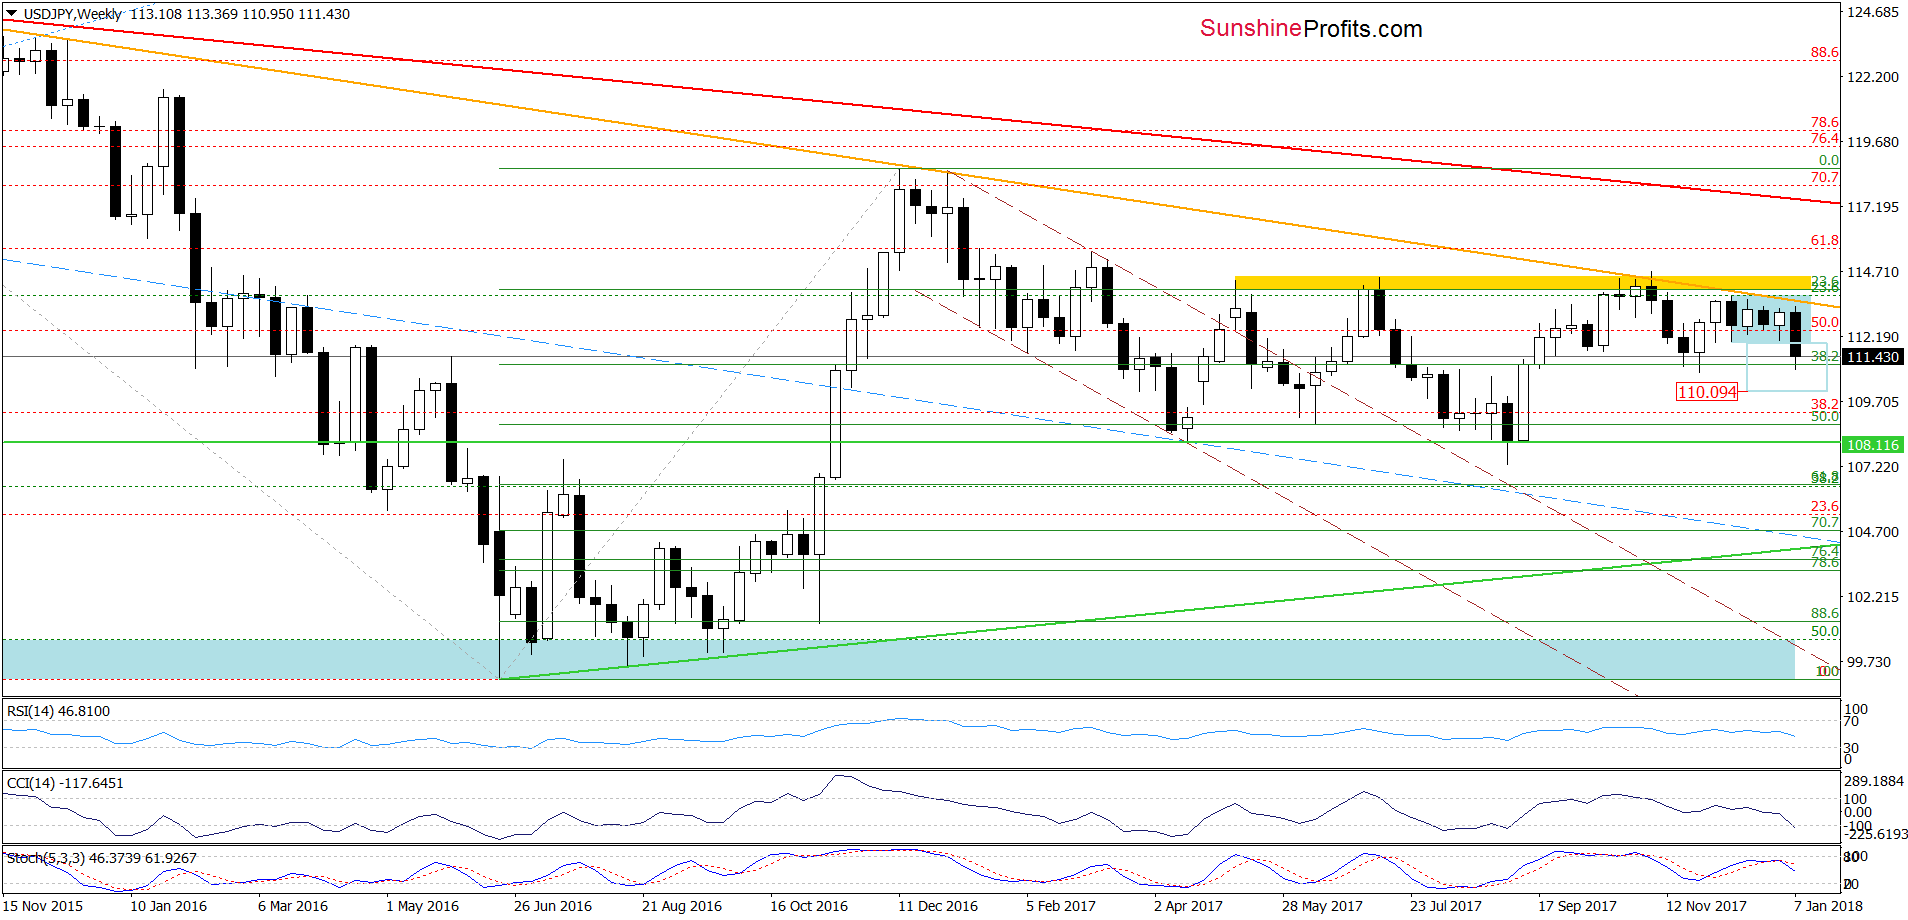
The first thing that caches the eye on the weekly chart is a breakdown under the lower border of the blue consolidation.
Will wee a bigger move to the downside in the following days? Let’s take a look at the daily chart and look for clues to answer this question.
Nevertheless, before we comment recent developments, let’s recall the quote from our last commentary on this currency pair:
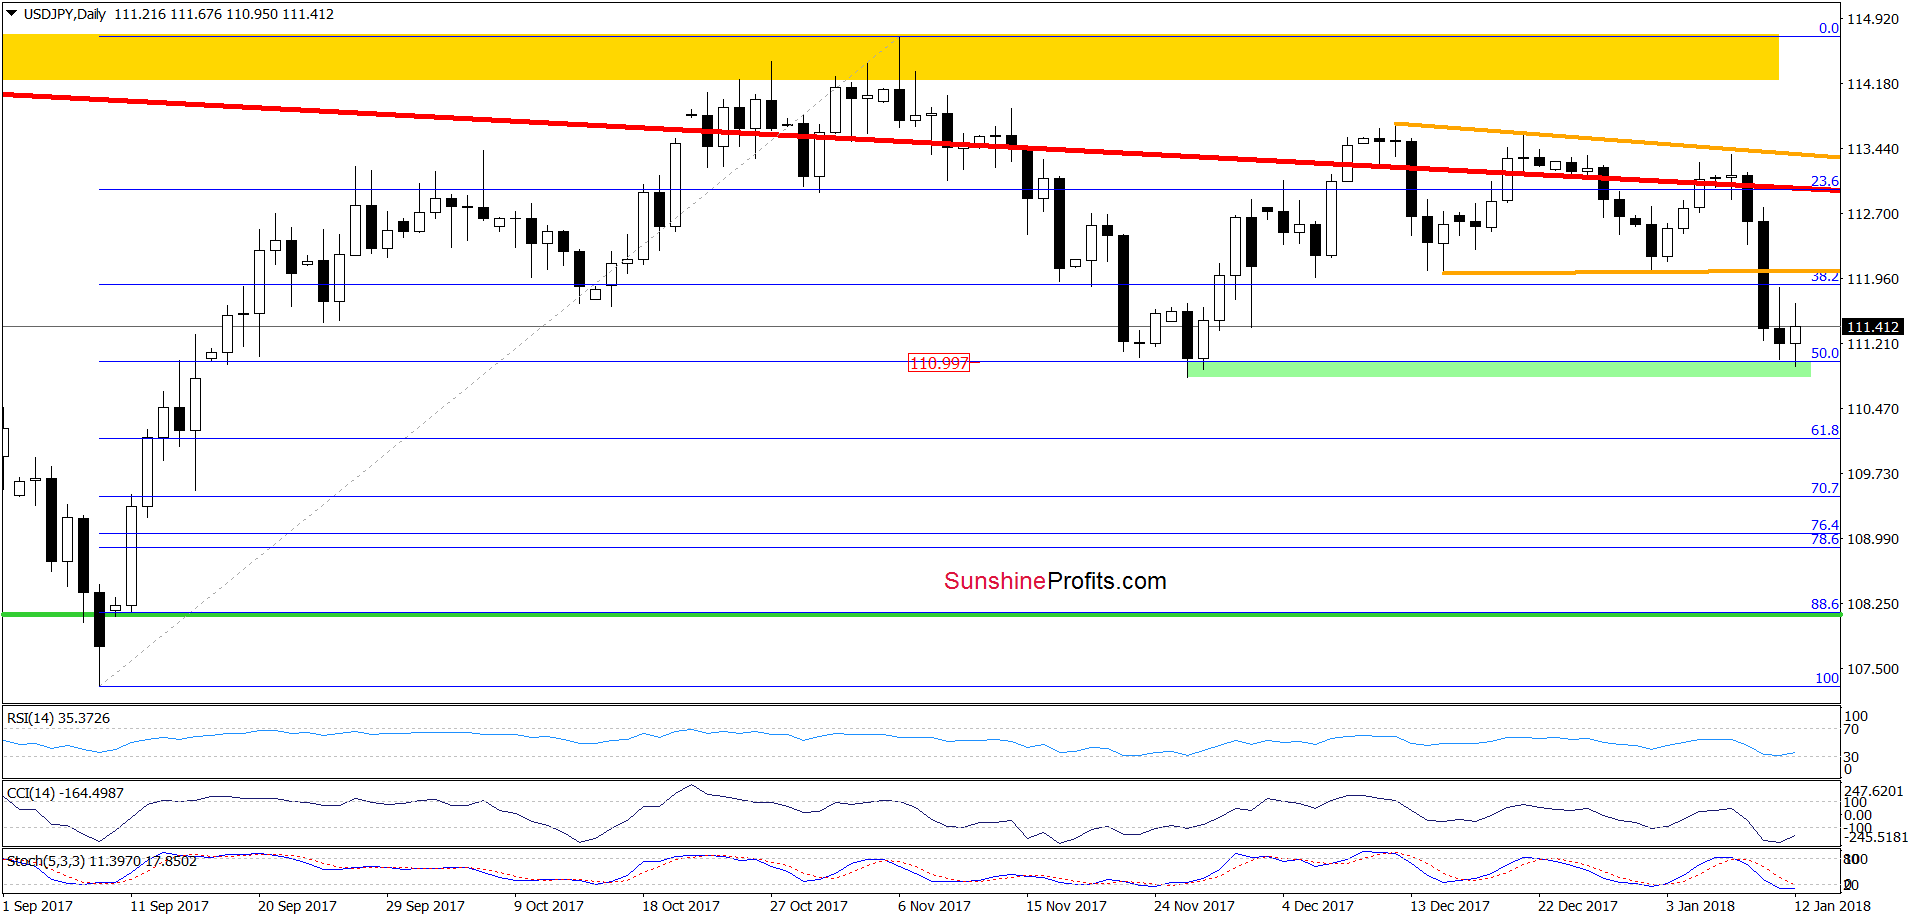
(…) USD/JPY declined sharply, reaching our downside target earlier today. Taking this bearish development into account and combining it with the sell signals generated by the indicators, we think that the pair will extend declines and test the green support zone (created by the November lows and the 50% Fibonacci retracement) in the coming week.
Looking at the above chart, we see that currency bears pushed USD/JPY lower (as we had expected), which resulted in a decline to our next downside target. As you see, the green support area triggered a rebound earlier today, which suggests that we may see a verification of the breakdown under the lower border of the orange wedge in the coming days. The result of the battle between bulls and bears in this area will give us clues about the exchange rate’s next move.
Trading position (short-term; our opinion): No positions are justified from the risk/reward perspective now. We will keep you informed should anything change, or should we see a confirmation/invalidation of the above.
USD/CAD
Quoting our Tuesday ‘s alert:
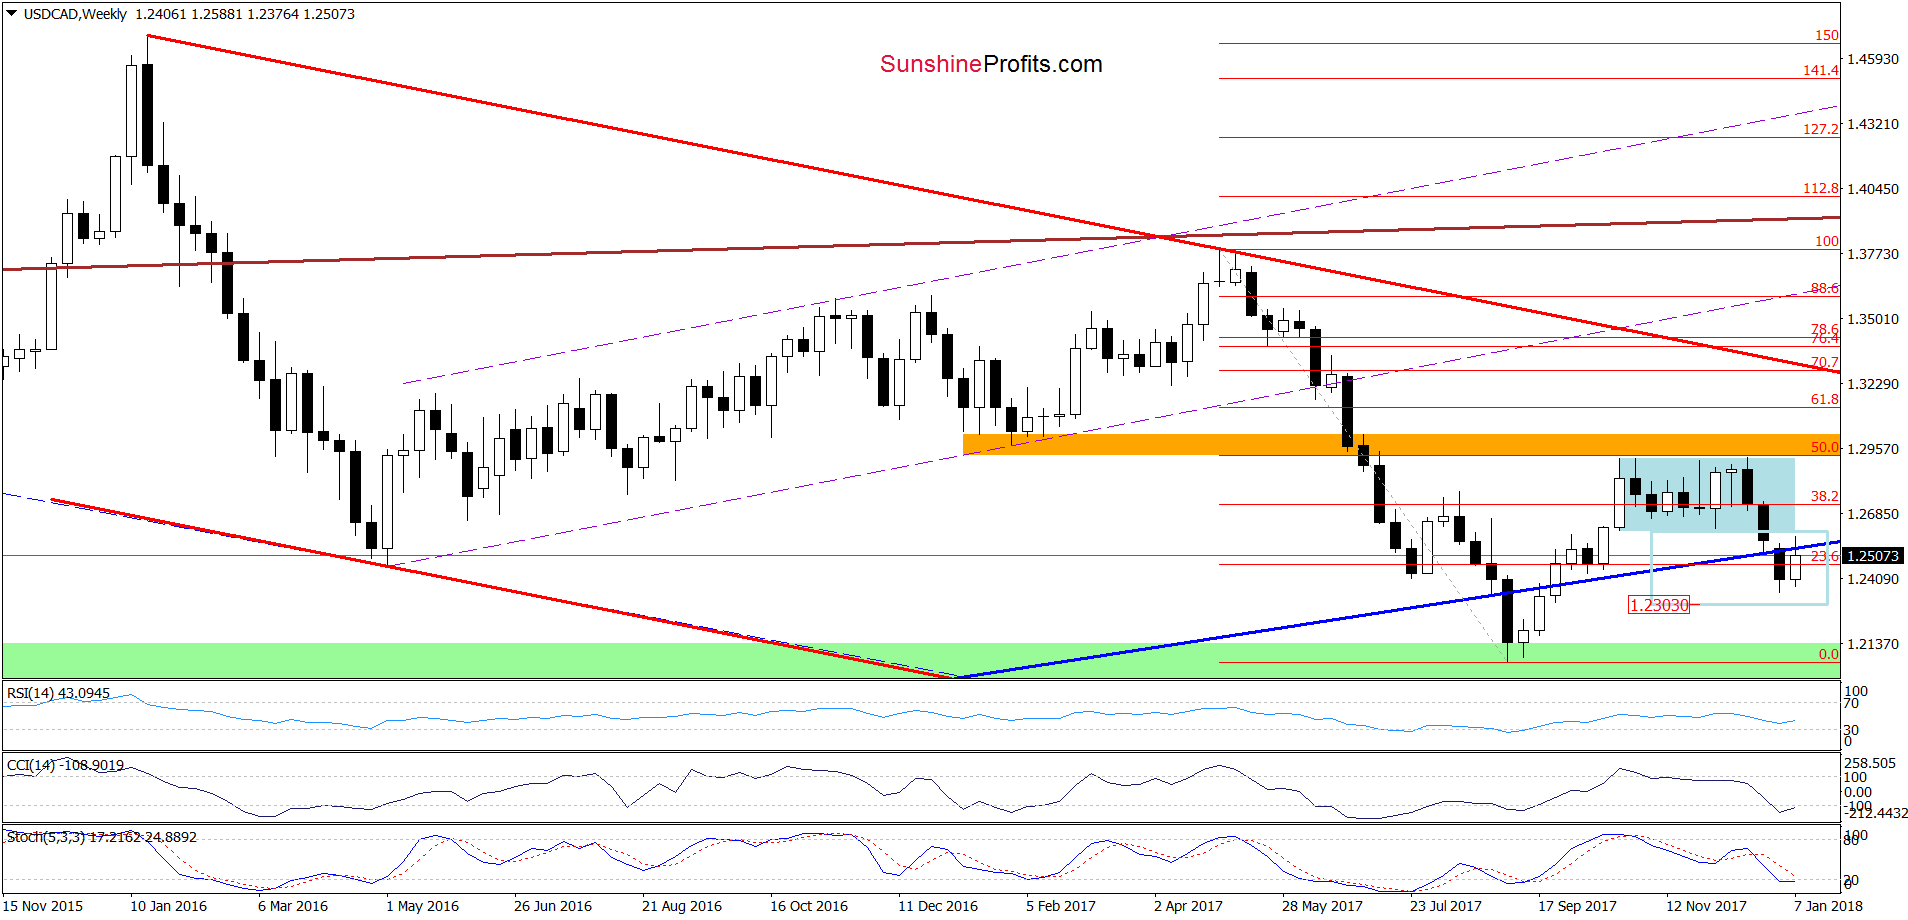
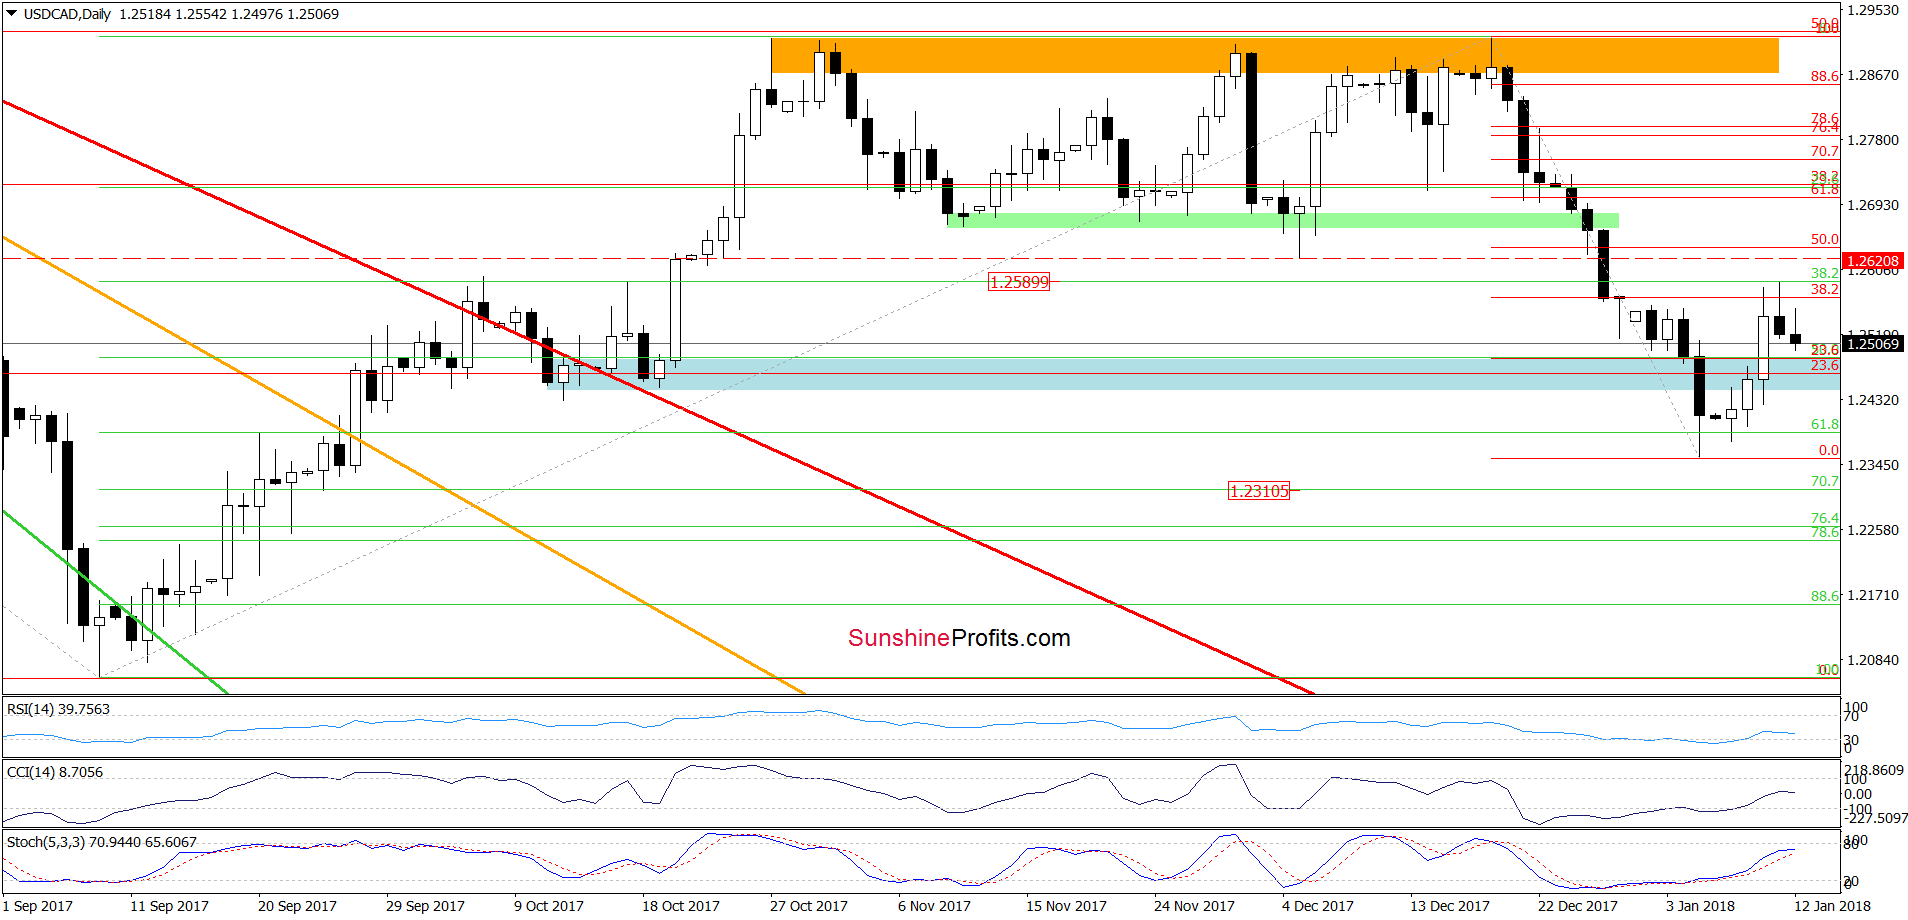
(…) USD/CAD dropped below the blue support zone and tested the 61.80% Fibonacci retracement, which triggered a rebound earlier this week. Although such price action looks like a verification of the earlier breakdown under the blue area, the current position of the daily indicators suggests further improvement, which is in tune with the assumption that USD/CAD could test the previously-broken long-term blue line before another downswing and a drop to our above-mentioned downside target.
As you see on the charts, the situation developed in tune with our assumptions and tested the above-mentioned long-term blue line. What does it mean for the exchange rate? In our opinion, another attempt to move lower.
How low could he pair go if we see such price action? We think that the best answer to this question will be the quote from our last commentary on this currency pair:
(…) Although the pair rebounded slightly this week, the sell signals remain in the cards, which suggests that even if the pair extends gains from current levels, we’ll likely see one more downswing and a drop to around 1.2303, where the size of the downward move will correspond with the height of blue consolidation seen on the (…) chart.
Trading position (short-term; our opinion): no positions are justified from the risk/reward perspective now. We will keep you informed should anything change, or should we see a confirmation/invalidation of the above.
Thank you.
Nadia Simmons
Forex & Oil Trading Strategist
Przemyslaw Radomski, CFA
Founder, Editor-in-chief, Gold & Silver Fund Manager
Gold & Silver Trading Alerts
Forex Trading Alerts
Oil Investment Updates
Oil Trading Alerts

