

After several weeks in a consolidation currency bears finally showed strength and pushed the greenback lower against the Swiss franc during Friday’s session. Thanks to this drop, the exchange rate closed session under supports. What does this mean for the future of this currency pair?
- EUR/USD: none
- GBP/USD: long (a stop-loss order at 1.2642; the upside target at 1.3050)
- USD/JPY: short (a stop-loss order at 114.68; the exit target at 112.34)
- USD/CAD:none
- USD/CHF: short (a stop loss order at 1.0192; the exit target at 0.9850)
- AUD/USD:none
EUR/USD
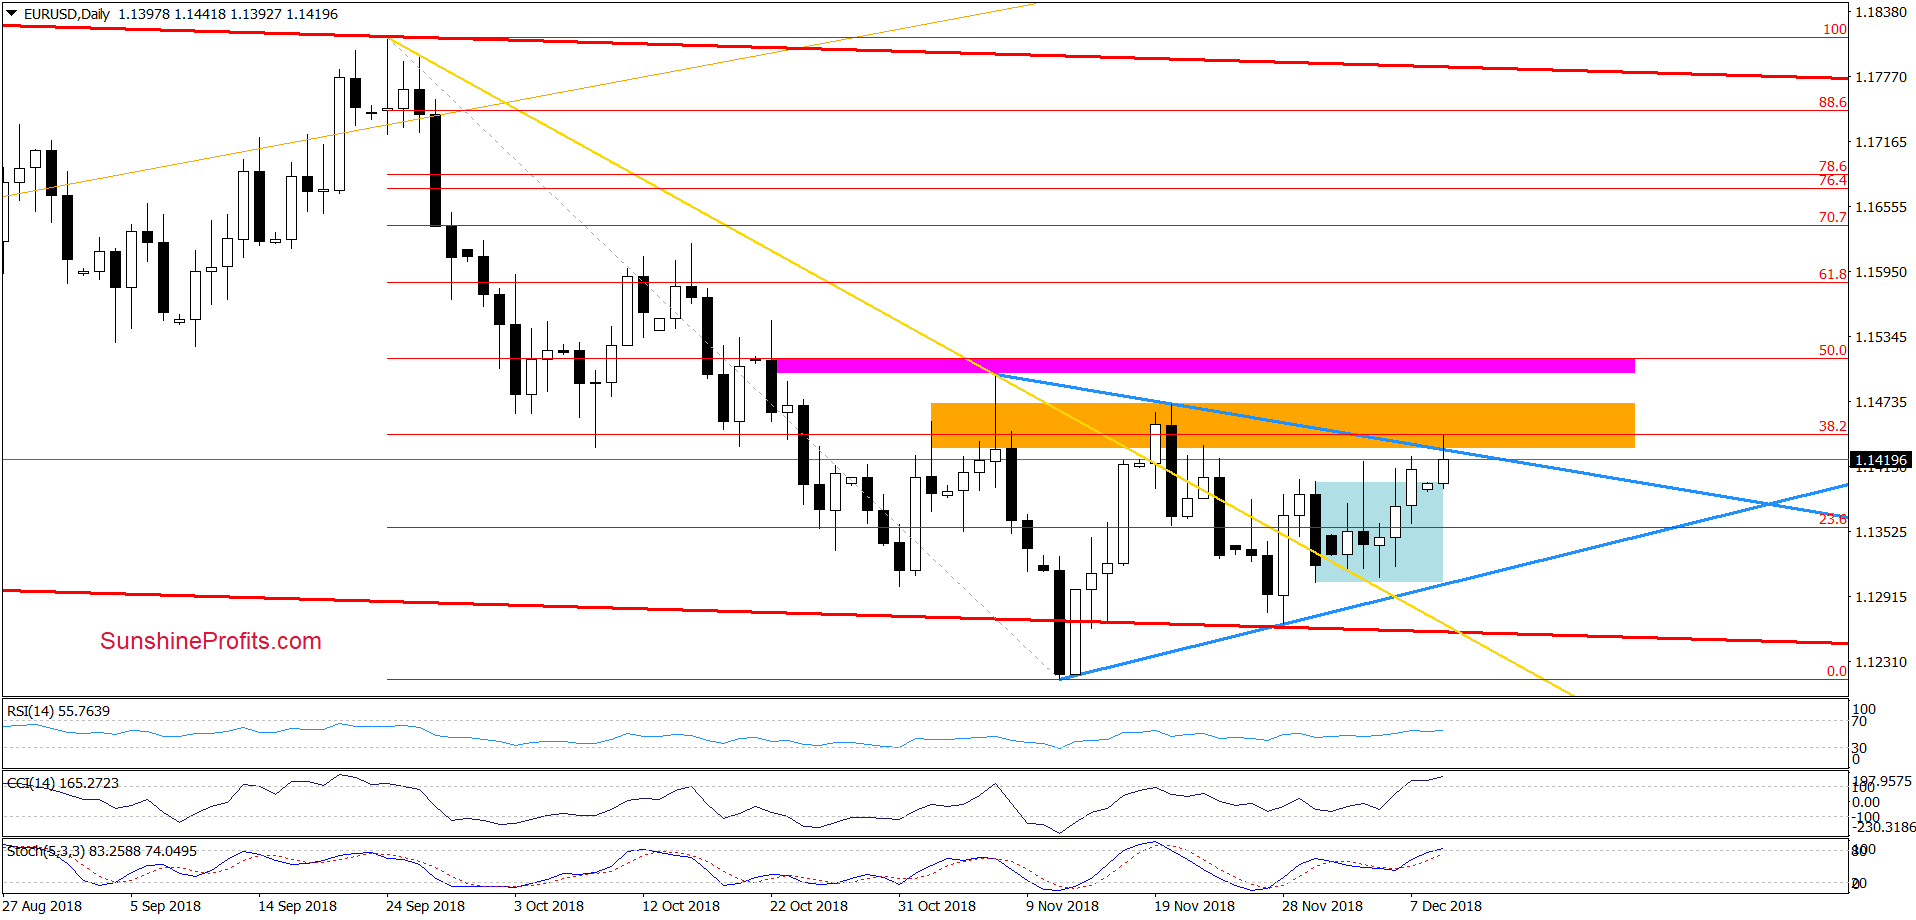
Looking at the daily chart, we see that EUR/USD closed Friday’s session above the upper line of the blue consolidation, which triggered further improvement earlier today.
Thanks to today’s upswing the exchange rate climbed to the orange resistance zone (created by the previous highs and the 38.2% Fibonacci retracement) and the upper line of the blue triangle.
Although this is a positive development, we continue to think that as long as there is no breakout above these important resistances another bigger move is not likely to be seen and one more pullback from here should not surprise us in the coming days.
Nevertheless, if currency bulls show strength and manage to take the exchange rate above these levels. we’ll consider opening long positions.
Trading position (short-term; our opinion): No positions are justified from the risk/reward perspective.
USD/JPY
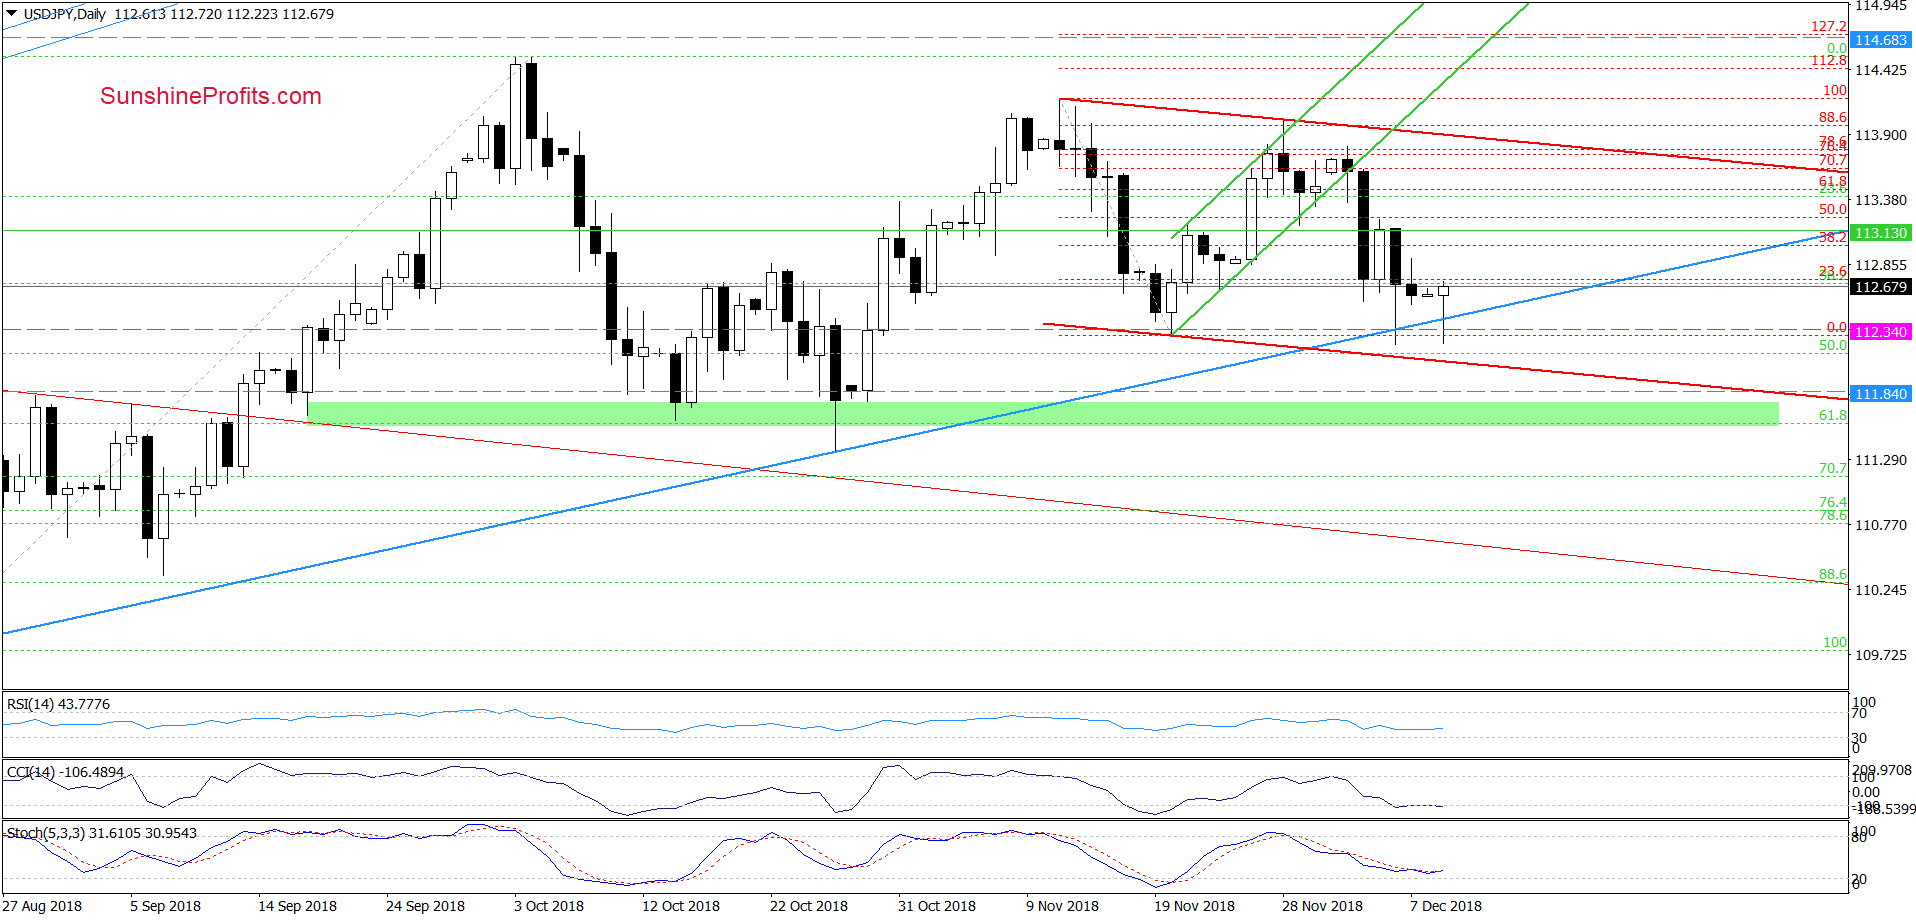
The first thing that catches the eye on the daily chart is today’s re-test of the medium-term blue support line (based on the August and October lows) and the last week’s low. As you see, the combination of these supports encouraged currency bulls to act, which resulted in a rebound in the following hours.
Nevertheless, the medium-term picture of the exchange rate continues to support the sellers and (at least) one more attempt to move lower.
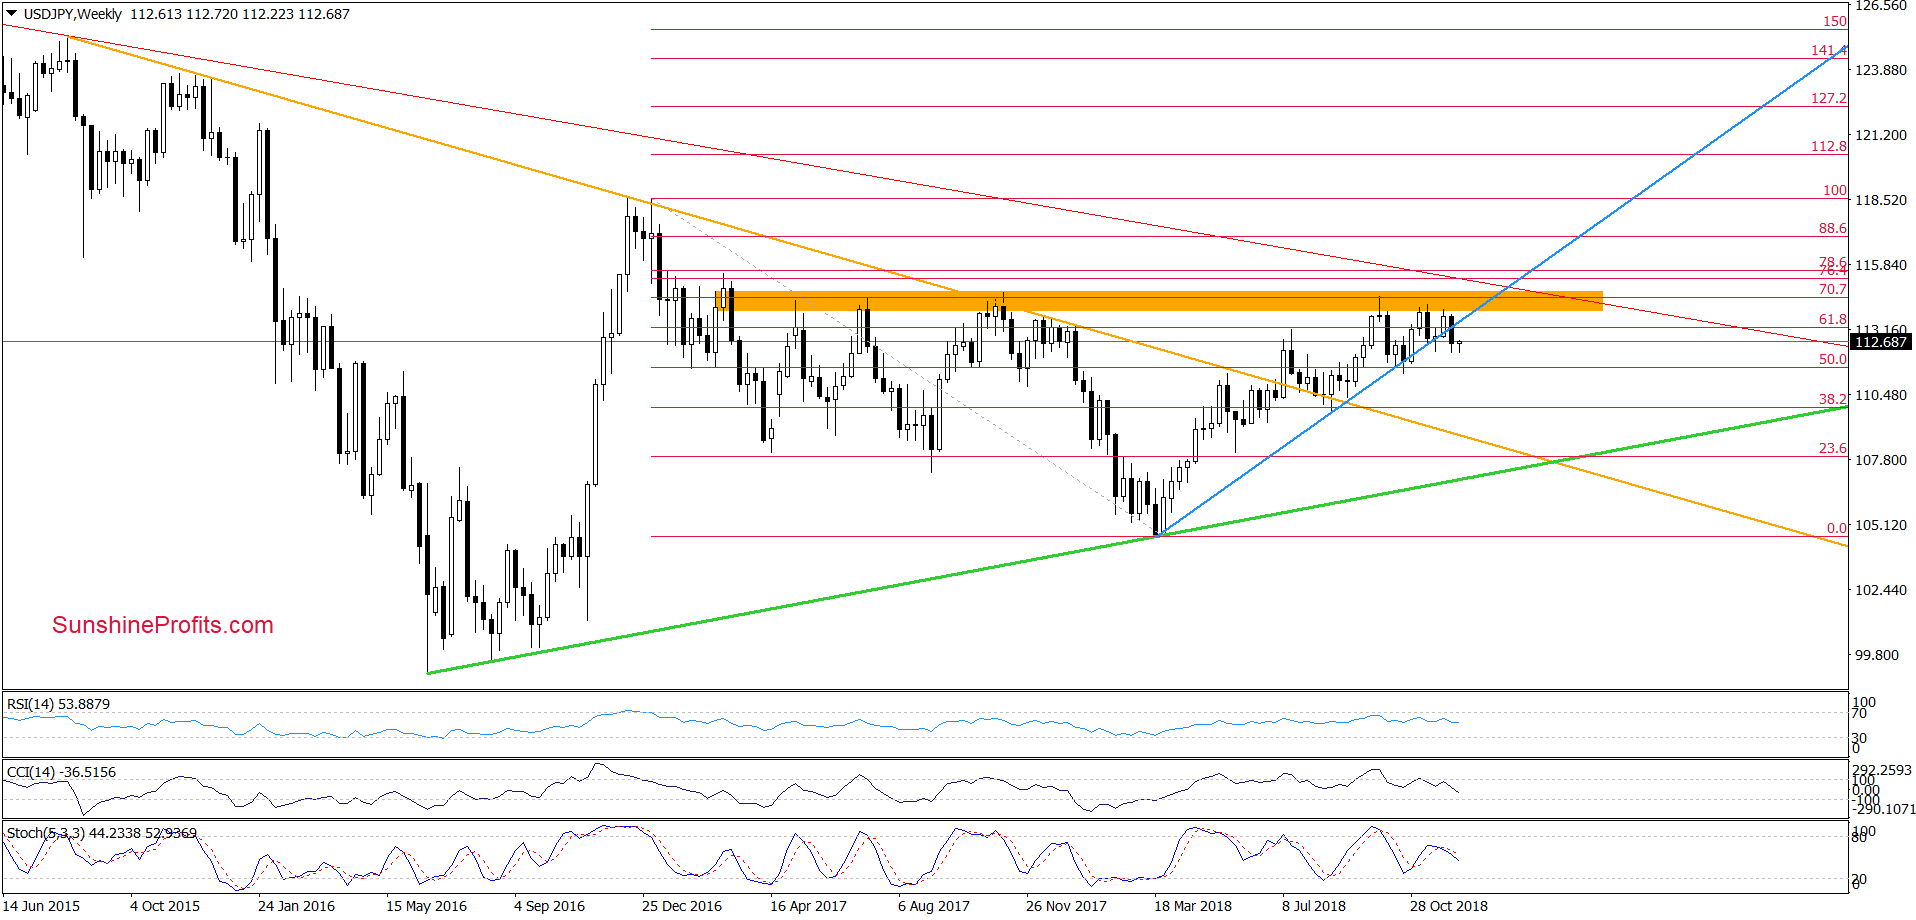
Why? Because USD/JPY closed the previous week not only below the major resistance zone (marked with orange, which continues to keep gains in check since March 2017), but also below the long-term blue line based on the March 2018 and August 2018 lows.
In this way, the pair invalidated the earlier breakout (for the first time successfully for many weeks), which doesn’t bode well for the buyers and higher values of USD/JPY in the broader perspective – especially when we factor in the sell signals generated by the weekly indicators.
Nevertheless, before we see the exchange rate lower a rebound from here and a verification of the last week’s breakdown below the blue line can’t be ruled out.
Trading position (short-term; our opinion): profitable short positions with a stop-loss order at 114.68 and the exit target at 112.34 are justified from the risk/reward perspective.
USD/CHF
In our Forex Trading Alert posted on December 4, 2018, we wrote the following:
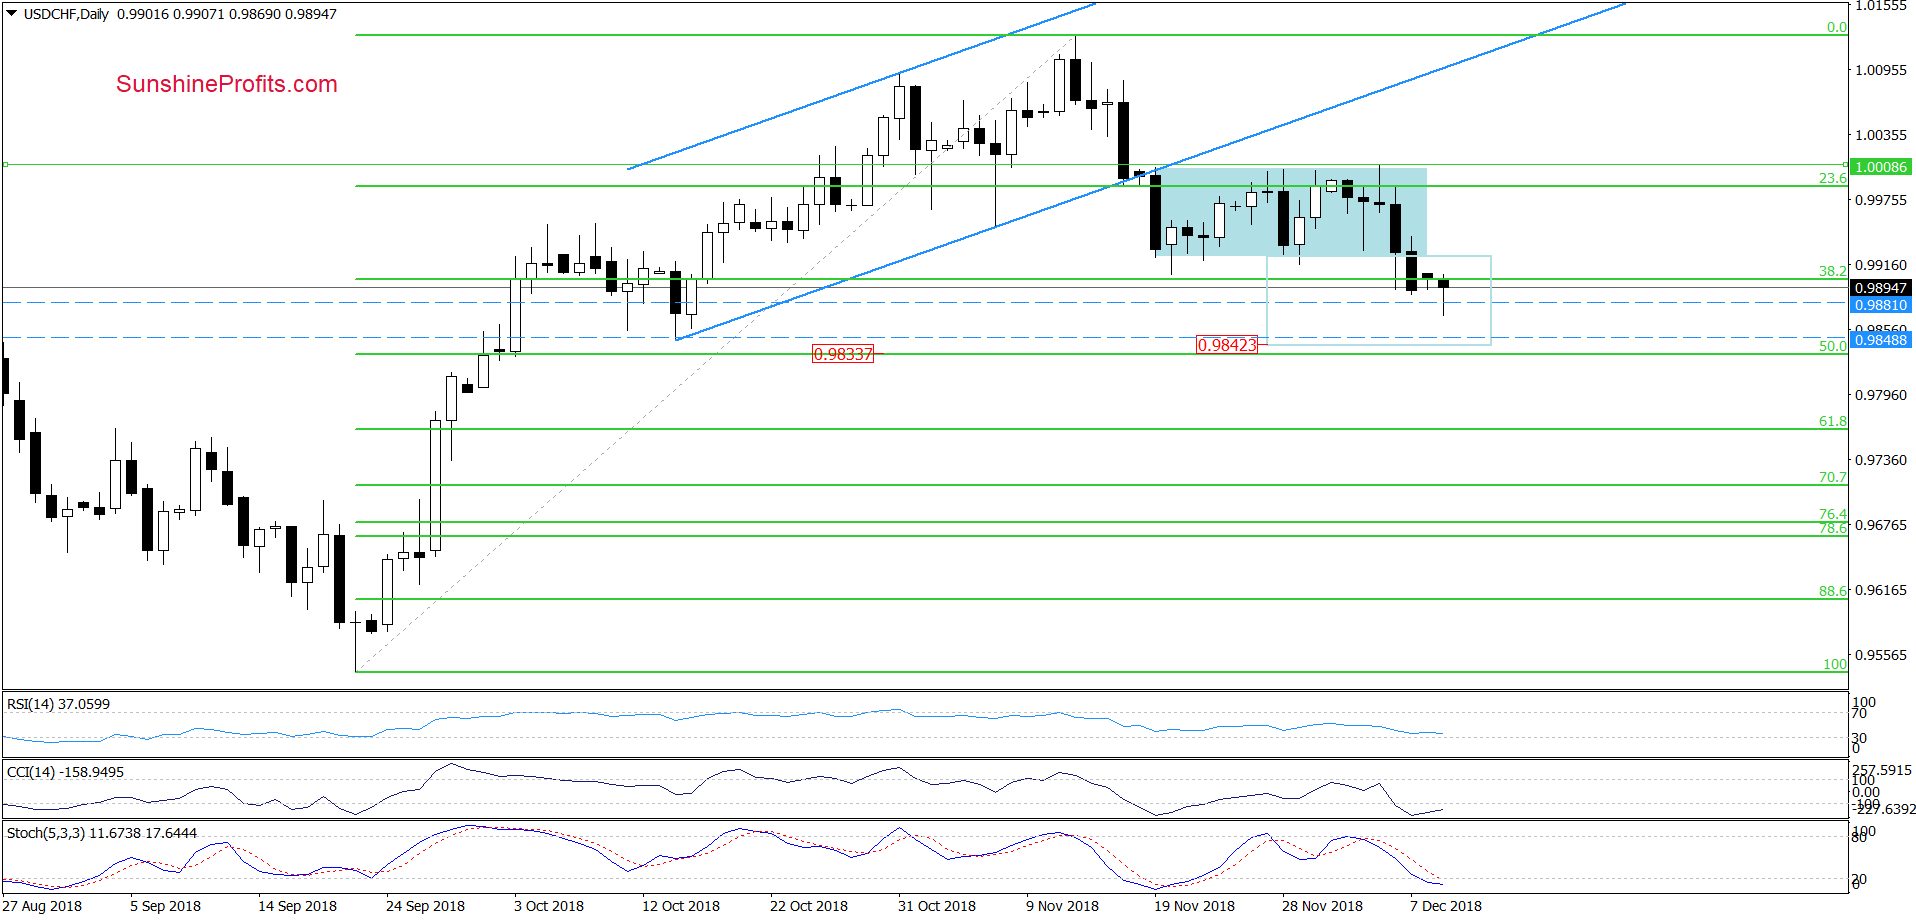
(…) the proximity to the upper border of the blue consolidation (created by an intraday high of the big black candlestick formed on November 19) encouraged currency bears to act once again, which resulted in a quite sharp downswing that erased almost entire recent upward move.
Thanks to this drop, USD/CHF approached the lower border of the blue consolidation once again, which suggests that we’ll see at least a test of the 38.2% Fibonacci retracement in the very near future.
(…), this support (or even a proximity to it) triggered rebounds during recent weeks but taking into account the sell signals re-generated by the daily indicators, it seems that this time currency bears they may be able to break through it.
From today’s point of view, we see that the situation developed in tune with the above scenario and USD/CHF closed Friday’s session under the 38.2% Fibonacci retracement.
Earlier today, this bearish development triggered further deterioration, which in combination with the lack of the buy signals generated by the indicators, suggests that lower values of the exchange rate might be just around the corner.
If this is the case and the pair declines from here we’ll likely see a test of our next downside targets about which we wrote in the previous week:
If they manage to go below the retracement, we’ll likely see a drop to the mid-October lows and the 50% Fibonacci retracement in the following days (around 0.9833-0.9846). At this point it is also worth noting that in this area the size of the downward move will correspond to the height of the blue consolidation, which increases the probability that the sellers will want to make profits in this area.
Trading position (short-term; our opinion): profitable short positions with a stop loss order at 1.0192 and the exit target at 0.9850 are justified from the risk/reward perspective.
Thank you.
Nadia Simmons
Forex & Oil Trading Strategist
Przemyslaw Radomski, CFA
Founder, Editor-in-chief, Gold & Silver Fund Manager
Gold & Silver Trading Alerts
Forex Trading Alerts
Oil Investment Updates
Oil Trading Alerts

