

The price action in USD/CHF doesn't provide too much excitement for over two months. Earlier today, the value of the exchange rate reached the levels that we saw at the end of May. Will we finally see a bigger move to the downside in the coming week?
In our opinion the following forex trading positions are justified - summary:
- EUR/USD: short (a stop-loss order at 1.1833; the initial downside target at 1.1588)
- GBP/USD: short (a stop-loss order at 1.3301; the initial downside target at 1.2913)
- USD/JPY: long (a stop-loss order at 110.21; the initial upside target at 113.50)
- USD/CAD: none
- USD/CHF: none
- AUD/USD: short (a stop-loss order at 0.7510; the initial downside target at 0.7315)
EUR/USD
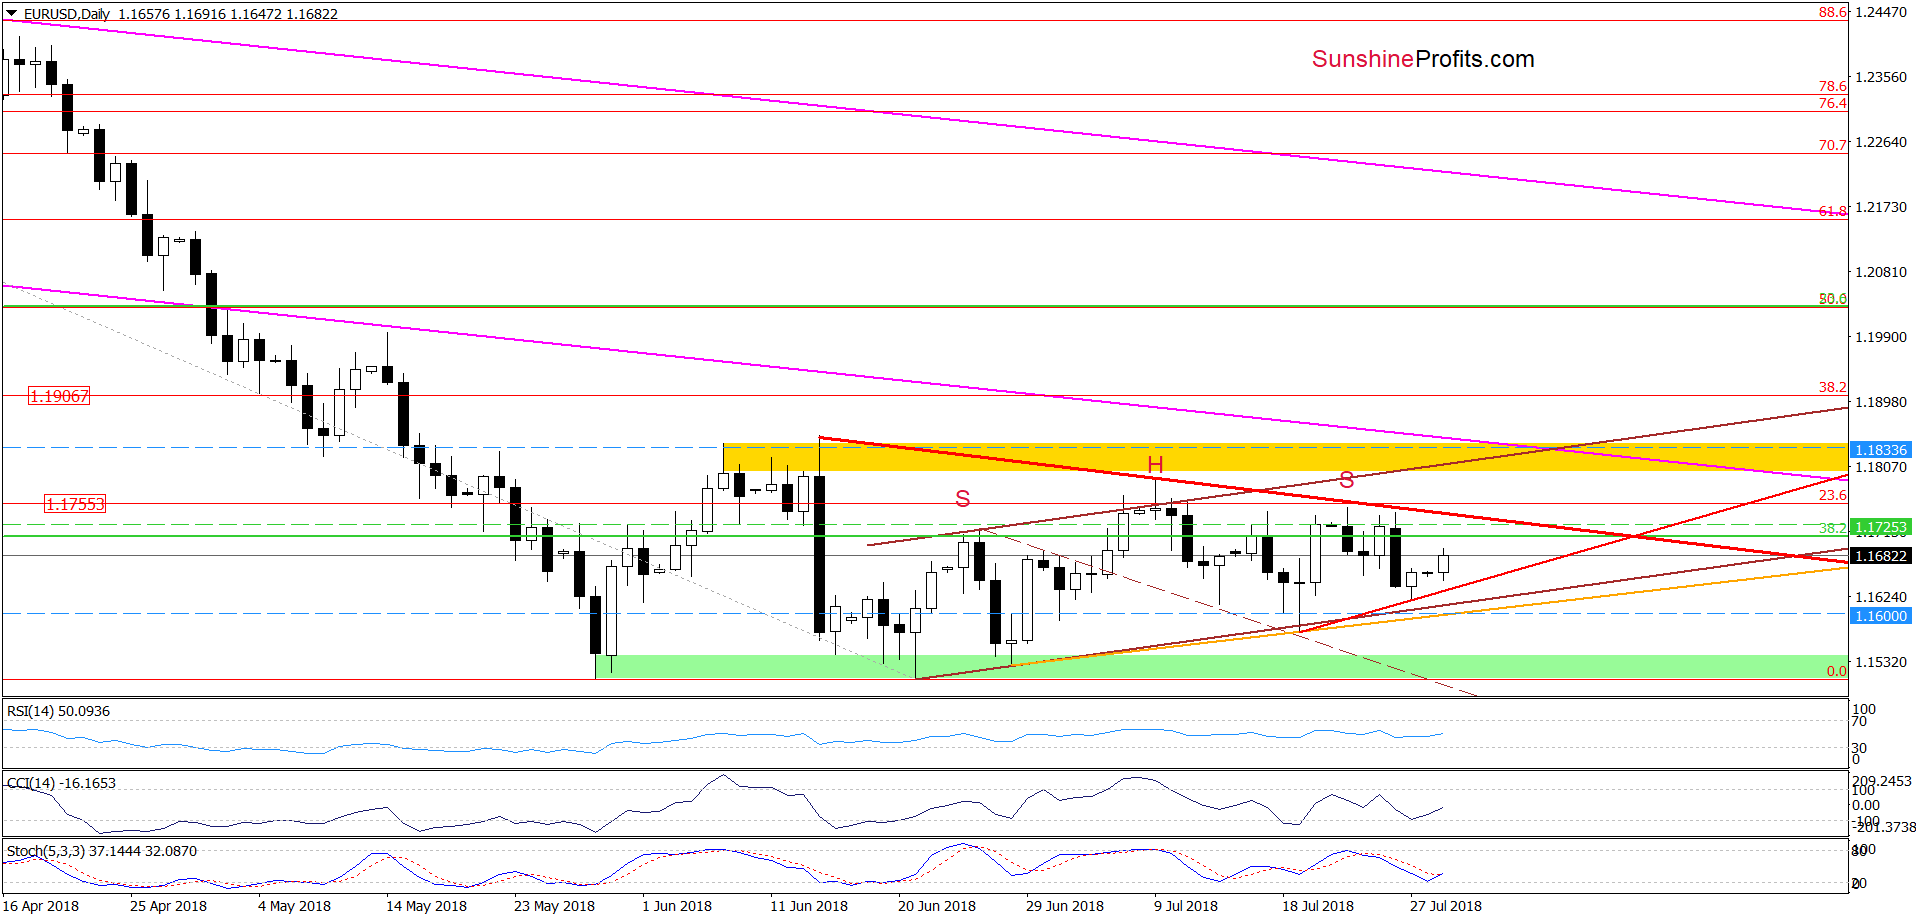
Although EUR/USD increased earlier today, the exchange rate remains not only inside the brown rising trend channel, but also under the red declining resistance line based on the previous highs, which means that the overall situation hasn’t changed much, and a potential pro-bearish formation can’t be ruled out in the coming week.
What formation? We wrote more about it in our Tuesday’s Forex Trading Alert:
(…), we can observe a potential pro-bearish head and shoulders formation. If this is the case, currency bears are just forming the right arm of the pattern, which will likely take EUR/USD to (at least) the neck line marked with orange (and based on the previous lows) in the following days.
Trading position (short-term; our opinion): short positions with a stop-loss order at 1.1833 and the initial downside target at 1.1588 are justified from the risk/reward perspective. We will keep you informed should anything change, or should we see a confirmation/invalidation of the above.
GBP/USD
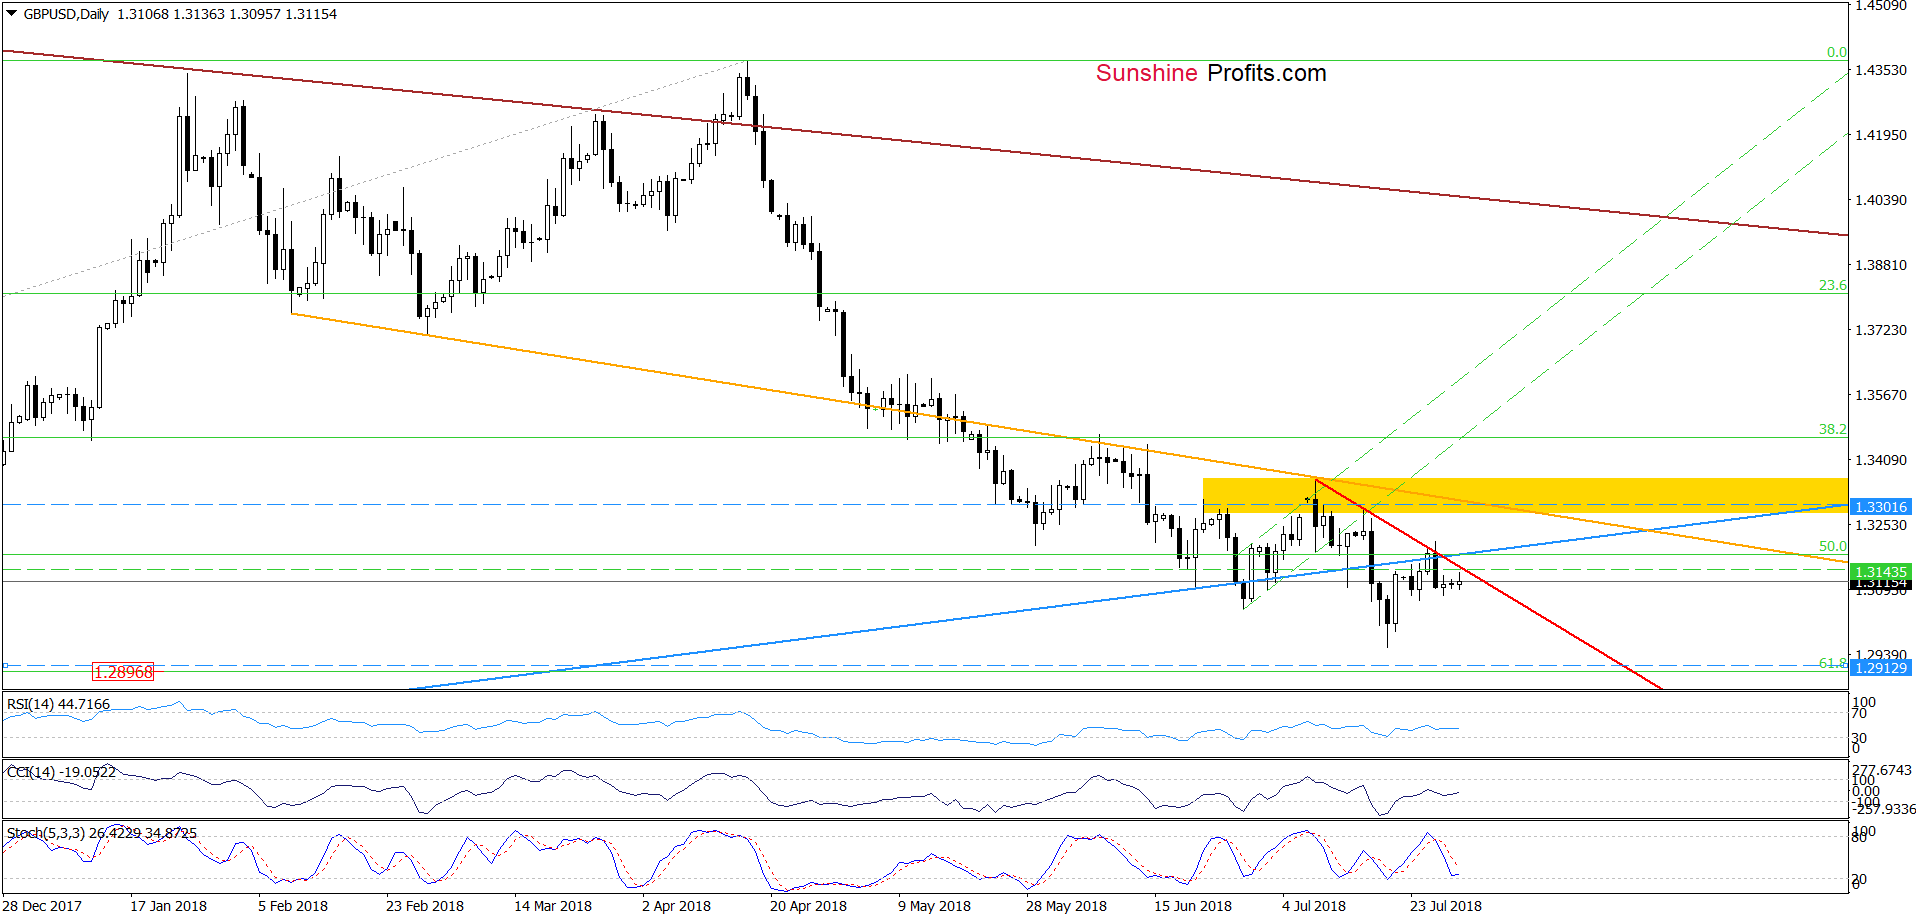
From today’s point of view, we see that the overall situation in GBP/USD hasn’t changed much as the exchange rate is still trading under the previously-broken long-term blue line.
Additionally, the very short-term red declining resistance line based on the previous highs continues to keep gains in check, which together with the sell signal generated by the Stochastic Oscillator suggests further deterioration in the very near future.
If this is the case, and the pair extends losses from here, we’ll likely see not only a test of the recent lows, but also a drop to around 1.2896, where the 61.8% Fibonacci retracement (based on the entire January 2017 – March 2018 upward move) is.
Trading position (short-term; our opinion): Short positions with a stop-loss order at 1.3301 and the initial downside target at 1.2913 are justified from the risk/reward perspective. We will keep you informed should anything change, or should we see a confirmation/invalidation of the above.
USD/CAD
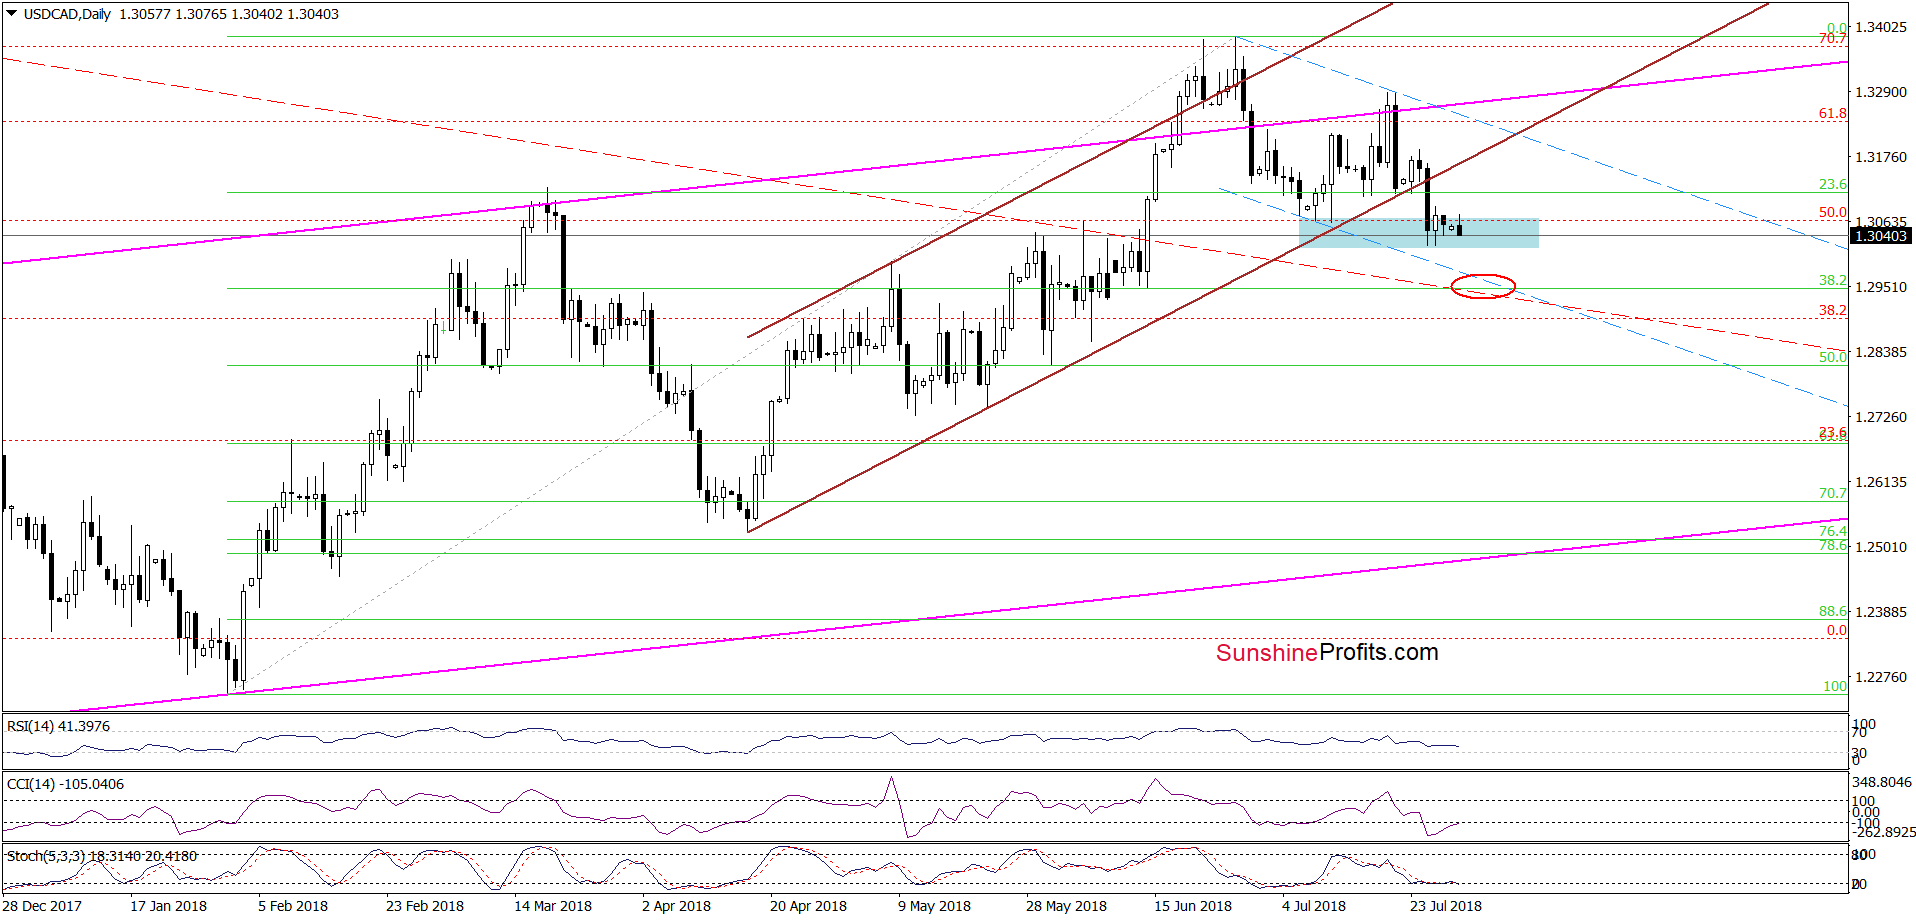
The first thing that catches the eye on the daily chart is the breakdown under the lower border of the brown rising trend channel. Although this bearish development triggered a sharp decline on Wednesday, USD/CAD is trading in a narrow range, which suggests that the strength of sellers may weaken.
Nevertheless, as long as there are no buy signals generated by the indicators, one more downswing and a test of the lower border of the blue declining trend channel (marked with dashed lines) is likely.
At this point it is also worth noting, that around this area (we marked it with the red ellipse) we can also see the 38.2% Fibonacci retracement and the previously-broken long-term red declining support line, which together likely stop the sellers in the following day(s).
Trading position (short-term; our opinion): No positions are justified from the risk/reward perspective. We will keep you informed should anything change, or should we see a confirmation/invalidation of the above.
USD/CHF
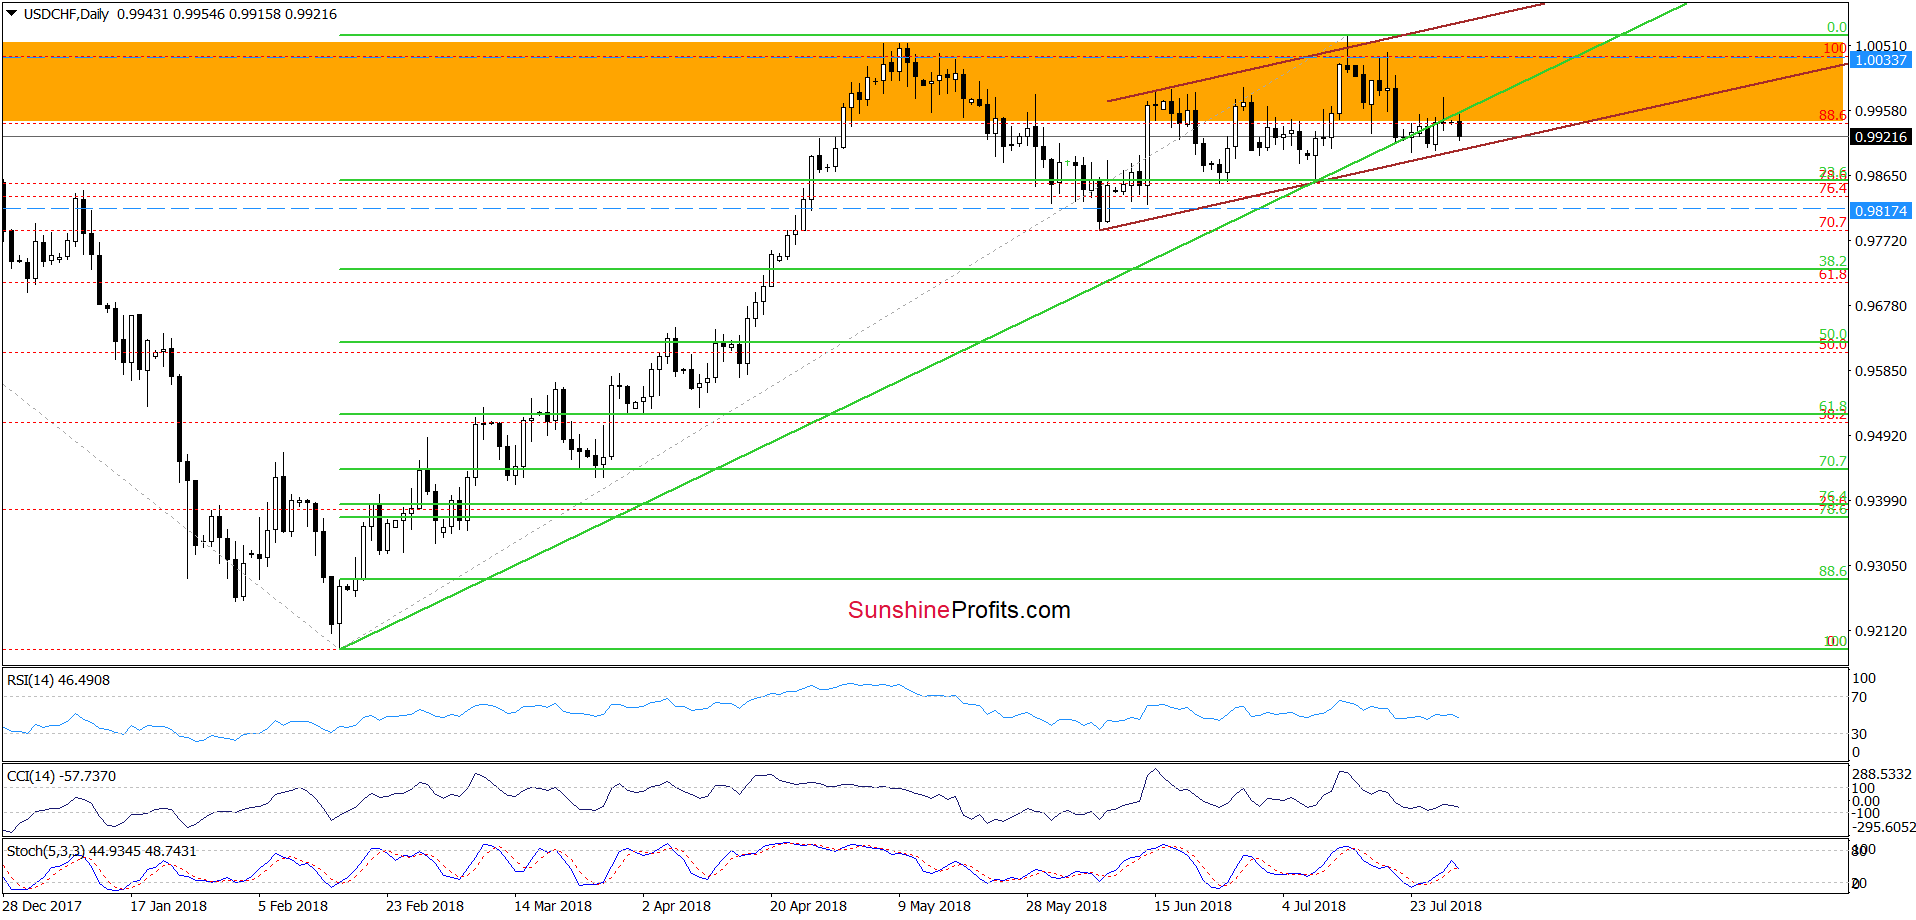
On the daily chart, we see that although USD/CHF declined under the long-term green support line earlier today, the pair is still trading above the lower border of the brown rising trend channel.
Such situation means that as long as there is no confirmed breakdown under this support, a bigger move to the downside is not likely to be seen – especially when we factor in the proximity to the nearest support zone created by the 23.6% Fibonacci retracement, the last June and July lows.
Trading position (short-term; our opinion): No positions are justified from the risk/reward perspective. We will keep you informed should anything change, or should we see a confirmation/invalidation of the above.
Thank you.
Nadia Simmons
Forex & Oil Trading Strategist
Przemyslaw Radomski, CFA
Founder, Editor-in-chief, Gold & Silver Fund Manager
Gold & Silver Trading Alerts
Forex Trading Alerts
Oil Investment Updates
Oil Trading Alerts

