

During Tuesday’s session, the U.S. dollar moved higher against the Swiss franc, which resulted in a breakout above the last week’s high. Earlier today, currency bulls extended gains, but will we see further rally in the coming days?
- EUR/USD: none
- GBP/USD: none
- USD/JPY: long (a stop-loss order at 111.11; the initial upside target at 113.40)
- USD/CAD: none
- USD/CHF: none
- AUD/USD: none
EUR/USD
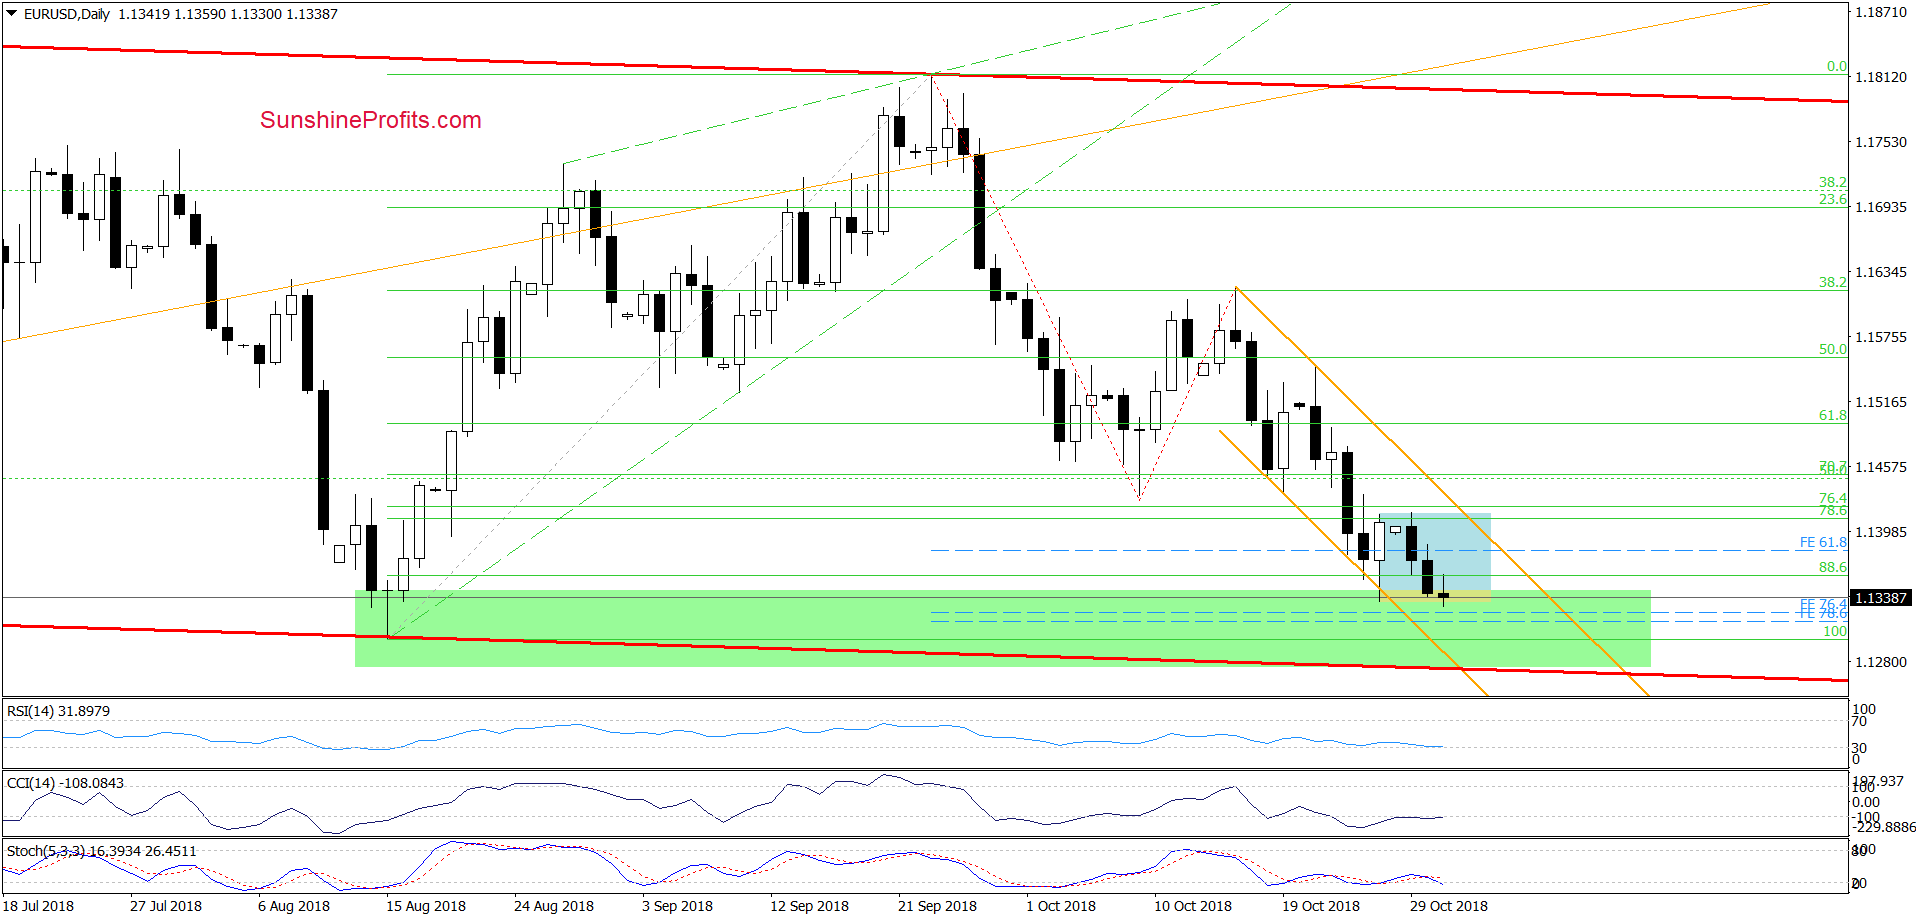
From today’s point of view, we see that although EUR/USD moved a bit lower and hit a fresh October low earlier today, the very short-term picture hasn’t changed much as the exchange rate rebounded slightly and came back to the blue consolidation.
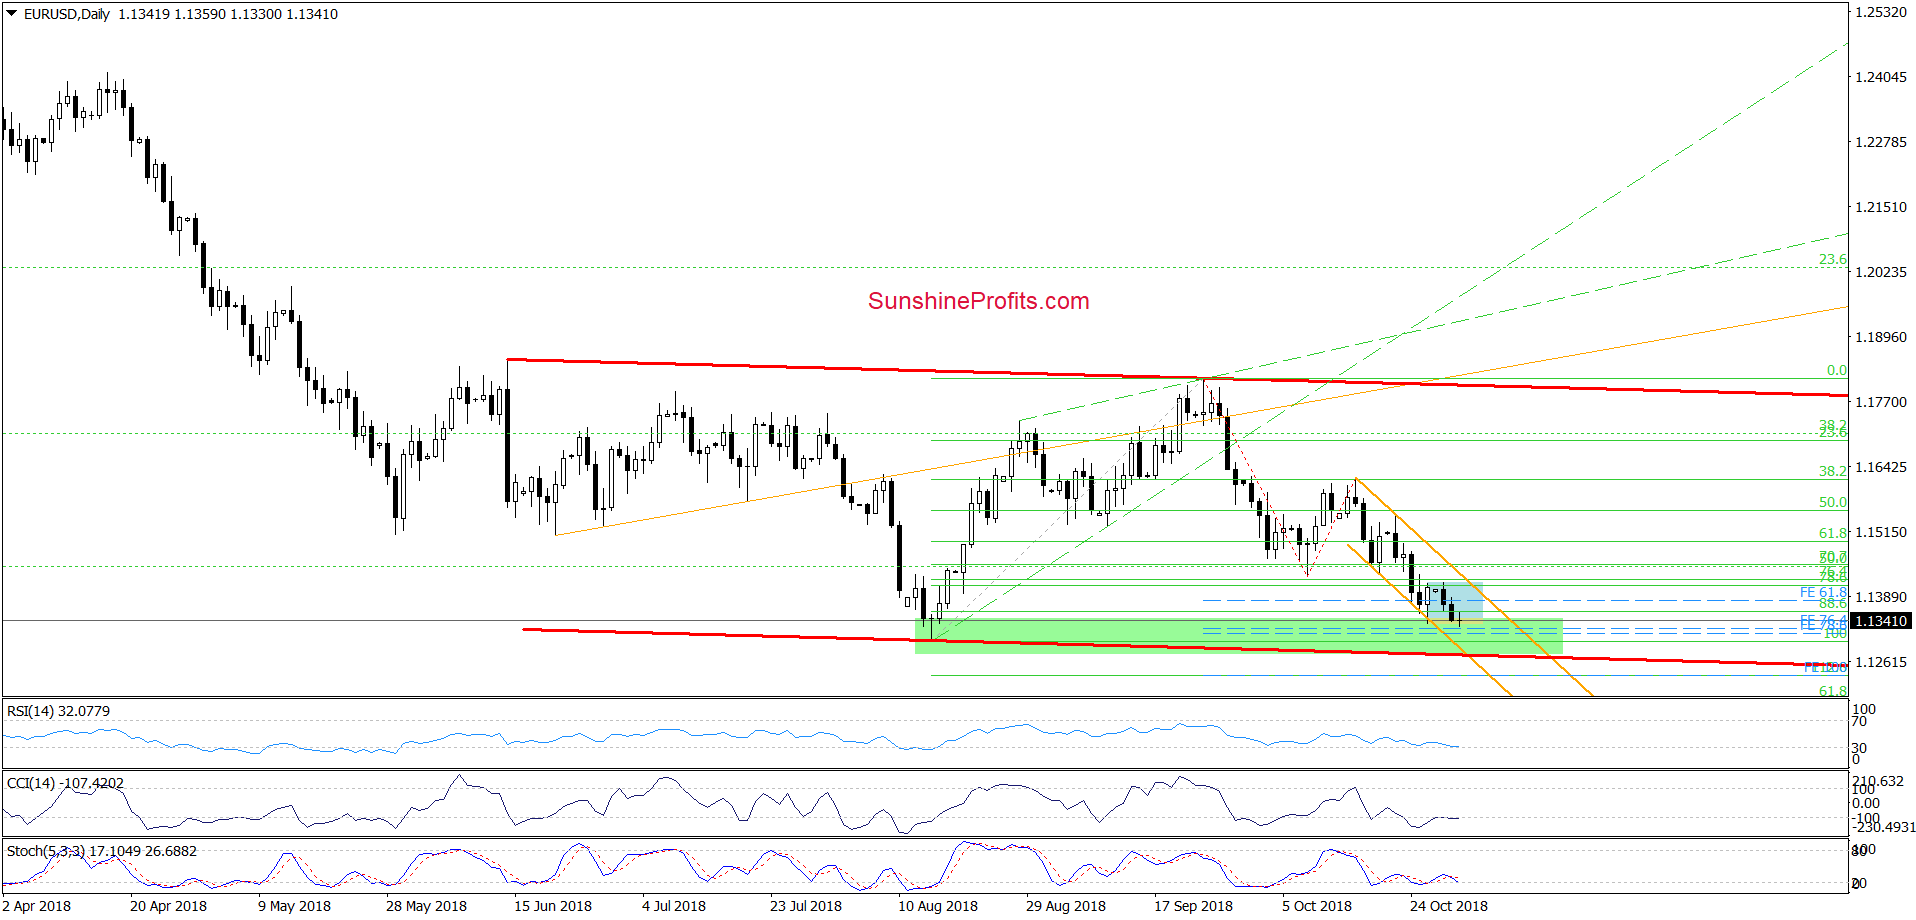
Taking this fact into account, we believe that as long as we do not see a daily closure under the lower line of the consolidation and the last week’s low, lower values of EUR/USD are questionable – especially when we factor in the green support zone and the proximity to the lower border of the red declining trend channel seen more clearly on the chart below.
Connecting the dots, waiting at the sidelines for another profitable opportunity is justified from the risk/reward perspective.
Trading position (short-term; our opinion): None positions are justified from the risk/reward perspective. We will keep you informed should anything change, or should we see a confirmation/invalidation of the above.
GBP/USD
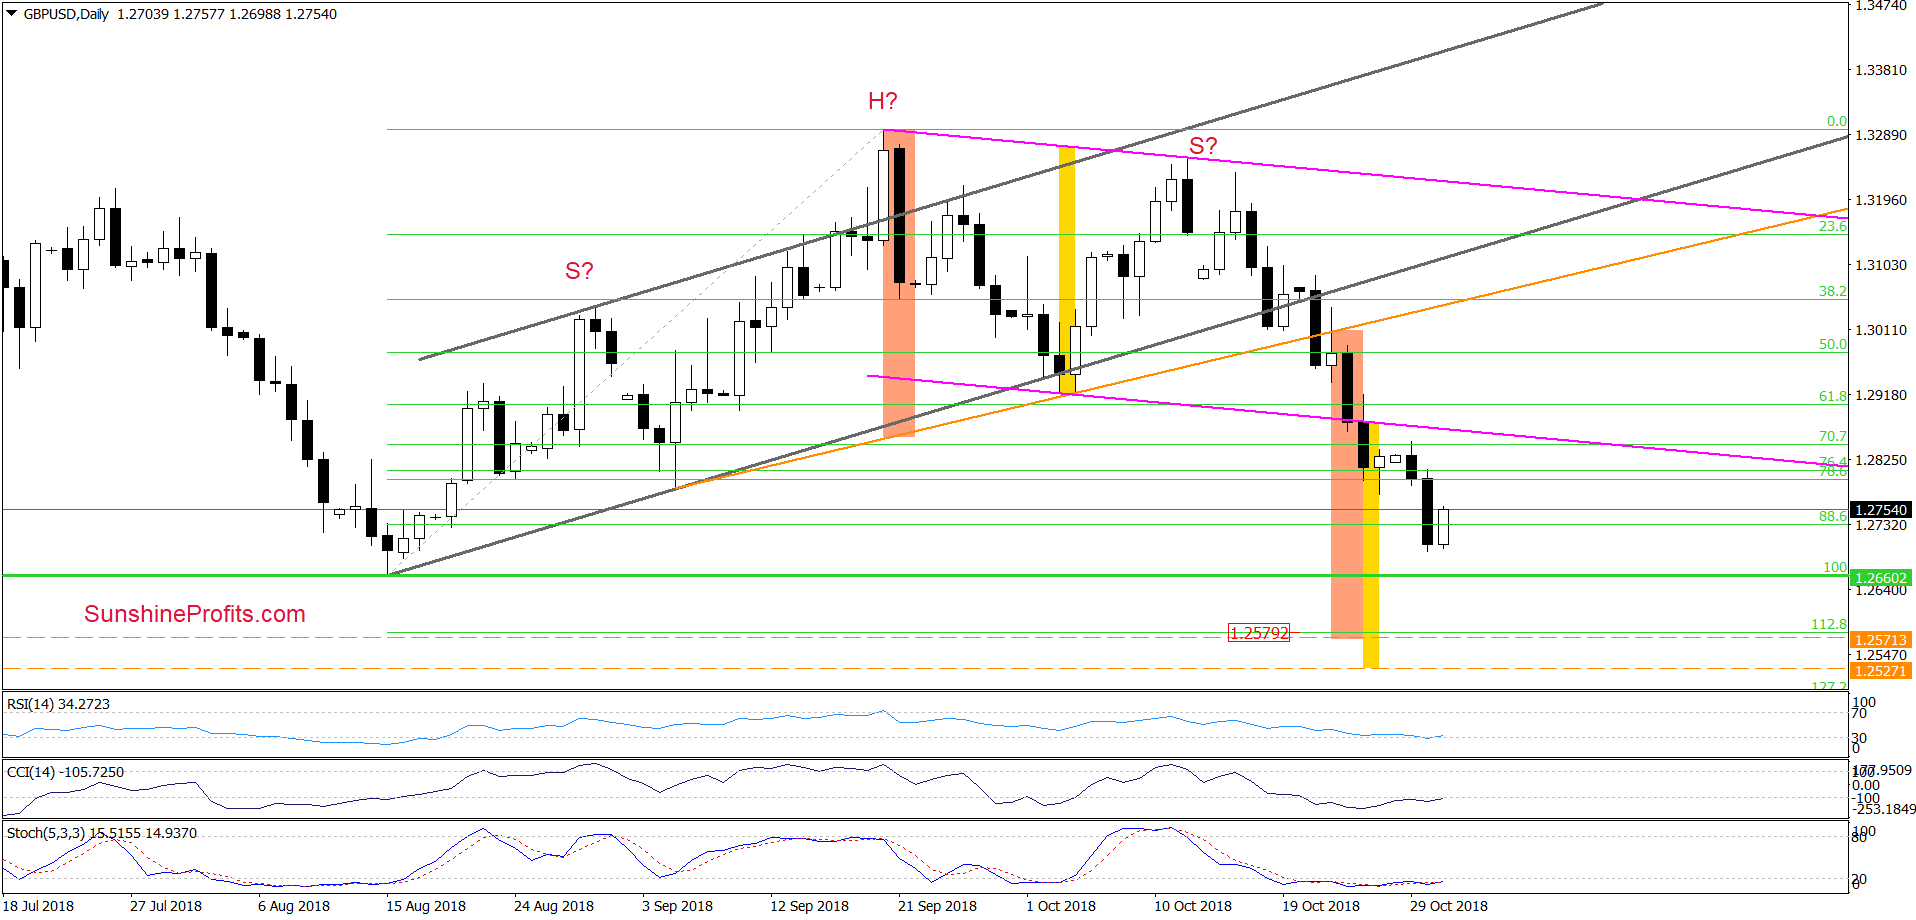
Looking at the daily chart, we see that currency bears broke below the early-October in the previous week, which resulted in a test of the lower border of the pink declining trend channel. Unfortunately (for the bulls) it didn’t withstood the selling pressure, which caused the breakdown and further deterioration in the following days.
Taking this bearish development into account, it seems that GBP/USD could not only test the mid-August low, but also drop to the 112.8% Fibonacci extension around 1.2580 (in this area the size of the downward move would correspond to the height of the head and shoulders formation – marked with an orange rectangle) or even lower (around 1.2527 the size of declines would be equal to the height of the pink declining trend channel).
Nevertheless, the current position of the indicators suggests that currency bulls will fight for higher values of the exchange rate in the very near future. If this is the case and the pair moves higher from here, we’ll likely see a test of the previously-broken lower border of the pink declining trend channel in coming days.
Will we see a realization of the above-mentioned pro-bearish scenario at the beginning of the next month?
In our opinion, it depends on the strength of the bulls around the lower border of the pink channel. If they show weakness, their opponents will surely use it in their favor. However, if they succeed and came back into the channel, the way to higher levels will probably be open. We will keep you informed should anything change, or should we see a confirmation/invalidation of the above.
Trading position (short-term; our opinion): None positions are justified from the risk/reward perspective.
USD/CHF
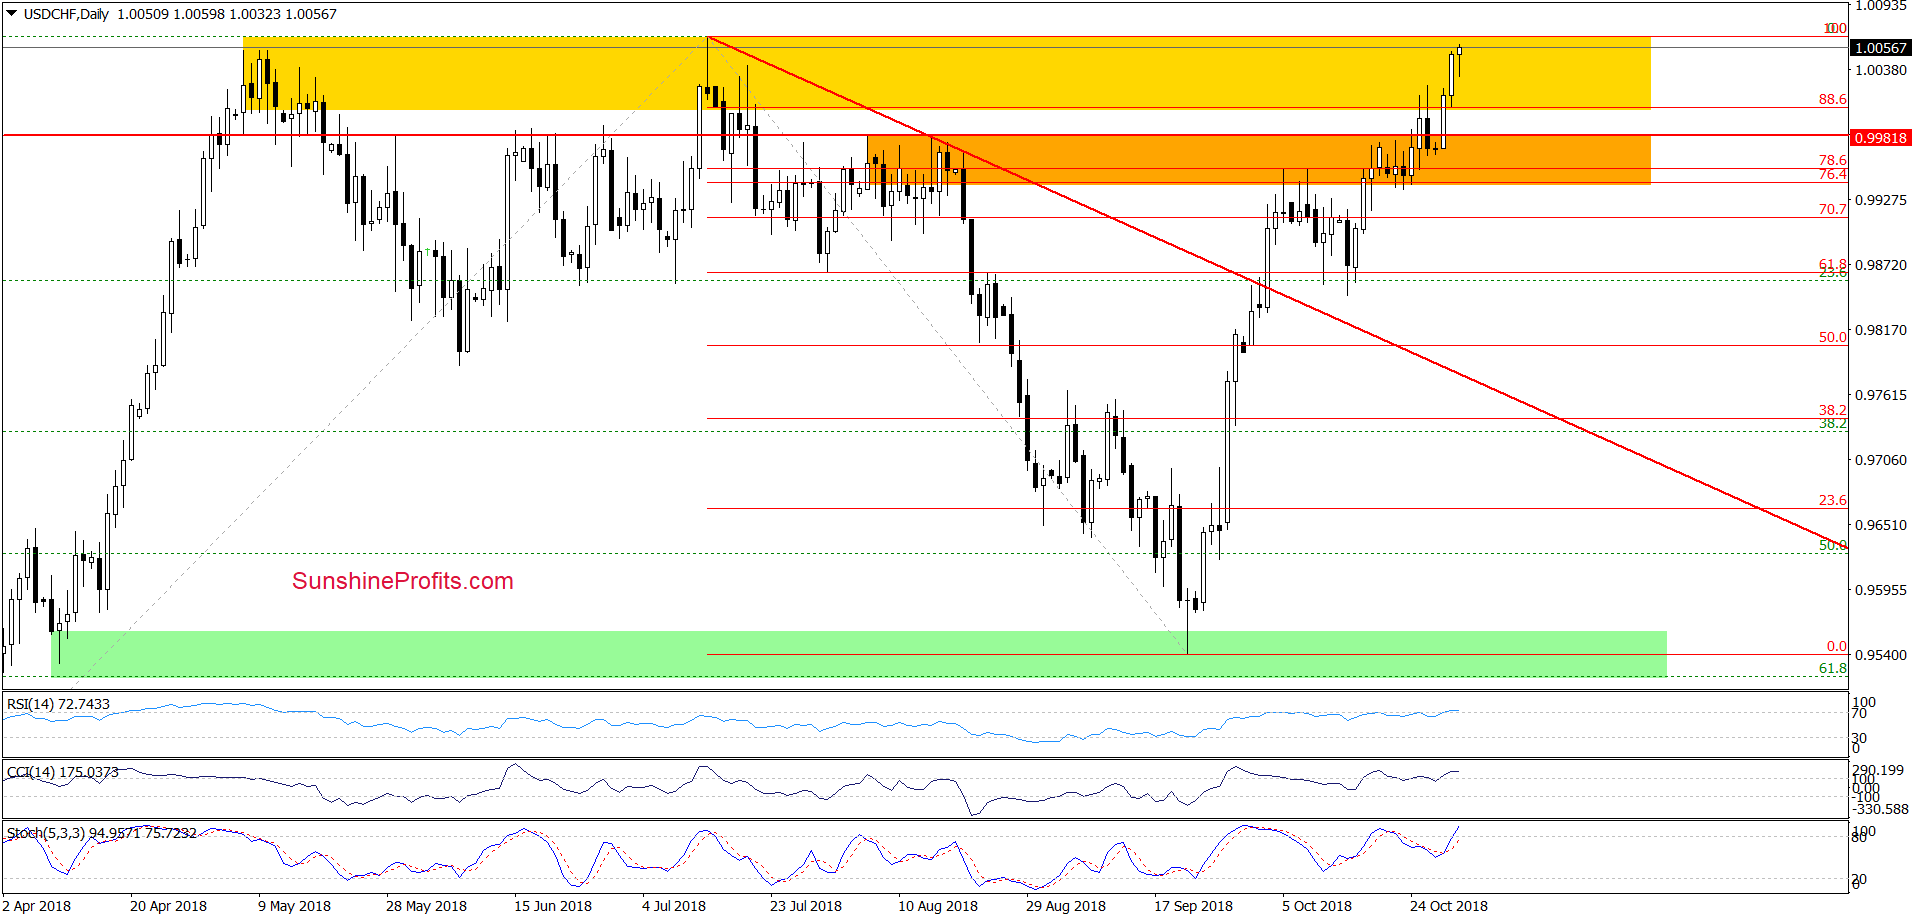
Yesterday, USD/CHF extended gains and broke above the Friday's peak, which triggered further improvement during today’s session. As a result, the pair approached the mid-July high and the upper border of the yellow resistance zone.
Will we see further rally in the following days?
Although the Stochastic Oscillator generated a buy signal again, supporting the buyers, we should keep in mind the levels of the RSI and the CCI (they remain in their overbought areas), the bearish divergences between these indicators and the exchange rate and the fact that they are very close to generating sell signals.
Additionally, even if currency bulls show strength and push the pair higher, they will have to face another resistance zone in the very near future. What do we mean by that? Let’s take a look at the weekly chart below.
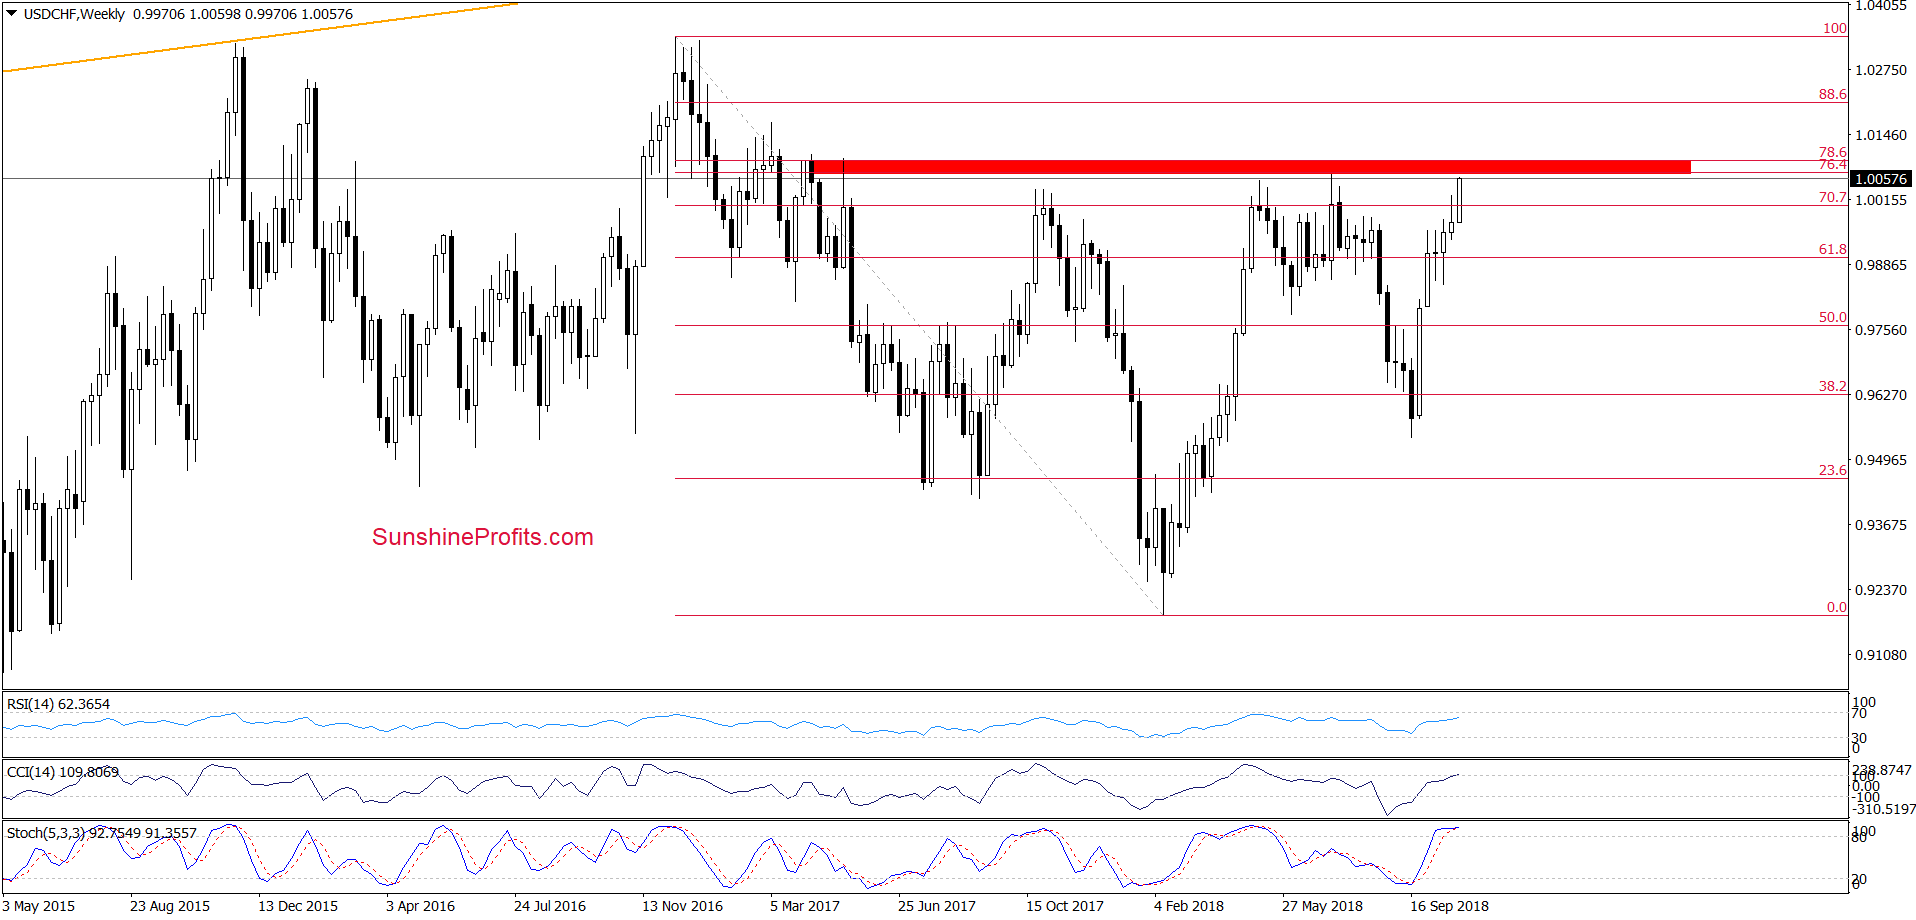
From this perspective, we see that USD/CHF also approached the red resistance zone created by the 76.4% ad the 78.6% Fibonacci retracements, which was strong enough to trigger a reversal in May and July.
Therefore, in our opinion, further rally and a test of December 2016 peak will be more likely and reliable only if we see a successful breakout above the above-mentioned red zone. Until this time, one more reversal should not surprise us.
If the situation develops in line with the above assumptions and currency bulls show weakness in the coming days, we’ll consider opening shot positions. We will keep you informed should anything change, or should we see a confirmation/invalidation of the above.
Trading position (short-term; our opinion): No positions are justified from the risk/reward perspective, but if currency bulls show weakness in the coming days, we’ll consider opening shot positions.
Thank you.
Nadia Simmons
Forex & Oil Trading Strategist
Przemyslaw Radomski, CFA
Founder, Editor-in-chief, Gold & Silver Fund Manager
Gold & Silver Trading Alerts
Forex Trading Alerts
Oil Investment Updates
Oil Trading Alerts

