

On Monday, currency bulls managed to break above the October peak and close the day above it. Despite this positive development and today’s earlier upswing, the greenback pulled back against the Swiss franc. Will the buyers trigger further improvement in the following days?
- EUR/USD: none
- GBP/USD: none
- USD/JPY: short (a stop-loss order at 114.62; the initial downside target at 111.84)
- USD/CAD: short (a stop-loss order at 1.3401; the initial downside target at 1.2934)
- USD/CHF: short (a stop loss order at 1.0192; the initial downside target at 0.9881)
- AUD/USD: none
EUR/USD
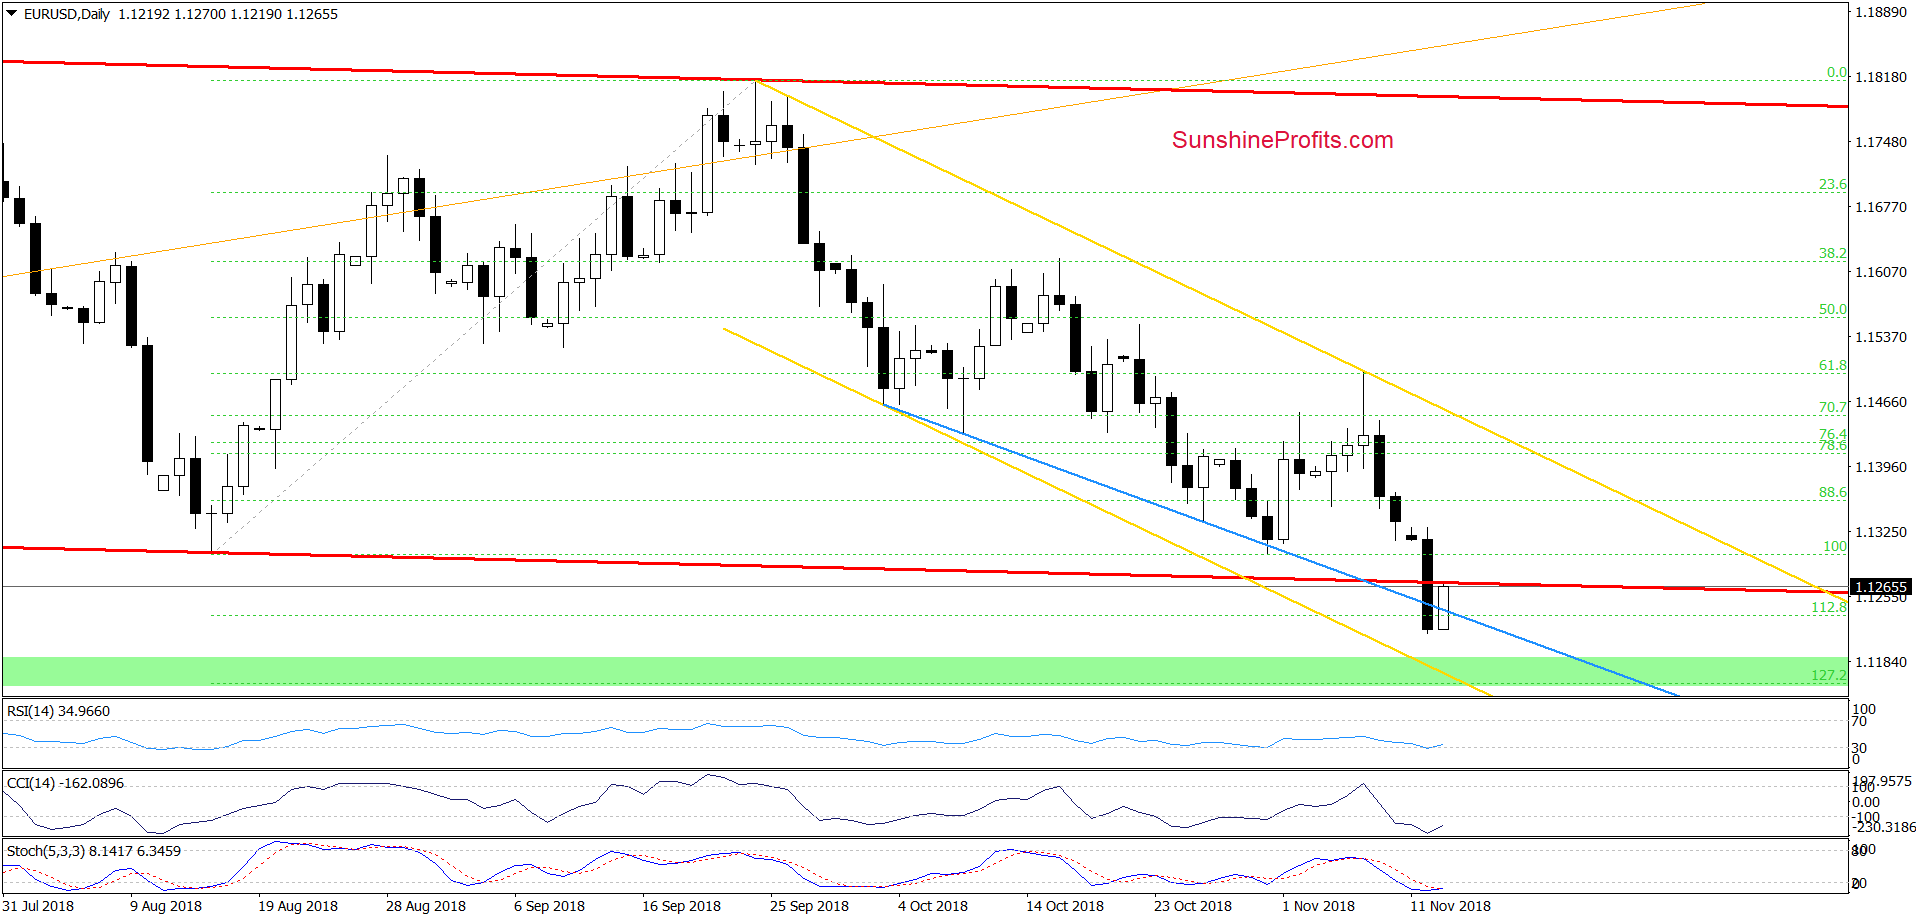
Yesterday, EUR/USD moved sharply lower, which resulted in a breakdown under the lower border of the red declining trend channel and the 112.8% Fibonacci extension. Additionally, the exchange rate closed Monday’s session under these supports and also below the blue support line based on the previous lows.
Despite this bearish combination of technical factors, currency bulls triggered a rebound and EUR/USD increased to the lower line of the red channel earlier today. Such price action looks like a verification of the earlier breakdown and suggests that one more downswing could be just ahead of us.
Nevertheless, in our opinion the space for declines may be limited. Why? Because not far from current levels currency bulls can find support about which we wrote yesterday:
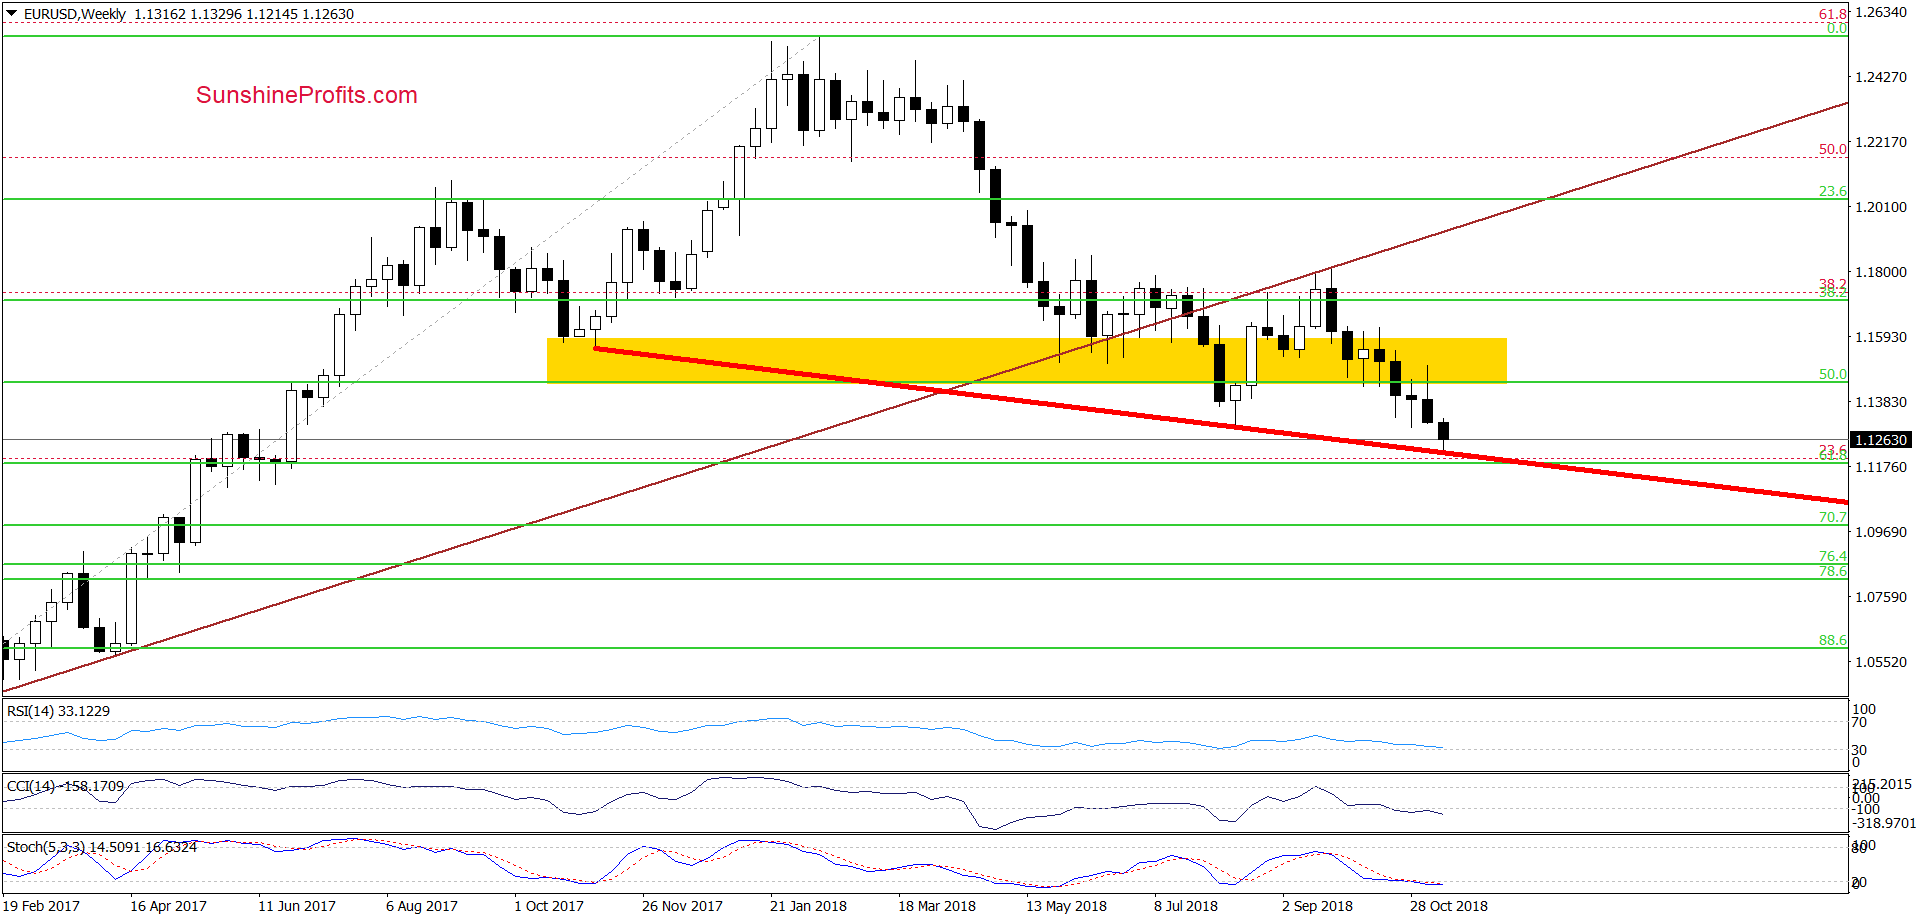
(…) In our opinion, if the sellers trigger another downswing, the exchange rate will likely test the green support zone created by the 61.8% Fibonacci retracement (based on the entire January 2017-February 2018 upward move and seen more clearly on the weekly chart below) and the 127.2% Fibonacci extension (based on the mid-August – last-September increases).
What’s interesting, this support area is also reinforced by the red declining line based on November 2017 and mid-August 2018 lows, which could be the neck line of a potential head and shoulders top formation.
Connecting the dots, we think that as long as there is no breakdown below the above-mentioned support area, the space for declines is limited and reversal in the coming days is likely.
Trading position (short-term; our opinion): None positions are justified from the risk/reward perspective after the stop-loss order closed our short positions.
USD/CAD
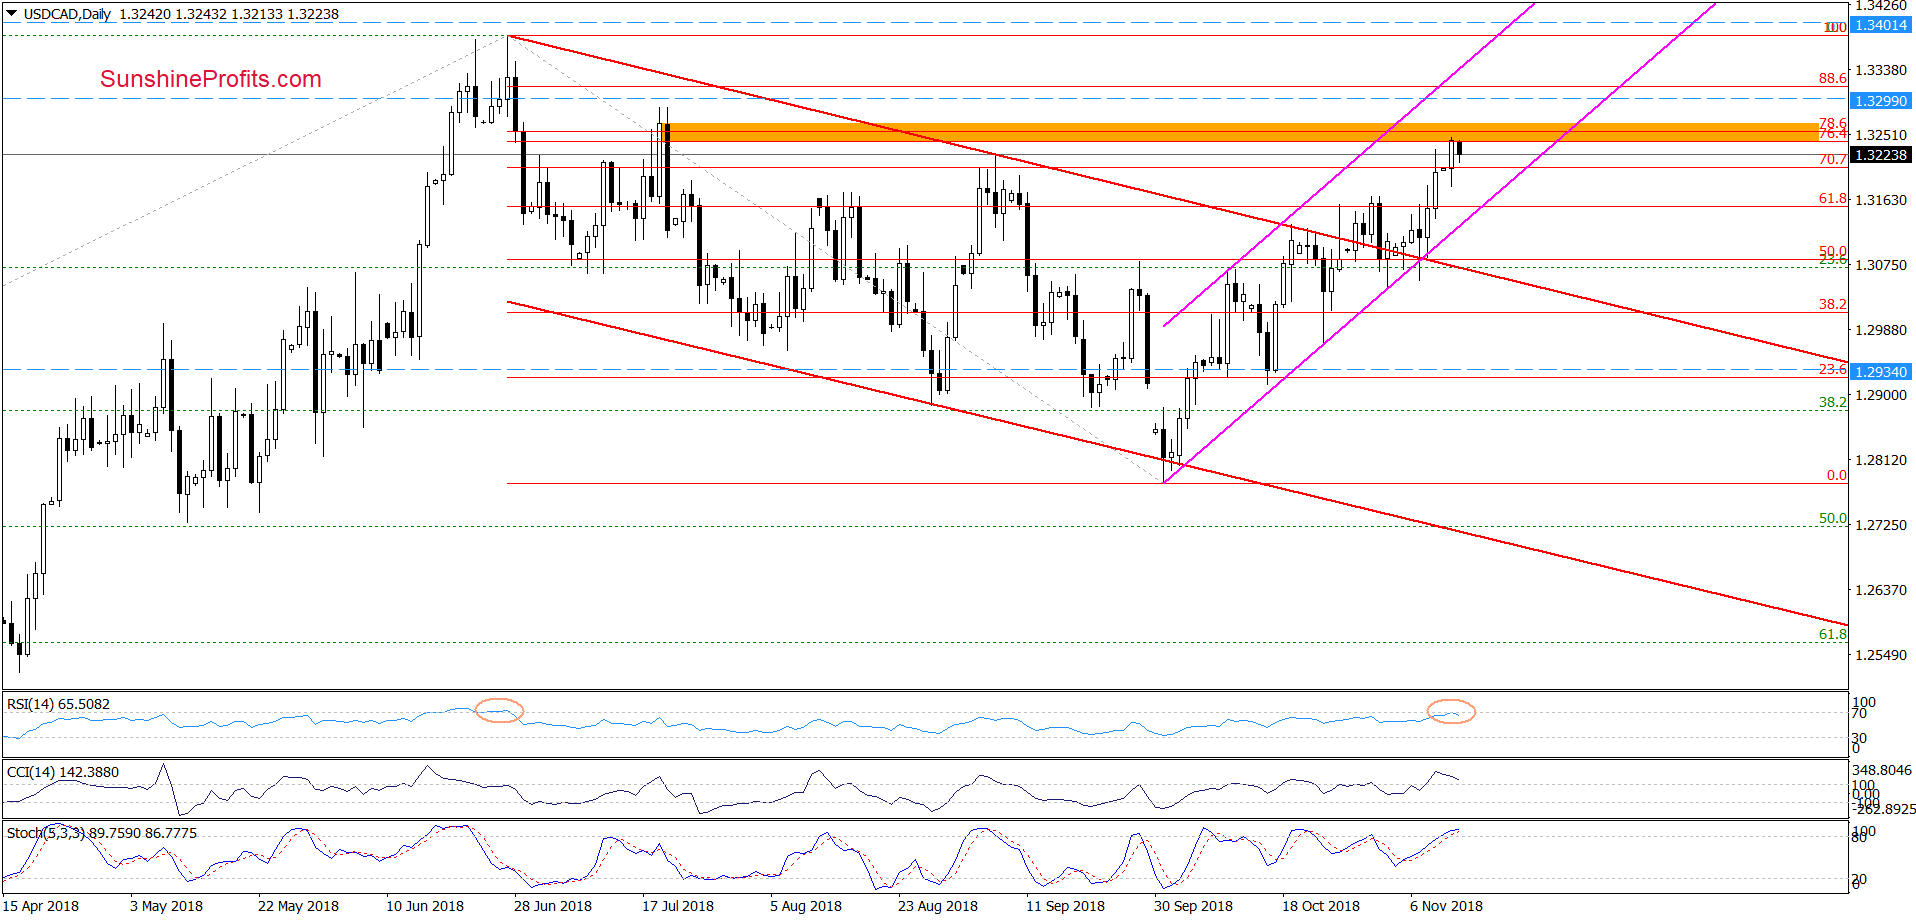
On the daily chart, we see that USD/CAD bounced off the lower border of the pink rising trend channel and the upper line of the red declining channel, which resulted in an increase to the orange resistance zone created by the 76.4%, 78.6% Fibonacci retracements and July peaks (in terms of daily openings and closures).
Thanks to this move to the north, the RSI climbed to its highest level since late-June. Back then, such high reading of the indicator preceded a sizable move do the downside in the following weeks, which suggests that we could see a similar price action in the near future – especially when we factor in the current position of other daily indicators (the CCI and the Stochastic Oscillator increased to their overbought areas, suggesting that sell signals and a reversal may be just around the corner).
Taking all the above into account, we think that if the pair moves to the south from current levels, we’ll see not only a decline to the lower border of the pink rising trend channel, but also a test of the previously-broken line of the red trend channel in the coming week(s).
Finishing today’s commentary on this currency pair, it is also worth noting that the recent upward move took the pair to one more resistance, which is seen more clearly on the chart below.
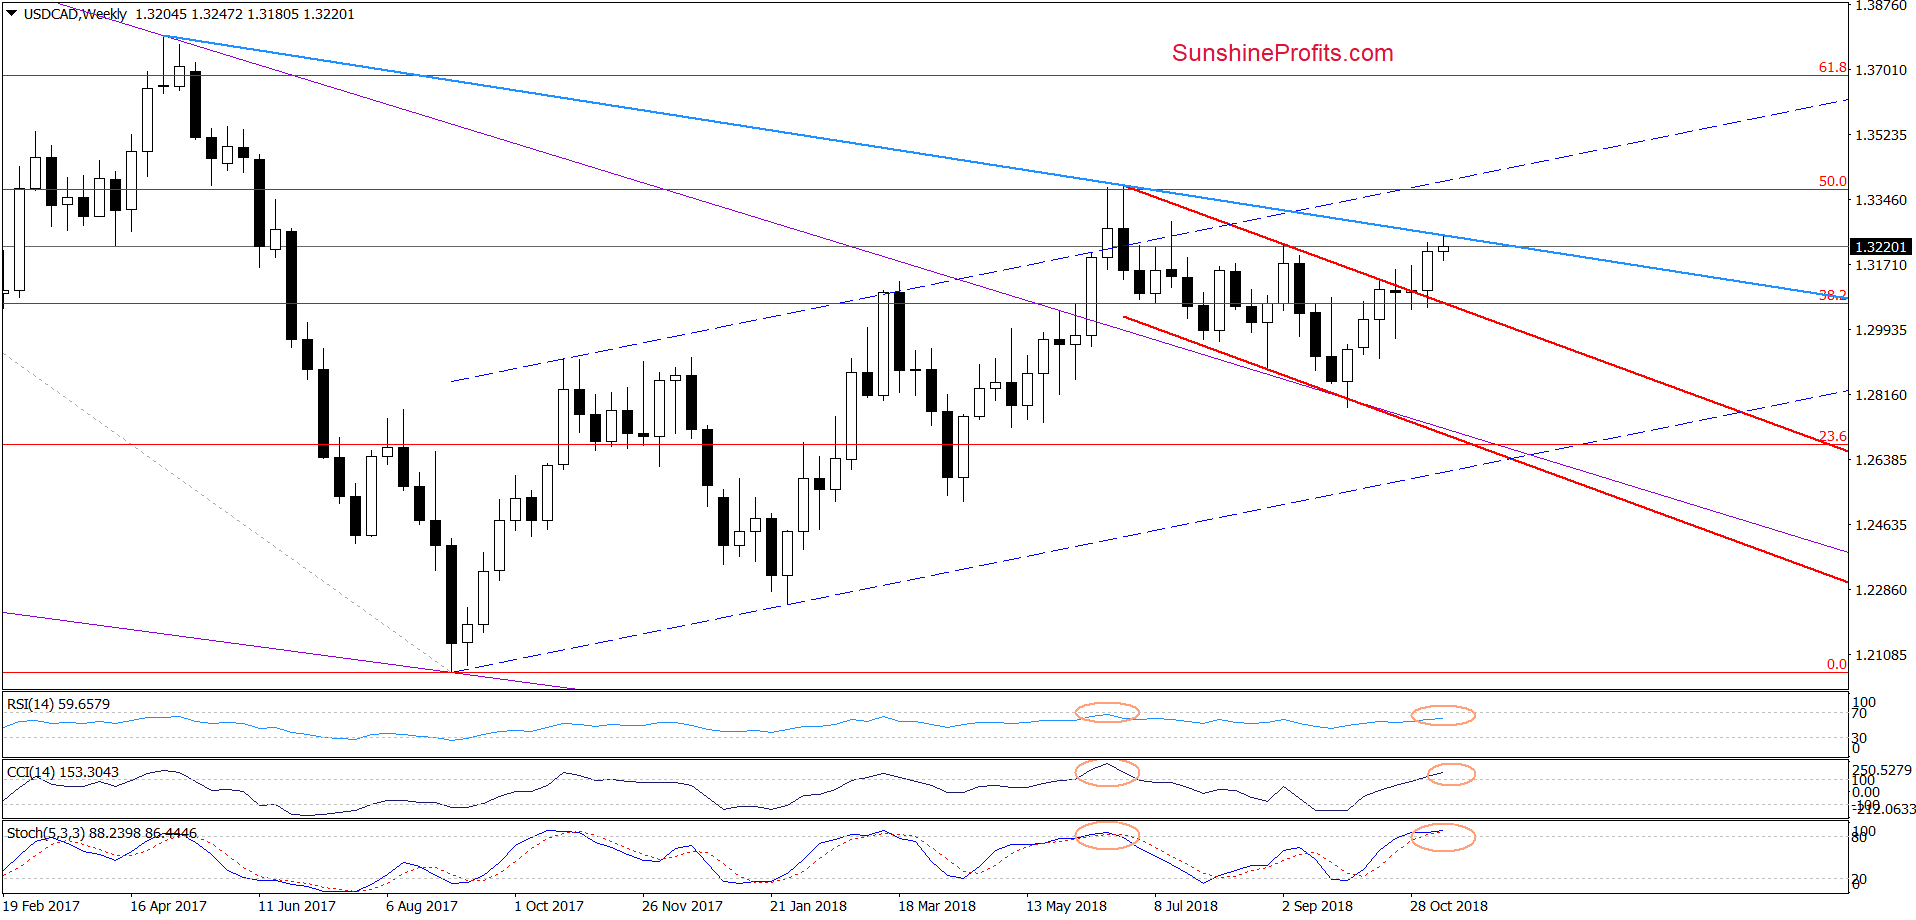
From this perspective, we see that USD/CAD also climbed to the blue declining resistance line based on the previous (the April 2017 and June 2018) peaks, increasing the probability of reversal later this week.
On top of that, all medium-term indicators increased to the highest levels since June, adding currency bears even more reasons to act.
Trading position (short-term; our opinion): short positions with a stop-loss order at 1.3401 and the initial downside target at 1.2934 are justified from the risk/reward perspective.
USD/CHF
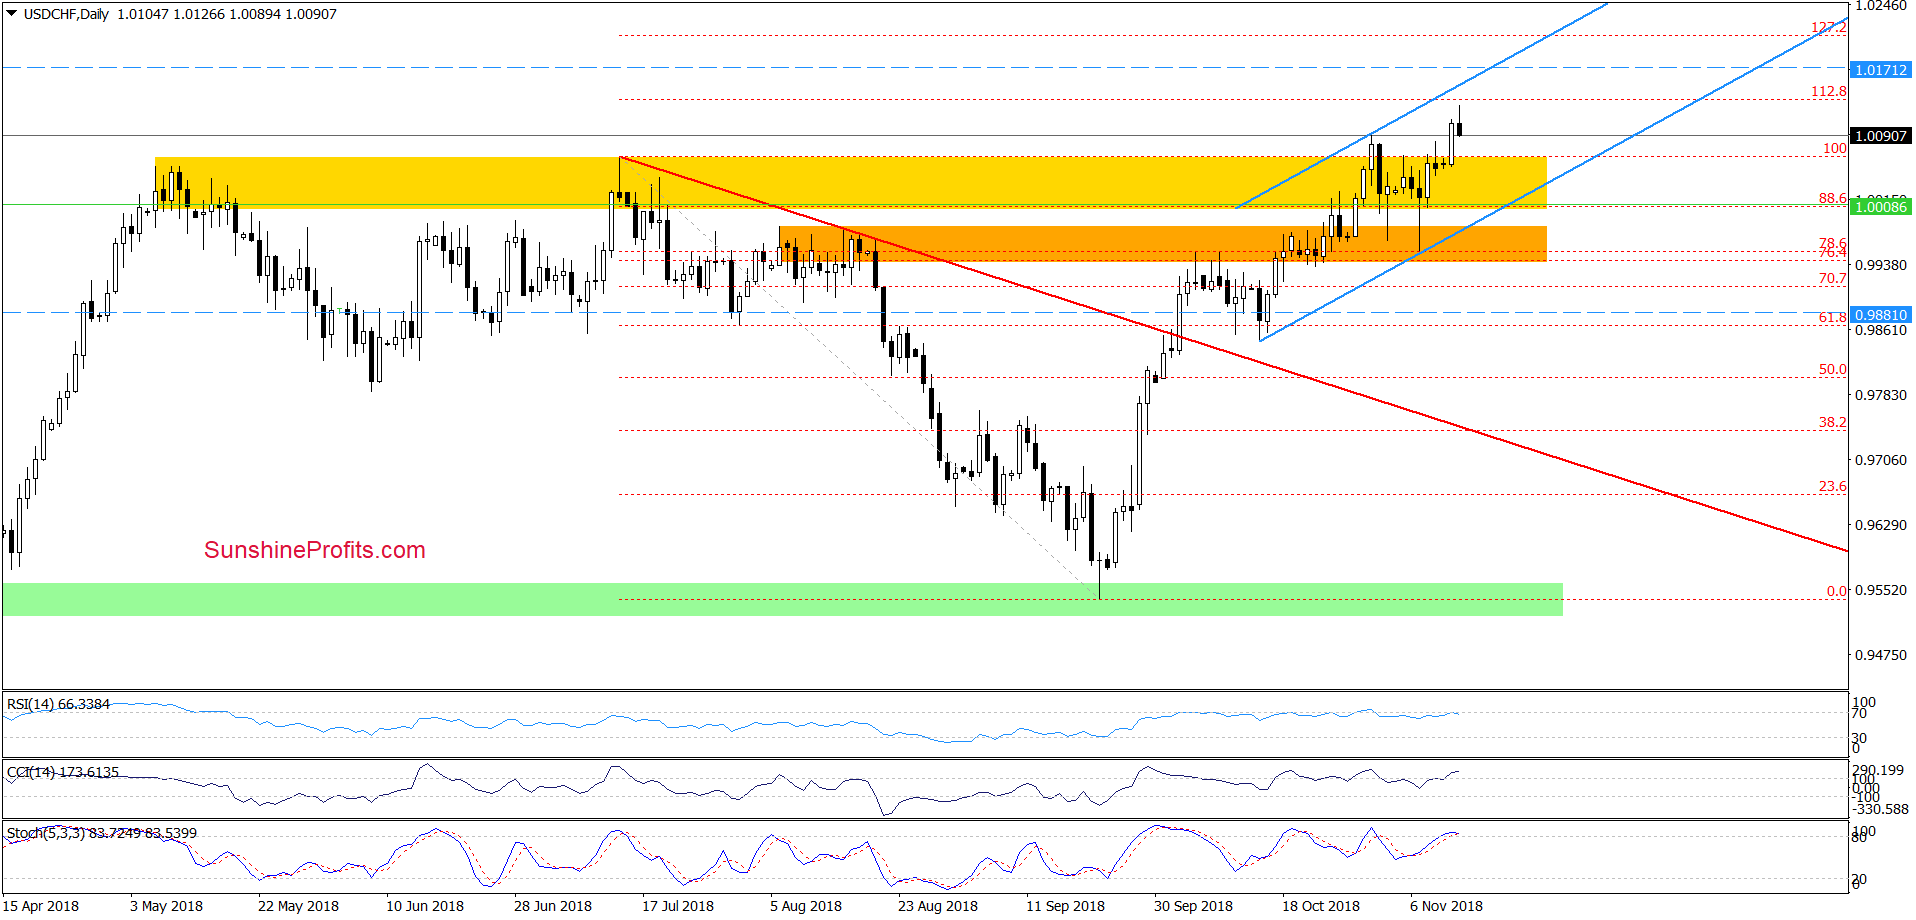
Looking at the daily chart, we see that USD/CHF broke above the October peak, which approached the exchange rate to the 112.8% Fibonacci extension during today’s session.
Thanks to this upswing, the pair also tested the upper border of the red resistance zone (created by the 76.4% and the 78.6% Fibonacci retracements) marked on the weekly chart below.
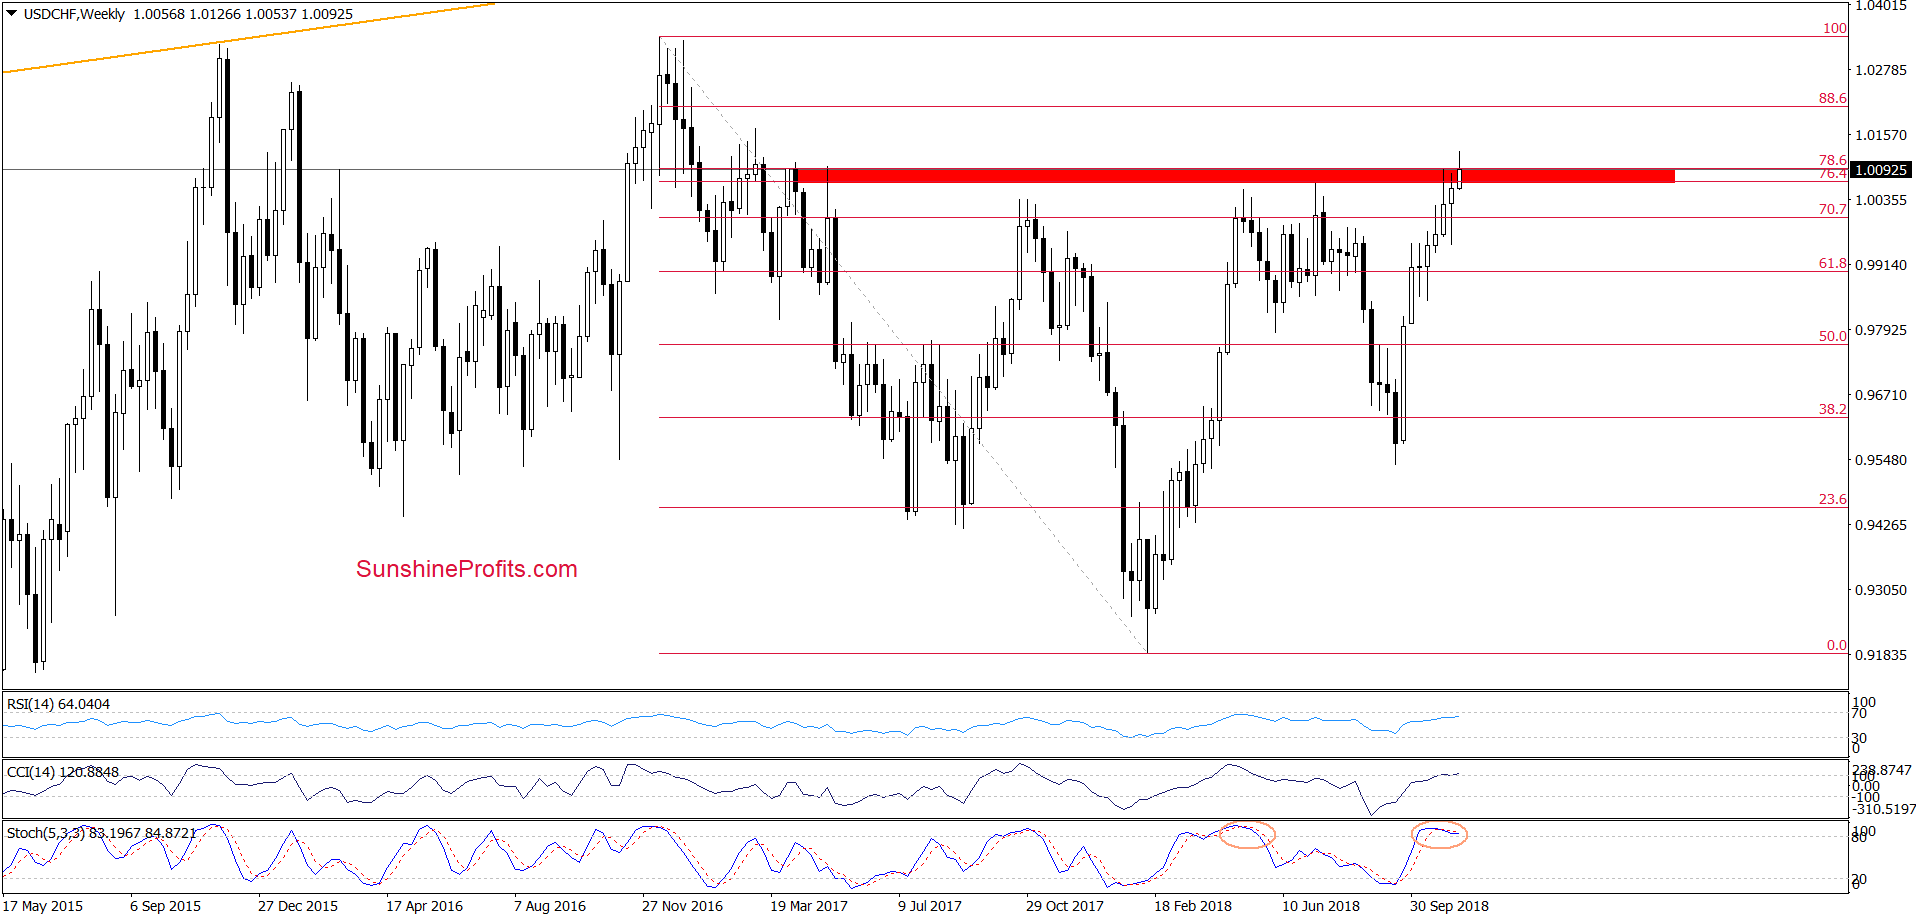
Nevertheless, despite today’s upswing the pair pulled back, which suggests that as long as there is no successful breakout above this area and a weekly closure above it higher values of USD/CHF are questionable and another move to the downside should not surprise us – especially when we take into account very high readings of the medium-term indicators and the sell signal generated by the Stochastic Oscillator.
If the situation develops in line with our assumptions and USD/CHF declines from current levels, we’ll see at least a test of the lower border of the blue rising trend channel marked on the daily chart.
Trading position (short-term; our opinion): short positions with a stop loss order at 1.0192 and the initial downside target at 0.9881 are justified from the risk/reward perspective.
Thank you.
Nadia Simmons
Forex & Oil Trading Strategist
Przemyslaw Radomski, CFA
Founder, Editor-in-chief, Gold & Silver Fund Manager
Gold & Silver Trading Alerts
Forex Trading Alerts
Oil Investment Updates
Oil Trading Alerts

