

Yesterday, the USD dollar extended losses against the Swiss franc, which resulted in a breakdown under the short-term support line, which is the lower line of the bigger formation. What impact could it have on USD/CHF in the coming days?
In our opinion the following forex trading positions are justified - summary:
- EUR/USD: short (a stop-loss order at 1.2250; the initial downside target at 1.1510)
- GBP/USD: short (a stop-loss order at 1.3773; the initial downside target at 1.3000)
- USD/JPY: none
- USD/CAD: none
- USD/CHF: none
- AUD/USD: none
EUR/USD
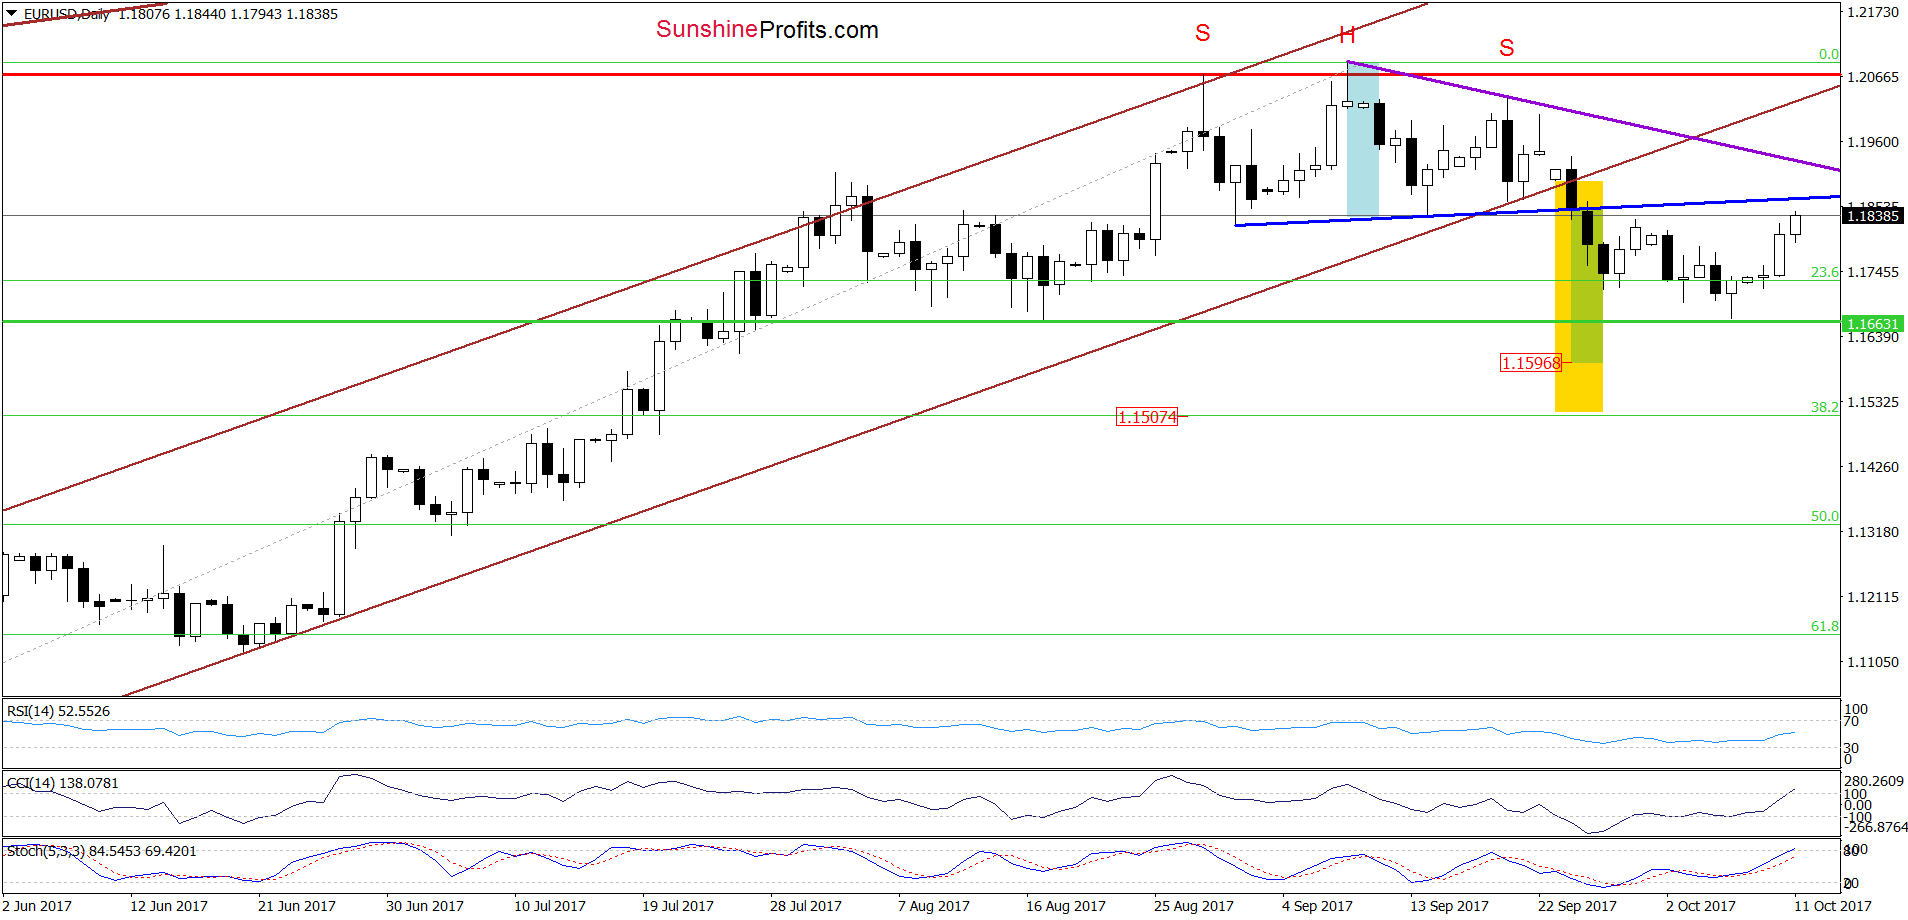
On the daily chart, we see that EUR/USD extended gains earlier today, which means that what we wrote on Monday remains up-to-date:
(…) taking into account Friday drop to the green horizontal support line (based on the mid-August low) and the buy signals generated by the daily indicators, it seems that we may see a short-lived rebound (even to the last week highs) in the coming days.
Will such price action change anything? In our opinion, it’s doubtful, because as long as the exchange rate remains under the neck line of the head and shoulders formation (the blue resistance line), this bearish pattern is underway, suggesting lower values of EUR/USD.
The pro bearish scenario is also reinforced by the long-term picture of the exchange rate.
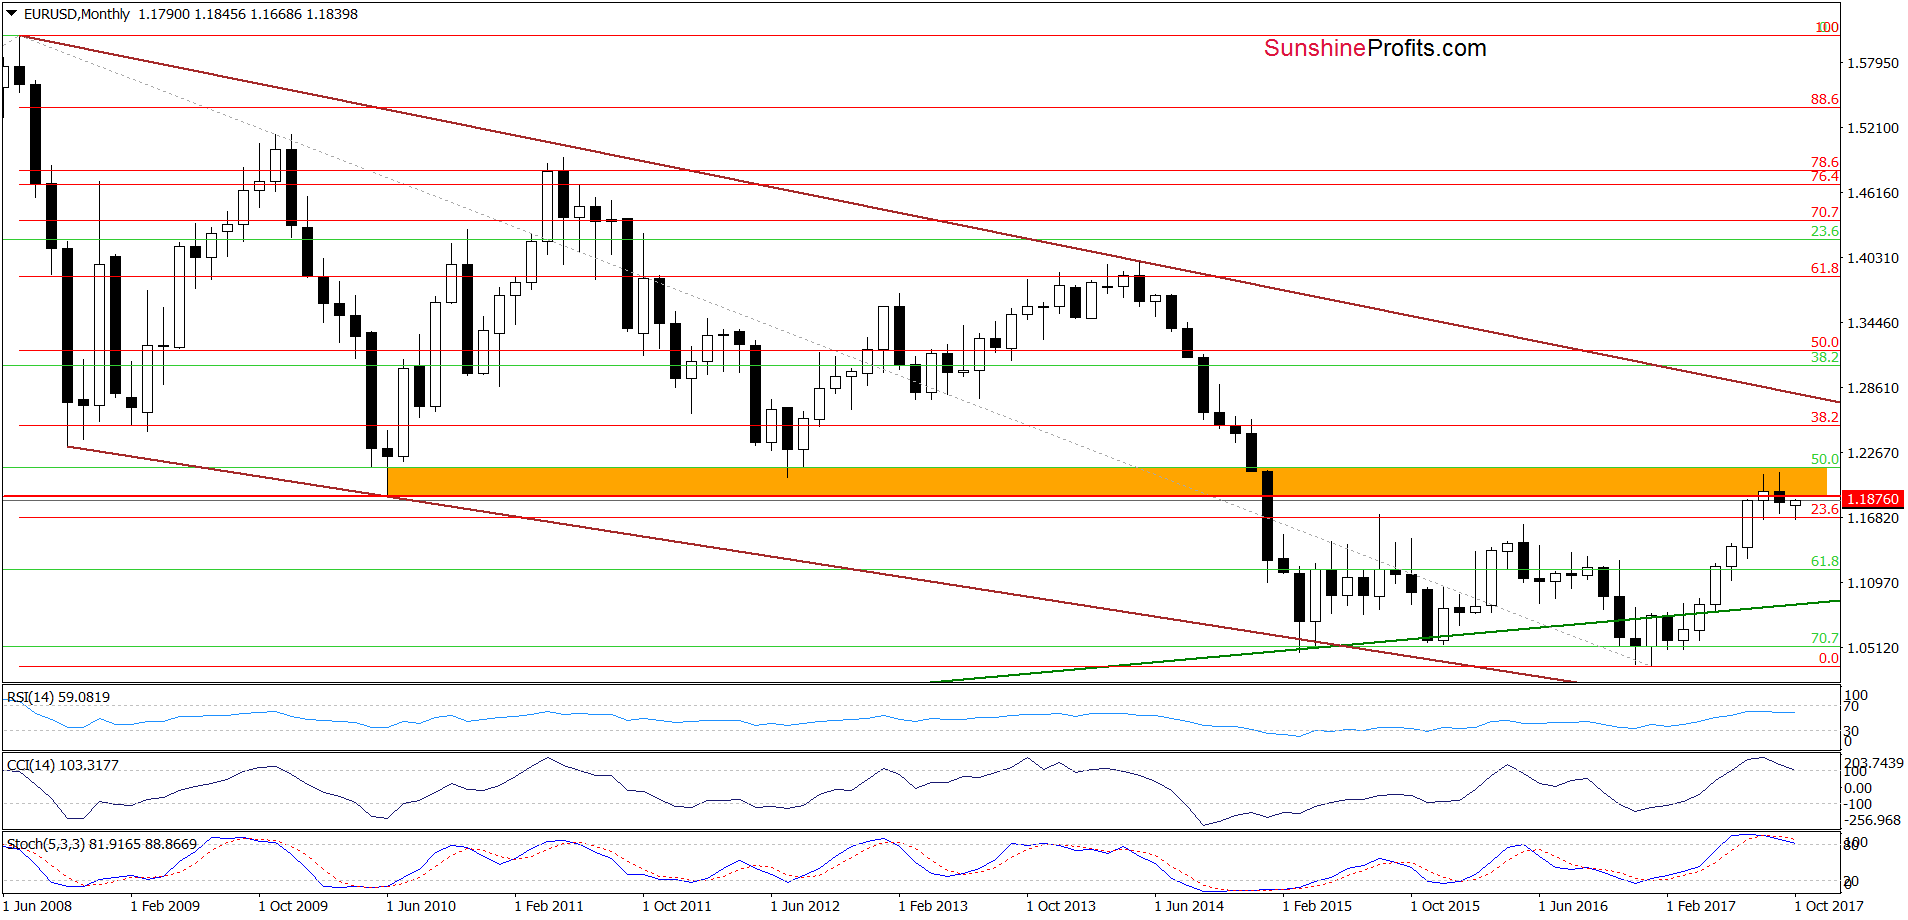
(…) EUR/USD is trading under the orange resistance zone, which together with the sell signals generated by the indicators suggests that lower values of EUR/USD are still ahead of us (even if we see a short-term rebound).
Very short-term outlook: mixed with bearish bias
Short-term outlook: bearish
MT outlook: mixed
LT outlook: mixed
Trading position (short-term; our opinion): Short profitable positions (with a stop-loss order at 1.2250 and the initial downside target at 1.1510) are justified from the risk/reward perspective. We will keep you informed should anything change, or should we see a confirmation/invalidation of the above.
USD/CAD
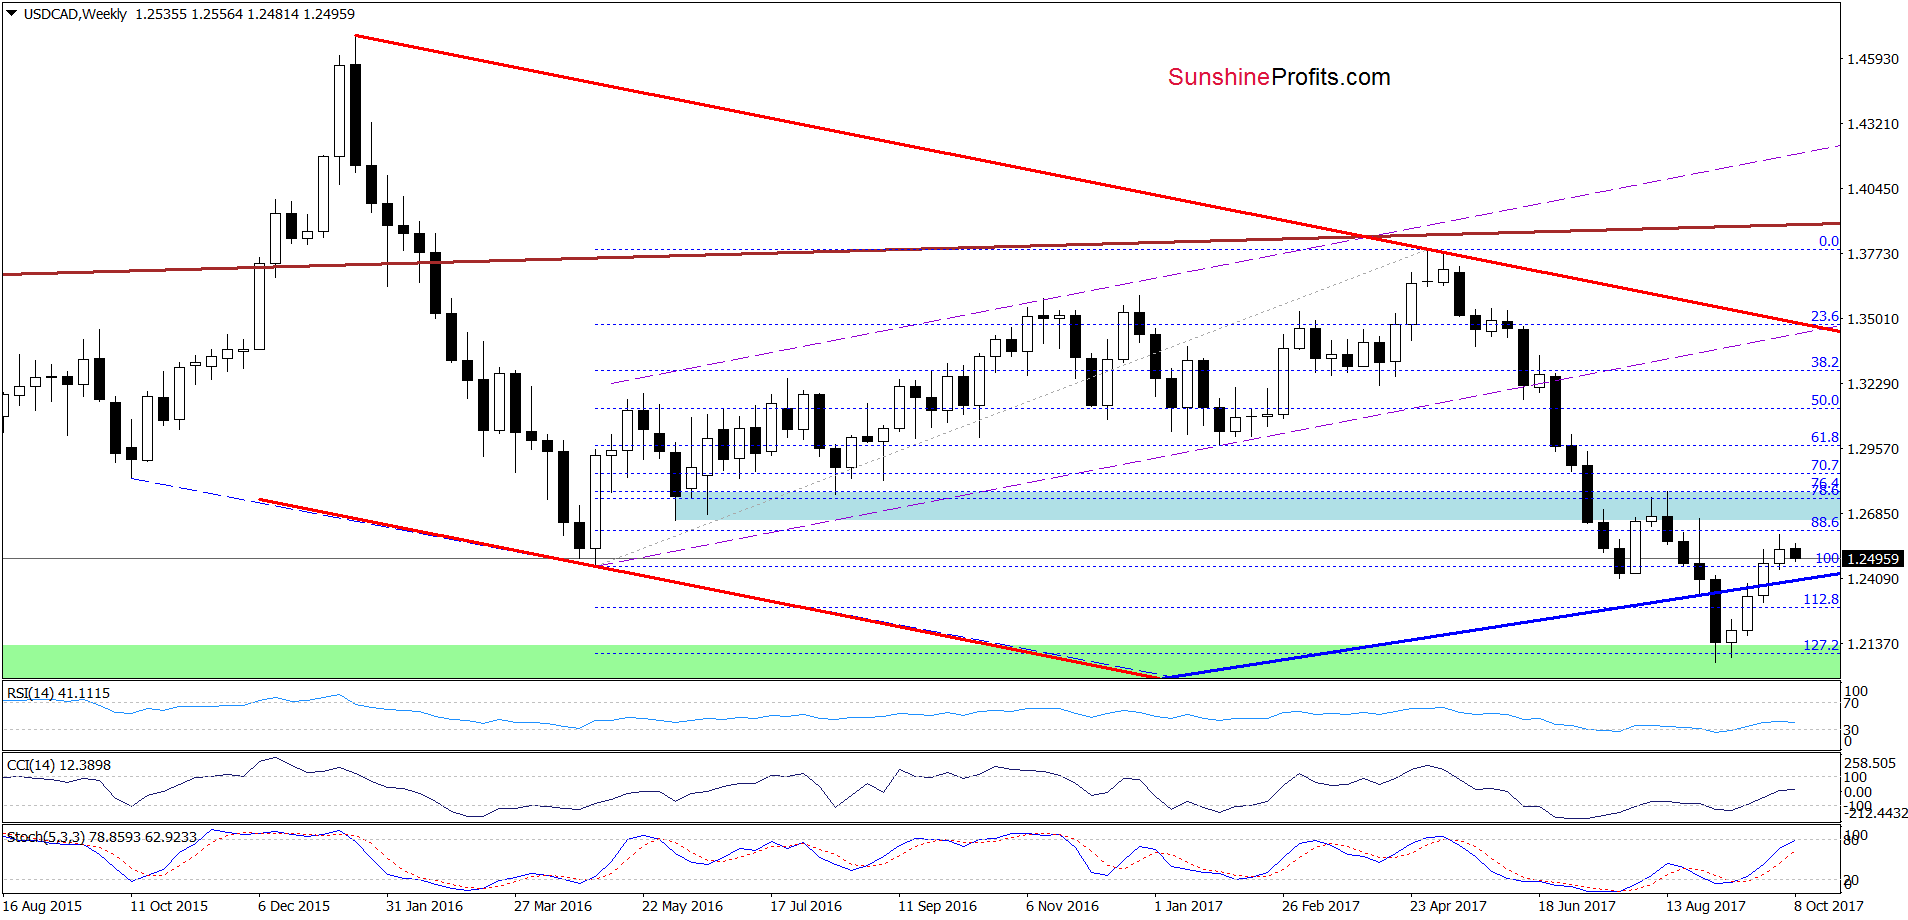
On the weekly chart, we see that although USD/CAD pulled back, the exchange rate is still trading above the previously-broken blue support line and the buy signals generated by the medium-term indicators remain in play.
But will we see further improvement? Let’s examine the daily chart and find out.
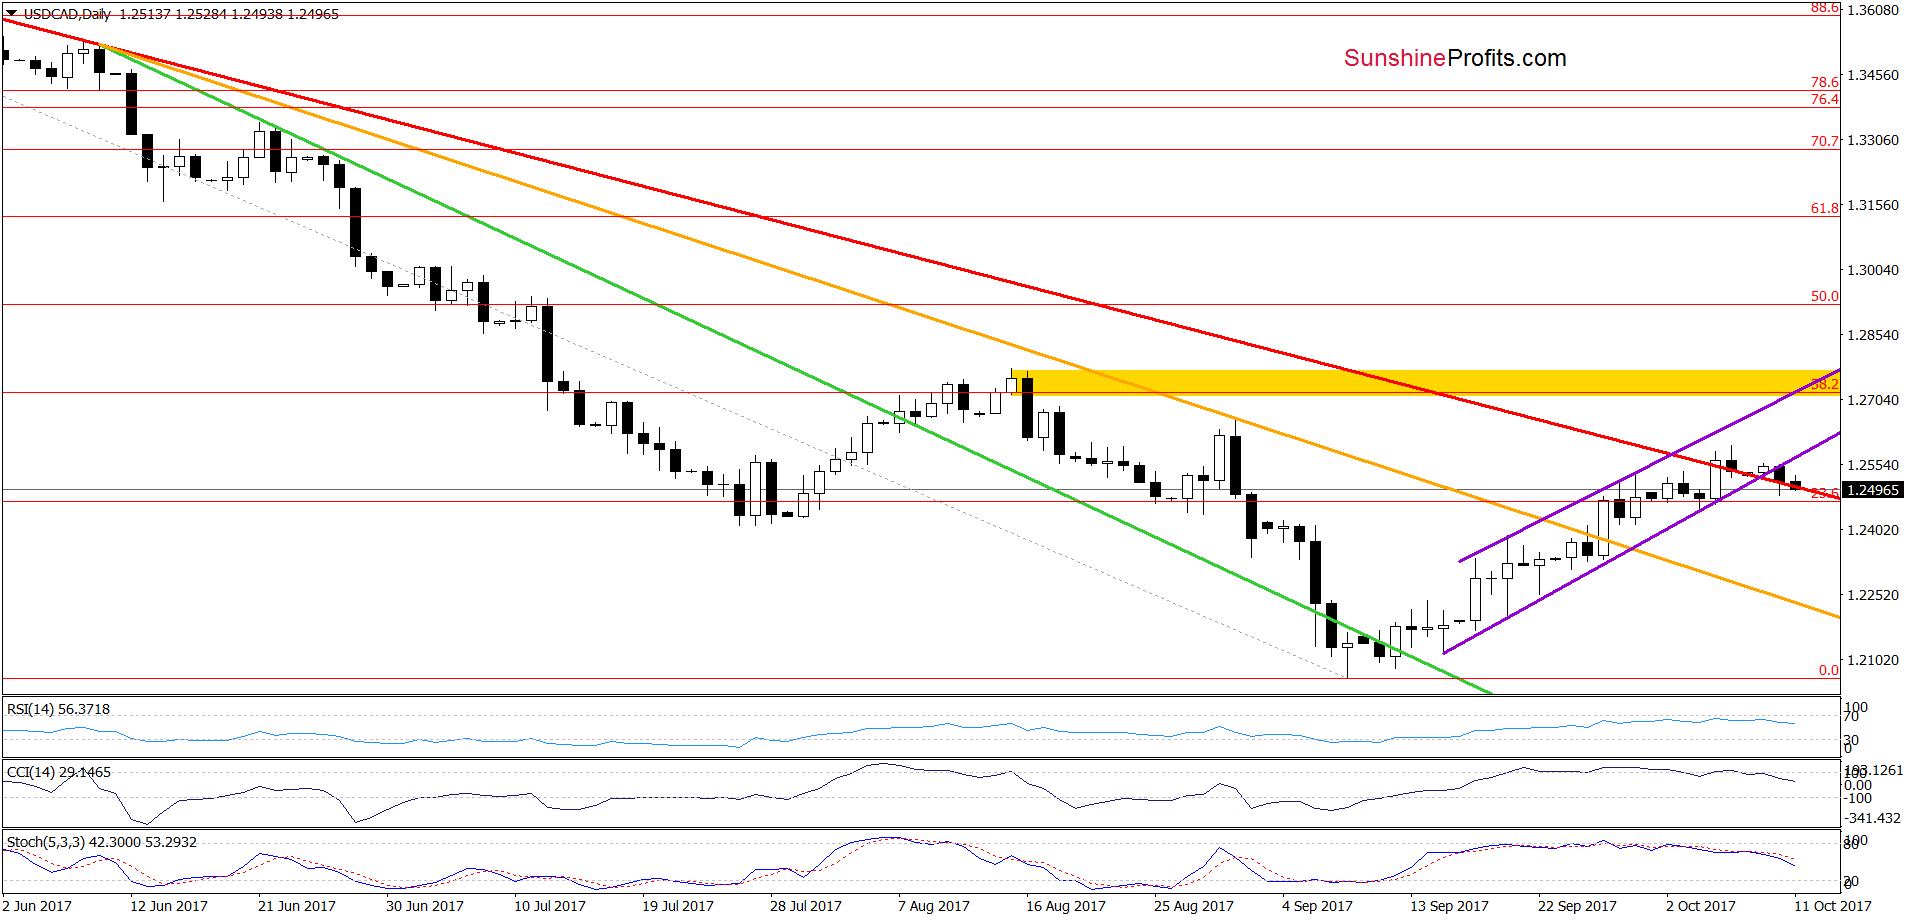
From today’s point of view, we see that USD/CAD slipped under the previously-broken lower border of the purple rising trend channel, which doesn’t bode well for currency bulls – especially when we factor in the sell signals generated by the indicators. Nevertheless, in our opinion further deterioration will be more likely and reliable only if the pair closes today’s (or one of the following) session under the previously-broken red declining line, which serves as the nearest support at the moment. If we see such price action, the exchange rate will likely come back to around 1.2446, where the last week’s low is.
Very short-term outlook: mixed with bearish bias
Short-term outlook: mixed
MT outlook: mixed
LT outlook: mixed
Trading position (short-term; our opinion): No positions are justified from the risk/reward perspective at the moment. We will keep you informed should anything change, or should we see a confirmation/invalidation of the above.
USD/CHF
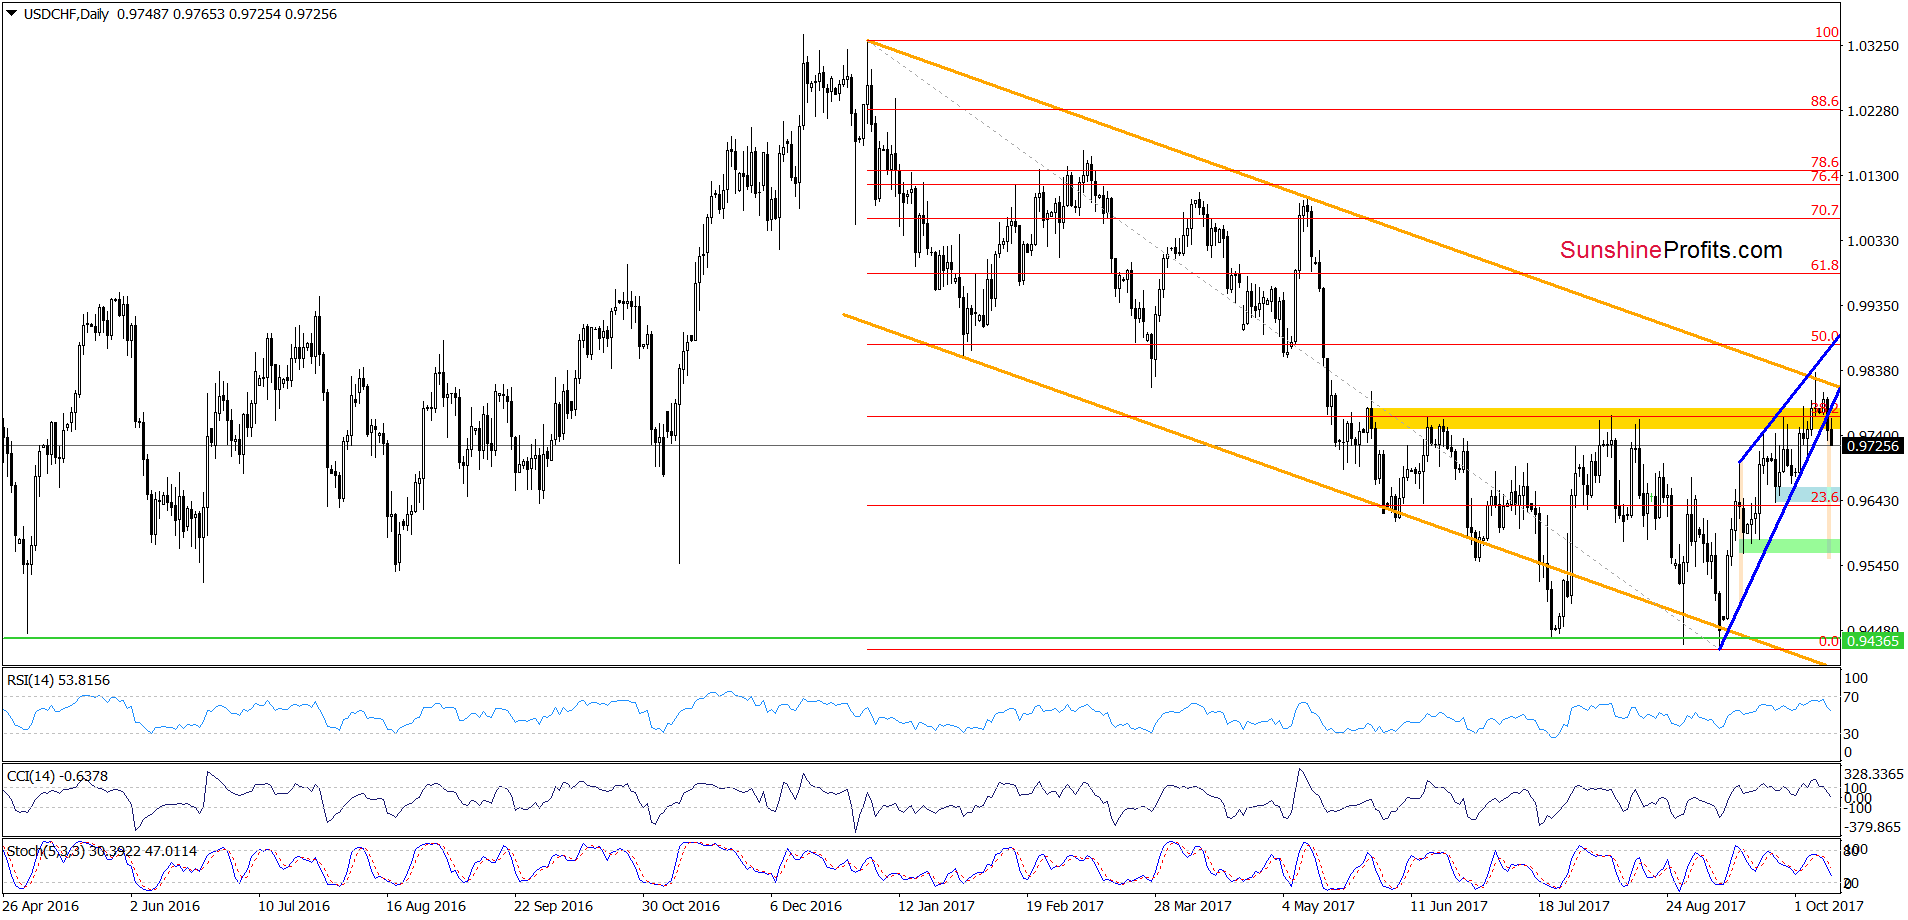
Quoting our last commentary on this currency pair:
(…) the above-mentioned lower border of the blue rising wedge stopped currency bears, triggering a rebound. As a result, the exchange rate came back to the yellow resistance zone and broke above the 38.2% Fibonacci retracement (based on the entire 2017 downward move) yesterday, which together with the buy signal generated by the Stochastic Oscillator (and lack of sales signals generated by other indicators) suggests one more upswing and a test of the upper border of the orange declining trend channel (or even the upper line of the blue rising wedge) in the coming week (the area around 0.9822-0.9837).
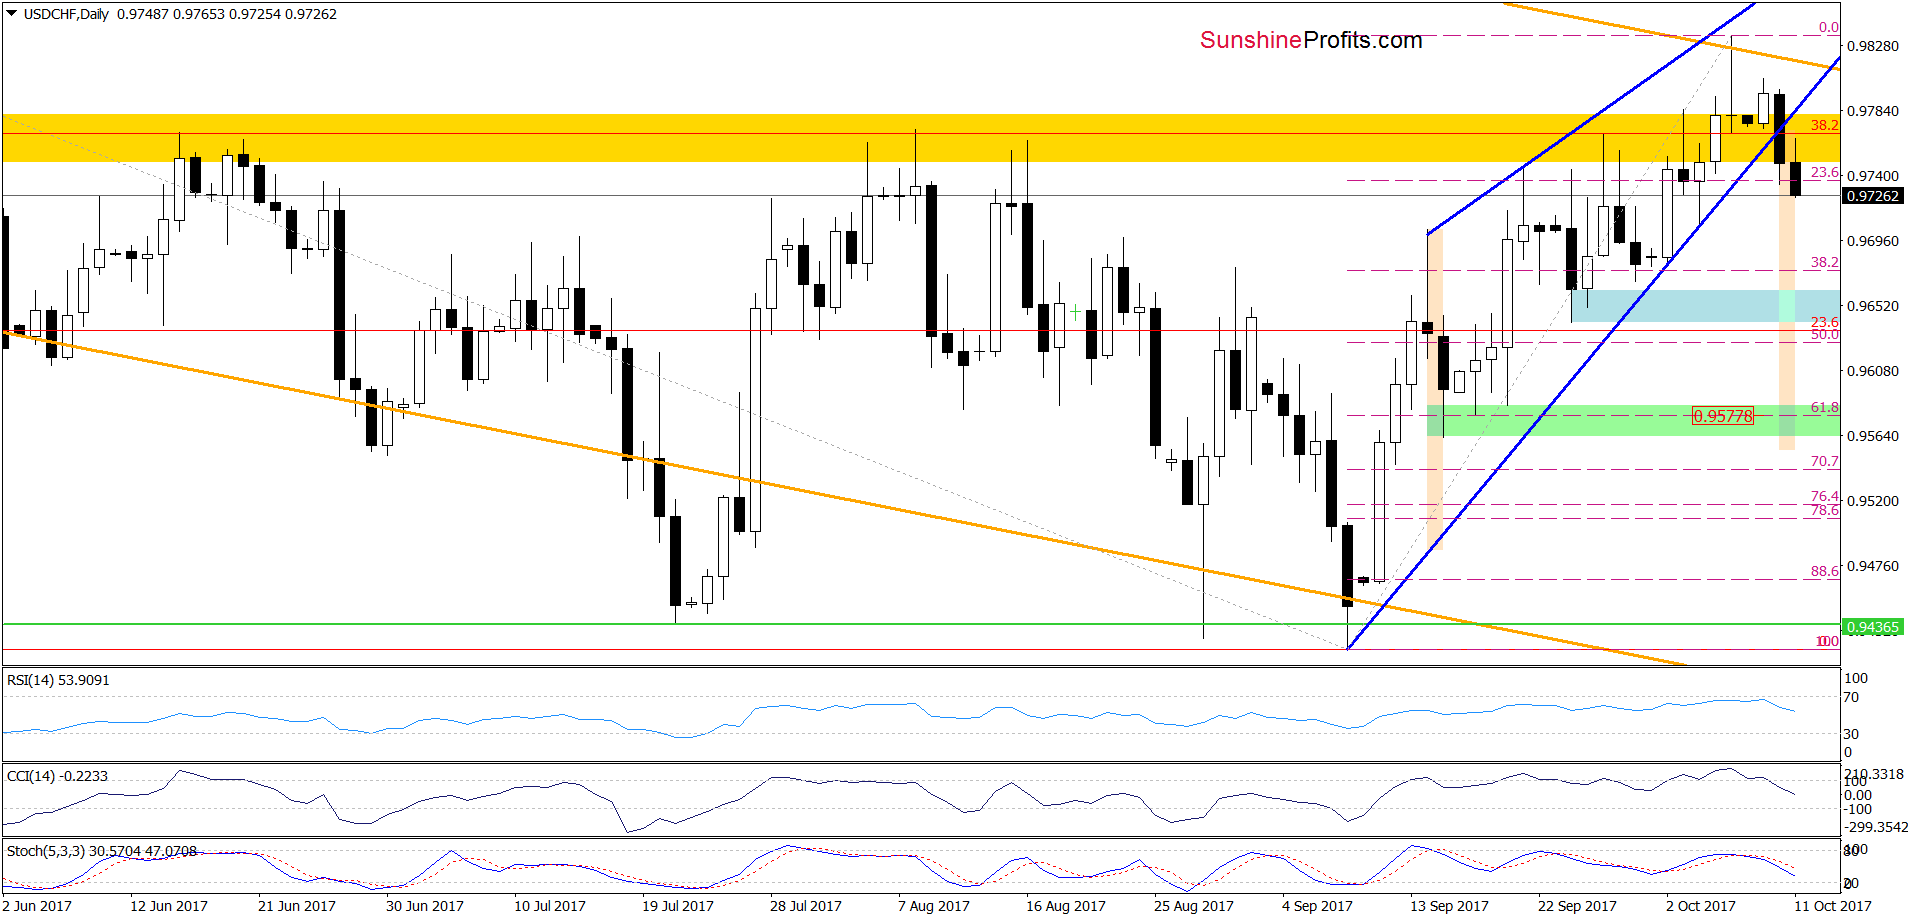
From today’s point of view, we see that the situation developed in line with the above scenario and USD/CHF climbed to our upside targets. As you see the combination of these resistances encouraged currency bears to act, which resulted in a reversal and decline. Thanks to yesterday’s drop the exchange rate moved sharply lower and invalidated the earlier breakout above the yellow resistance zone. This negative event triggered further deterioration and a decline under the lower border of the blue rising wedge, which together with the sell signals generated by the daily indicators suggests further deterioration in the coming days.
How low could the exchange rate go? In our opinion, if the pair moves lower from current levels, the initial downside target will be around 0.9640-0.9725, where the blue support zone is. However, taking into account the size of the blue rising wedge, it seems that we may see a decline even to around 0.9554-0.9578, where the size of the downward move will correspond to the height of the formation and where the mid-September lows and the 61.8% Fibonacci retracement are.
Very short-term outlook: bearish
Short-term outlook: mixed with bearish bias
MT outlook: mixed
LT outlook: mixed
Trading position (short-term; our opinion): No positions are justified from the risk/reward perspective at the moment. We will keep you informed should anything change, or should we see a confirmation/invalidation of the above.
Thank you.
Nadia Simmons
Forex & Oil Trading Strategist
Przemyslaw Radomski, CFA
Founder, Editor-in-chief, Gold & Silver Fund Manager
Gold & Silver Trading Alerts
Forex Trading Alerts
Oil Investment Updates
Oil Trading Alerts

