

Thursday’ session took USD/CHF not only below the Fibonacci retracement, but also under the support area, which stopped the sellers several times during the last month. Bears were waiting for such occasion and greedily started collecting points for themselves, pushing the exchange lower. What will it lead to?
- EUR/USD: short (a stop-loss order at 1.1878; the initial downside target at 1.1343)
- GBP/USD: none
- USD/JPY: long (a stop-loss order at 111.37; the initial upside target at 112.88)
- USD/CAD: none
- USD/CHF: none
- AUD/USD: none
Before we discuss the situation on individual currency pairs, we would like to draw your attention to the fact that we raised our stop-loss order in USD/JPY to 111.37 as the exchange rate extended gains and broke above the upper line of the rising rend channel earlier today (you will find the analysis of this currency pair in our Monday's alert).
EUR/USD
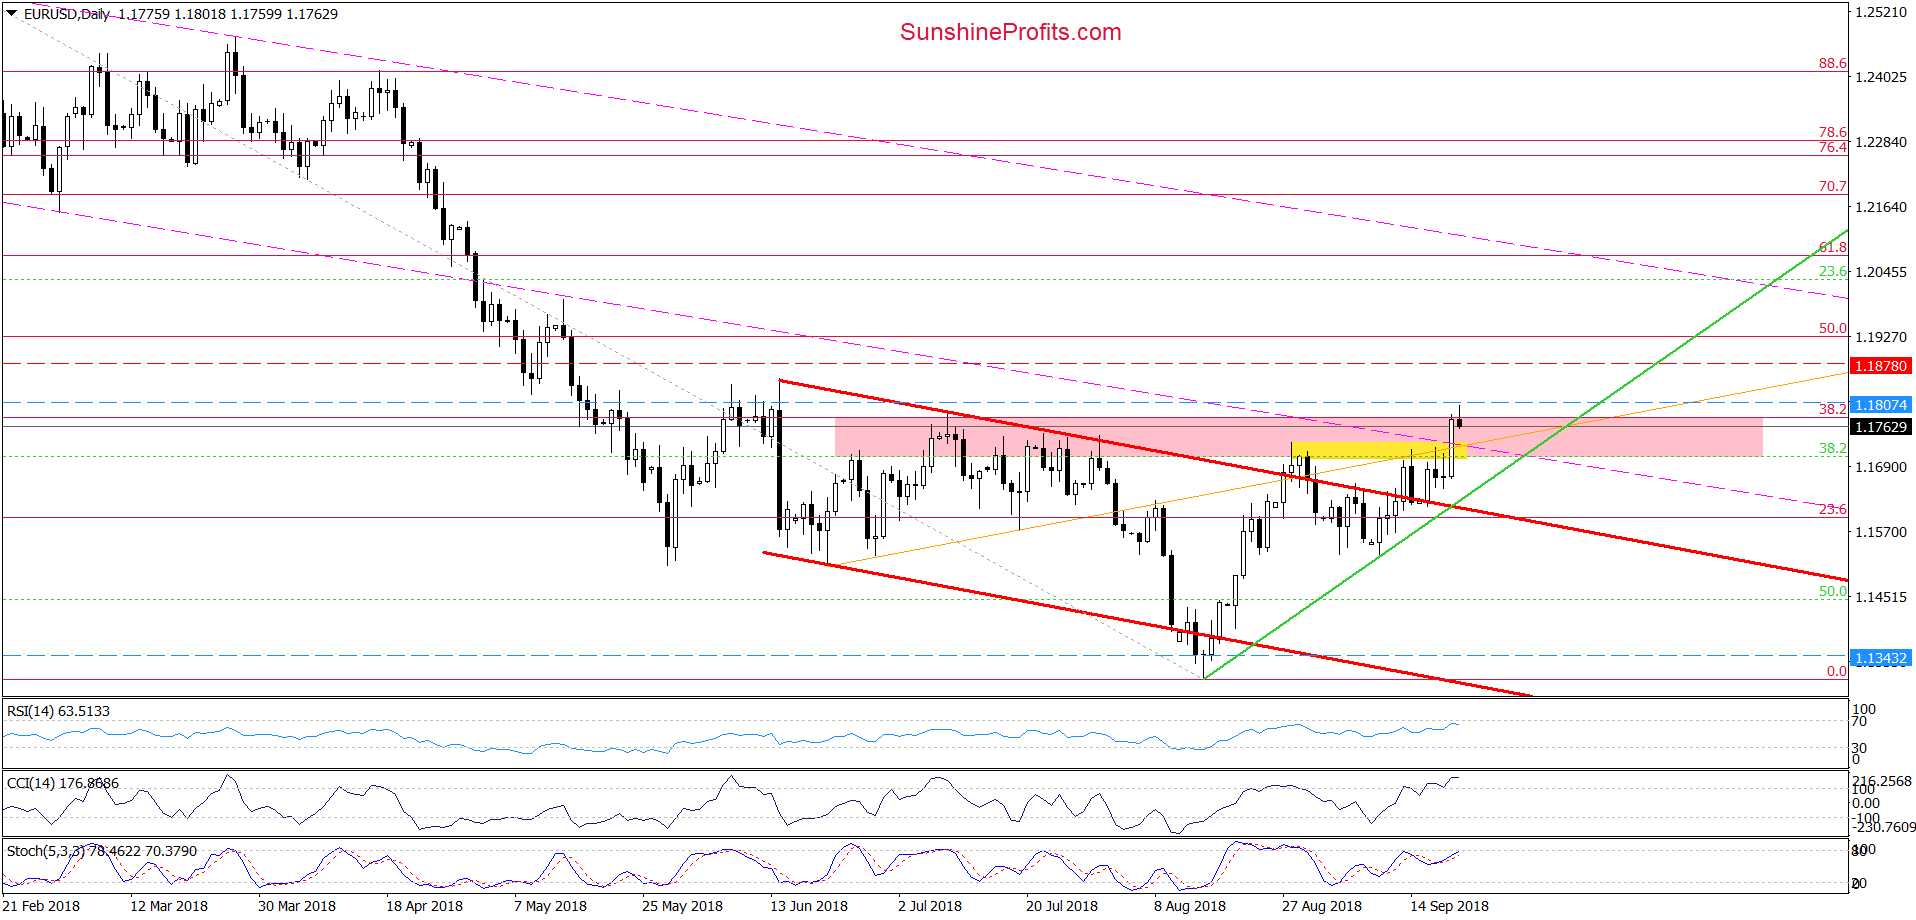
Looking at the daily chart, we see that although EUR/USD moved a bit higher earlier today, this improvement was very temporary, and the pair came back below the 38.2% Fibonacci retracement (based on the entire February-August downward move) and the upper line of the pink resistance zone, invalidating the earlier breakout.
Such price action doesn’t bode well for higher values of the exchange rate – especially when we add the current situation in the medium term.
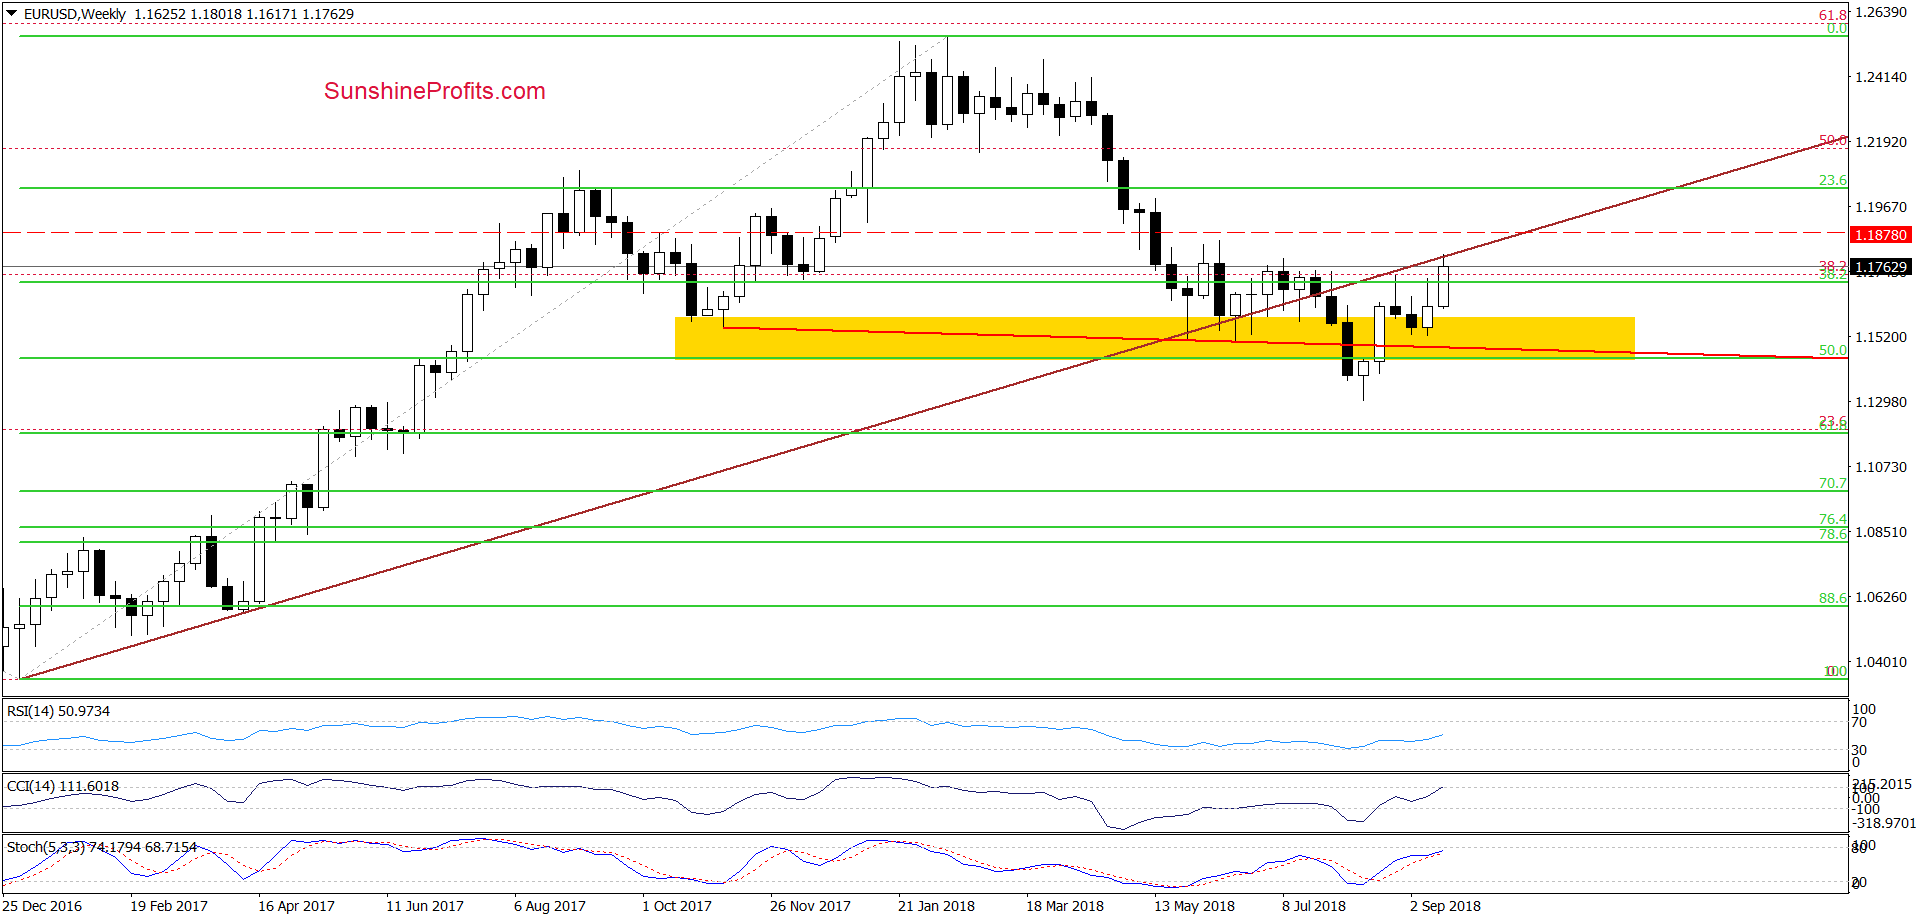
What do we mean by that? Let’s recall the quote from our Thursday’s alert:
(…) the pair approached the previously-broken long-term brown line (at the moment of writing these words is around the barrier 1.800), which looks like a verification of the late-July breakdown.
At this point, it is worth noting that similar price action we saw at the end of August. Back then, the proximity to this important resistance encouraged currency bears to show their claws, which turned into decline.
This time, the sellers have on their side one more argument – the above-mentioned 38.2% Fibonacci retracement, which together with the upper line of the pink resistance zone and the long-term brown resistance line will likely stop further improvement in the very near future.
Taking all the above into account, we believe that short positions are justified as a bigger move to the downside is just around the corner. Therefore, if the pair closes today’s session below the above-mentioned resistances, we’ll see a test of the green support line based on previous lows in the very near future.
Trading position (short-term; our opinion): Short positions with a stop-loss order at 1.1878 and the initial downside target at 1.1343 are justified from the risk/reward perspective.
USD/CAD
In our last commentary on this currency pair, we wrote:
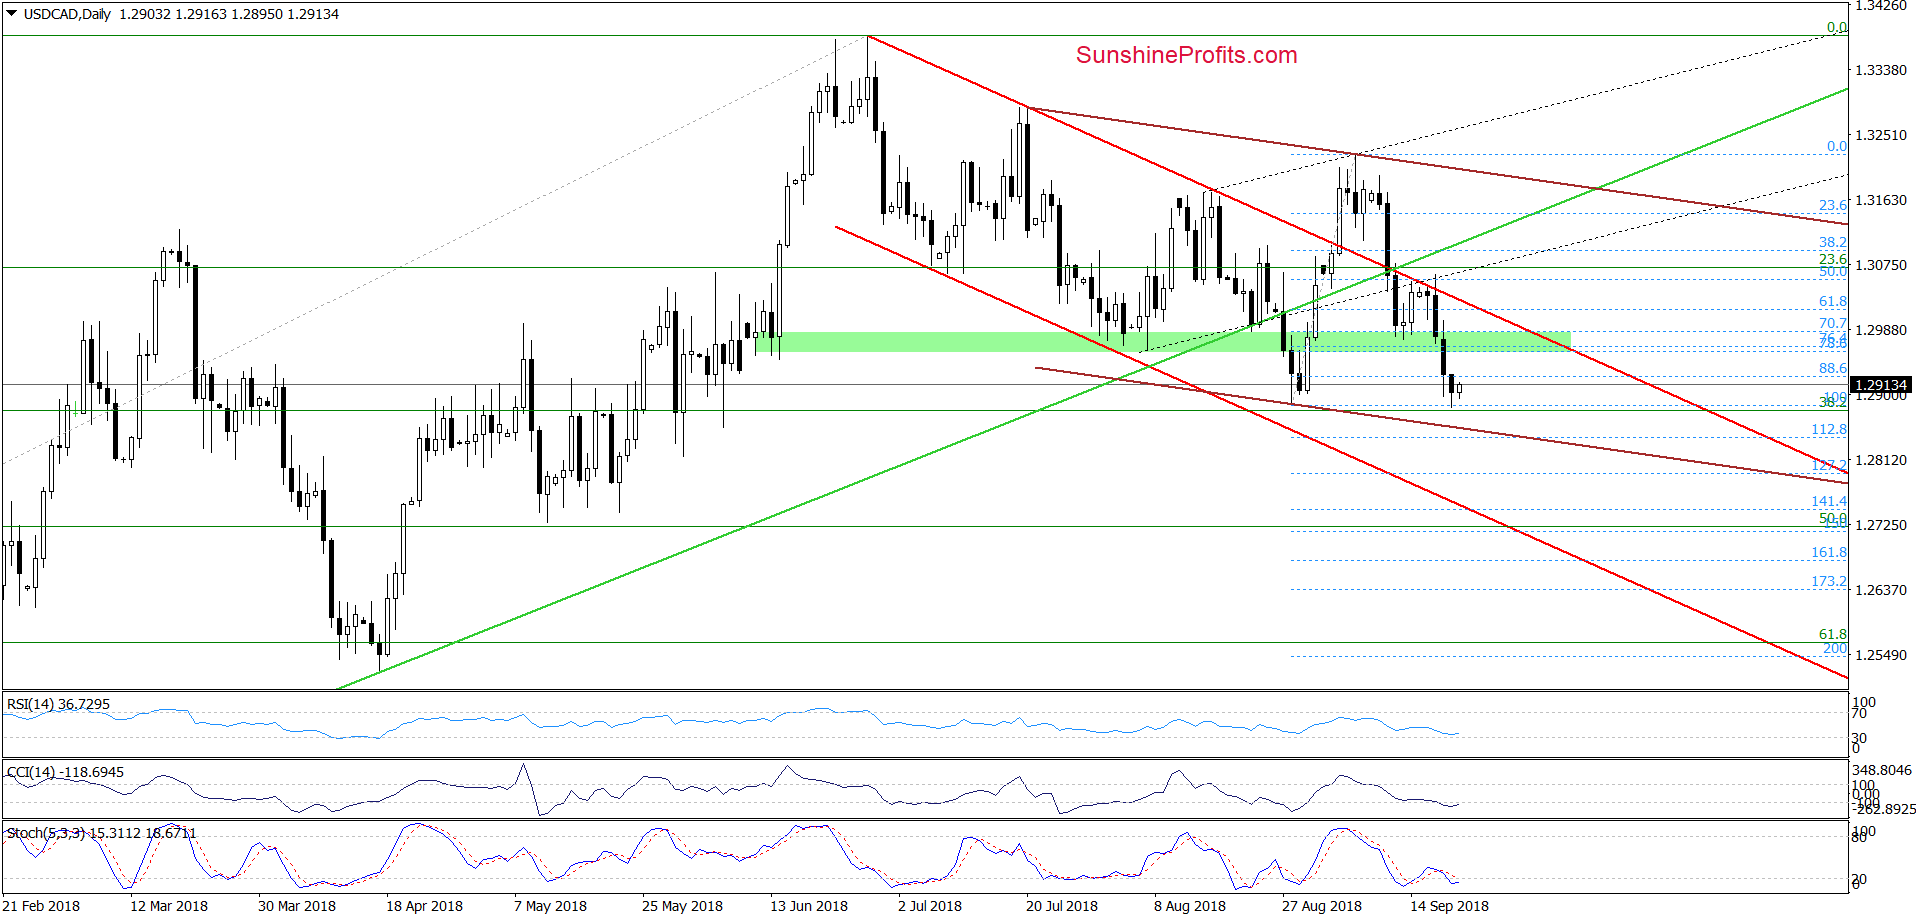
(…) Although USD/CAD bounced off the green support zone in the previous week, the upper border of the red declining trend channel was strong enough to stop further improvement and trigger another move to the downside earlier this week.
Thanks to this price action, currency bears took the exchange rate under the above-mentioned support zone, which suggests that we’ll see a test of the late-August lows in the very near future. At this point, it is worth noting that slightly below these levels is also the brown support line (parallel to the resistance line based on July and September lows), which could give currency bulls an additional reason to act.
As you see on the above chart USD/CAD extended losses, which approached the pair to our downside target during yesterday’s session.
What’s next for exchange rate?
Taking into account the lack of buy signals generated by the daily indicators, we think that one more downswing at the beginning of next week is still likely. However, the proximity to the late-August lows and the lower border of the brown declining trend channel suggest that the space for declines is limited – especially when we factor in the fact that USD/CAD slipped to the previously-broken long-term red declining support line seen on the monthly chart below.
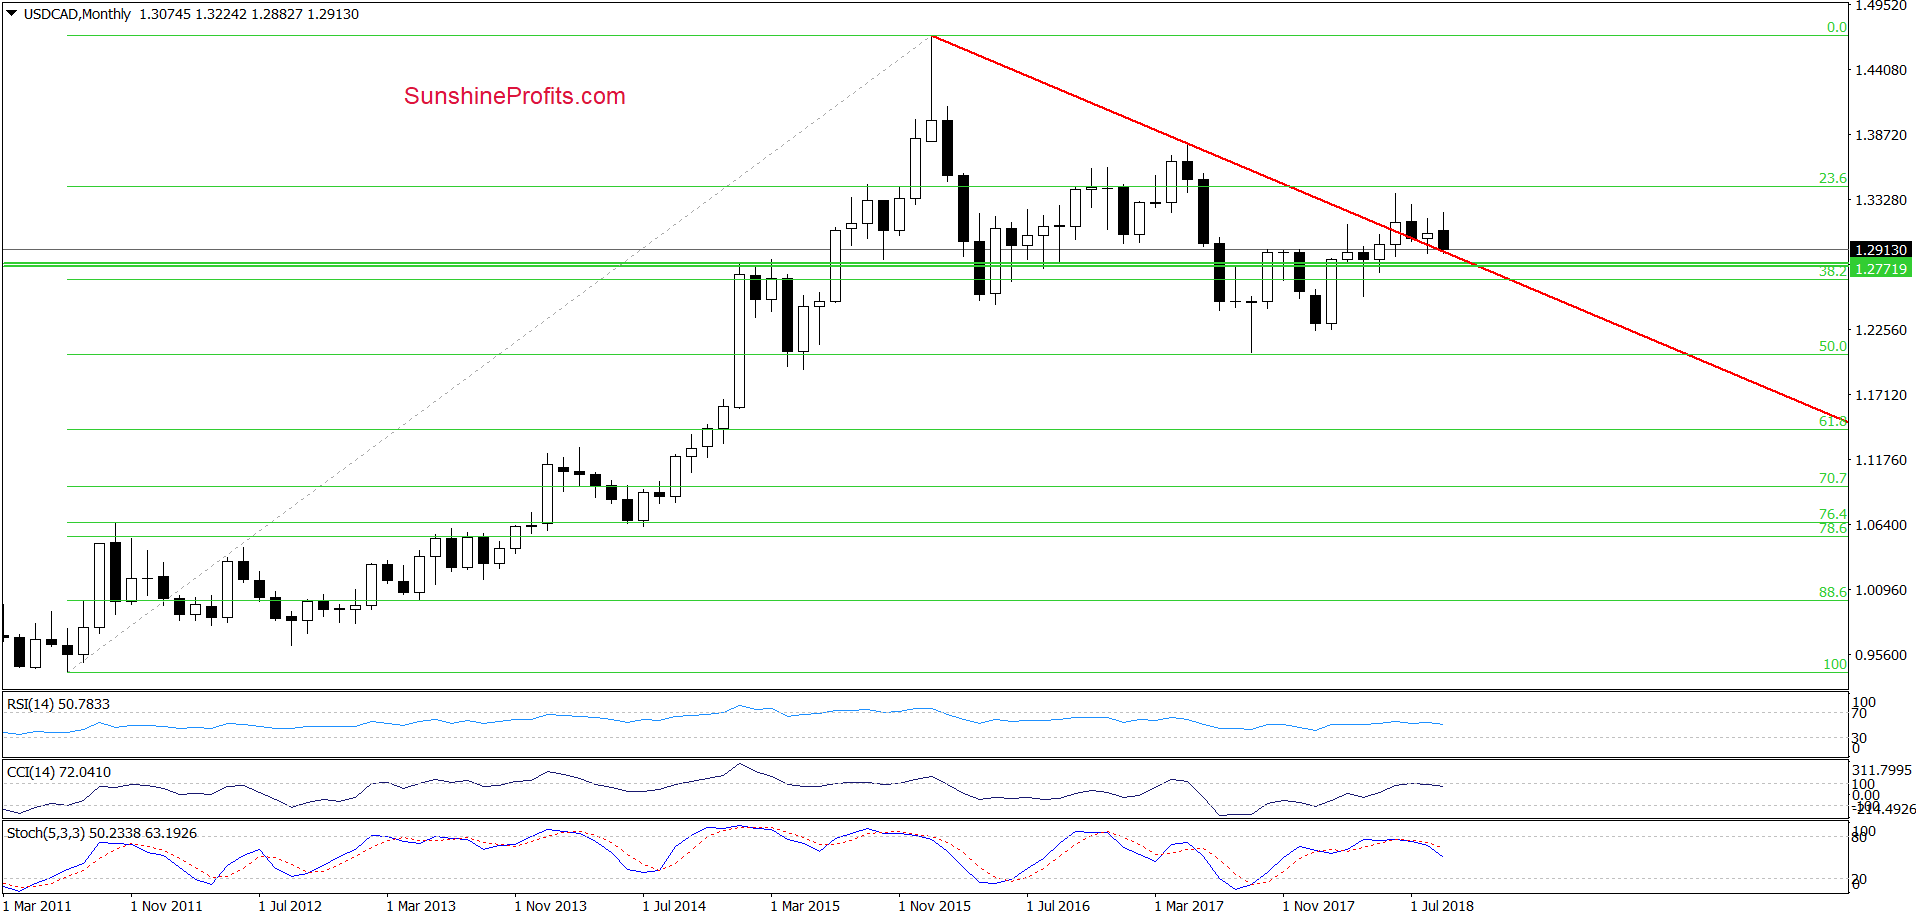
Such price action suggests that this month’s drop could be another verification of June’s breakout above this line. Nevertheless, we will be able to a confirm (or invalidate) this assumption only after the closing of the last September’s session.
Finishing this part of today’s alert, we think that it is worth to pay attention to the factor that can worry some bulls. There are long-term sales signals generated by the CCI and the Stochastic Oscillator, which last time (in June 2017) preceded sizable declines. Therefore, waiting at the sidelines seems to be the best decision at the moment.
Trading position (short-term; our opinion): No positions are justified from the risk/reward perspective. We will keep you informed should anything change, or should we see a confirmation/invalidation of the above.
USD/CHF
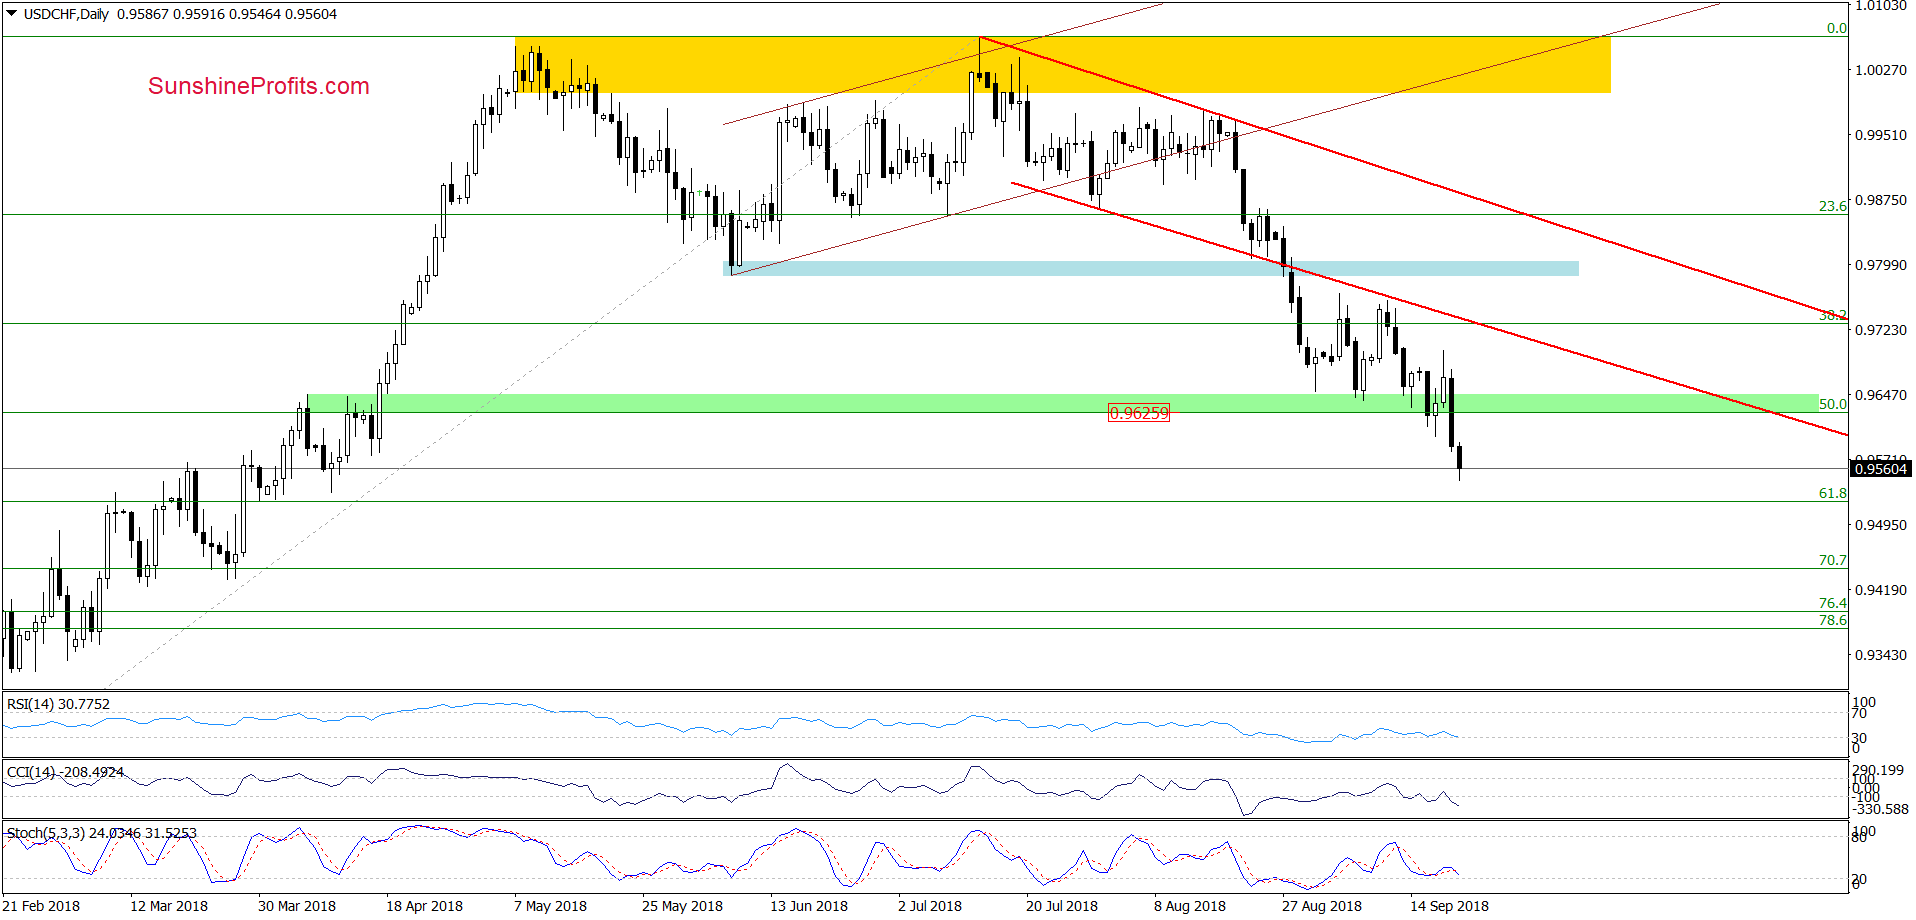
The first thing that caches the eye on the daily chart is the breakdown under the green support zone and the 50% Fibonacci retracement. Additionally, currency bears managed to close yesterday’s session below these supports, which opened the way to lower levels.
Earlier today, they continued their journey to the south, which in combination with a fresh sell signal generated by the Stochastic Oscillator suggest that USD/CHF could test April lows and the 61.8% Fibonacci retracement in the following days.
Trading position (short-term; our opinion): No positions are justified from the risk/reward perspective. We will keep you informed should anything change, or should we see a confirmation/invalidation of the above.
Thank you.
Nadia Simmons
Forex & Oil Trading Strategist
Przemyslaw Radomski, CFA
Founder, Editor-in-chief, Gold & Silver Fund Manager
Gold & Silver Trading Alerts
Forex Trading Alerts
Oil Investment Updates
Oil Trading Alerts

