

Last week's increase above the October peak was a punch to the currency bears’ pro-declining plans. Despite the positive pronouncement of the last Monday's session, the buyers didn’t defend themselves at higher levels, which resulted in a strong drop during Friday’s session. Earlier today, currency bears showed their claws once again. What came out of it?
- EUR/USD: none
- GBP/USD: none
- USD/JPY: short (a stop-loss order at 114.62; the initial downside target at 111.84)
- USD/CAD: short (a stop-loss order at 1.3401; the initial downside target at 1.2934)
- USD/CHF: short (a stop loss order at 1.0192; the initial downside target at 0.9881)
- AUD/USD: none
EUR/USD
Last Wednesday, we wrote the following:
(…) currency bulls triggered a rebound, which took EUR/USD above the lower line of the red trend channel and resulted in an invalidation of the earlier breakdown.
Earlier today, the pair verified yesterday’s move, which in combination with the current position of the daily indicators suggests that another upswing may be just around the corner.
(…) if the situation develops in line with this scenario, currency bulls will likely test the short-term yellow resistance line in the very near future.
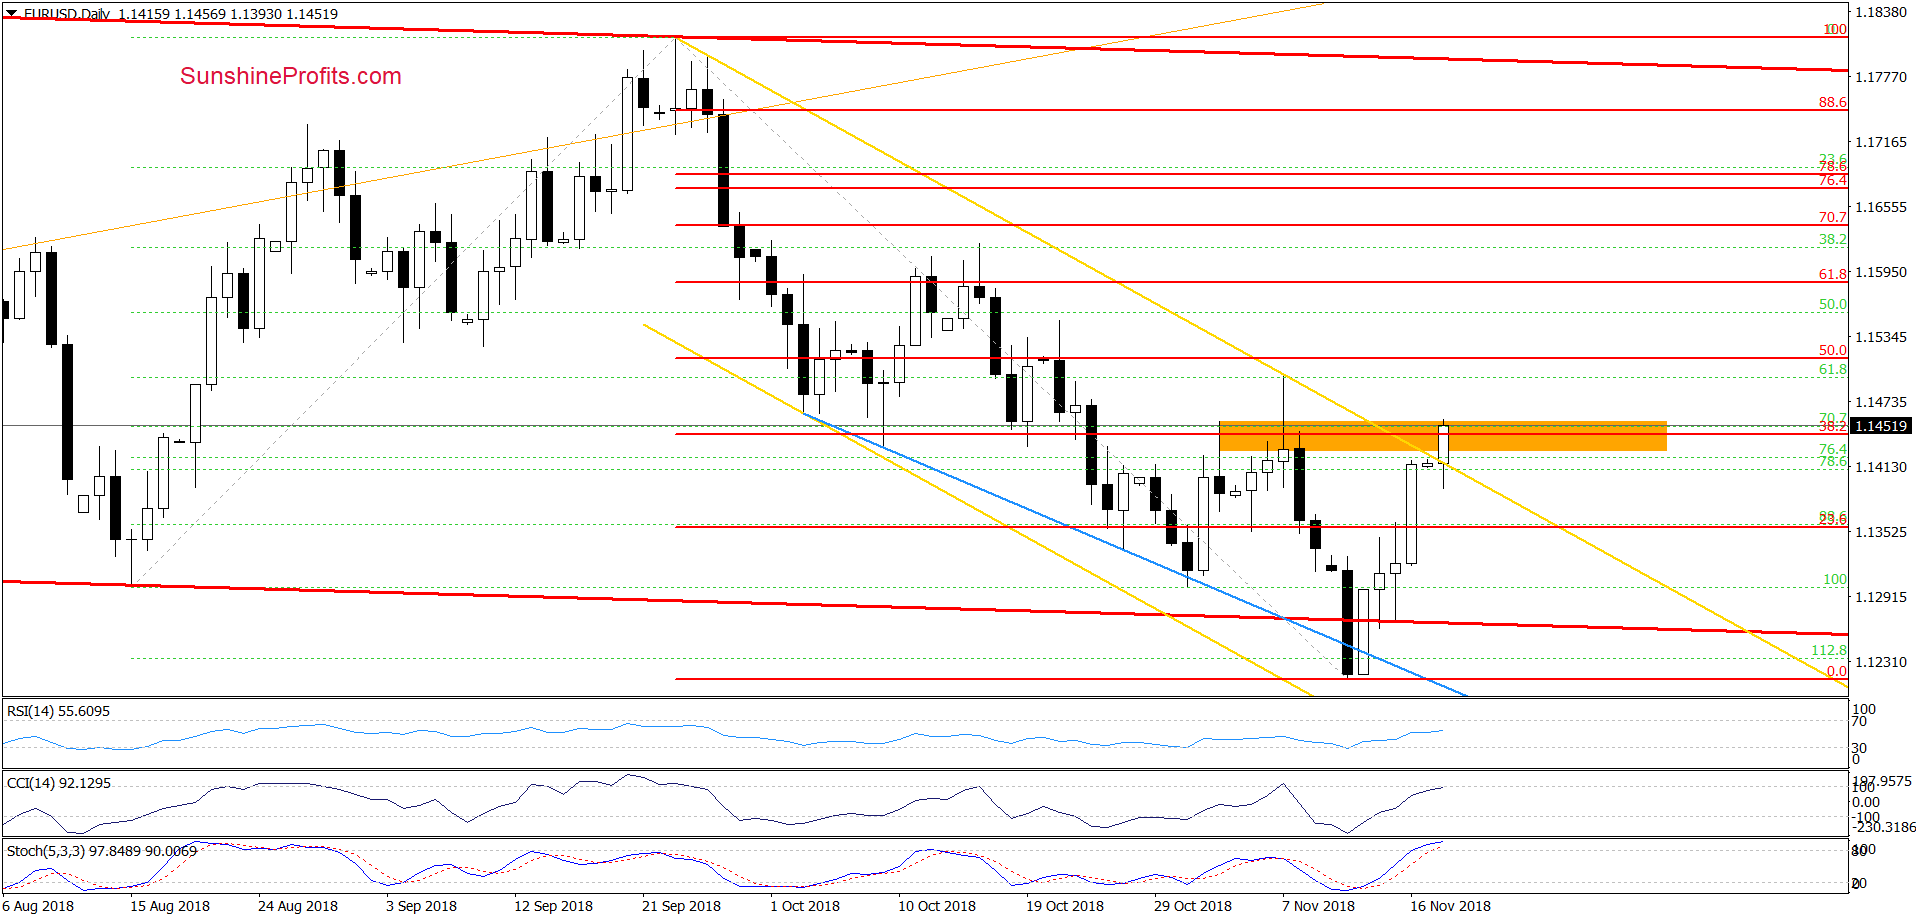
Looking at the daily chart, we see that the situation developed in line with our assumptions and the exchange extended the last week’s upward move earlier today. Thanks to this increase, the pair climbed above the yellow resistance line, which encouraged currency bulls to fight for higher values of EUR/USD.
As a result, the exchange rate moved above the 38.2% Fibonacci retracement based on the entire September – November declines, which suggests further improvement. Nevertheless, in our opinion, such price action will be more likely and reliable if the byers manage to close the day above the upper line of the range resistance zone. If they succeed, EUR/USD will likely test the November 7 peak and the 50% retracement in the following days.
Trading position (short-term; our opinion): No positions are justified from the risk/reward perspective after the stop-loss order closed our short positions.
GBP/USD
In our last commentary on this currency pair, we wrote:
(…) GBP/USD didn’t manage to climb above the orange resistance line once again, which resulted in another move to the downside. Thanks to the last week’s downswing the exchange rate invalidated the earlier tiny breakout above this line (similarly to what we saw many times in the past), which suggests further deterioration in the coming week.
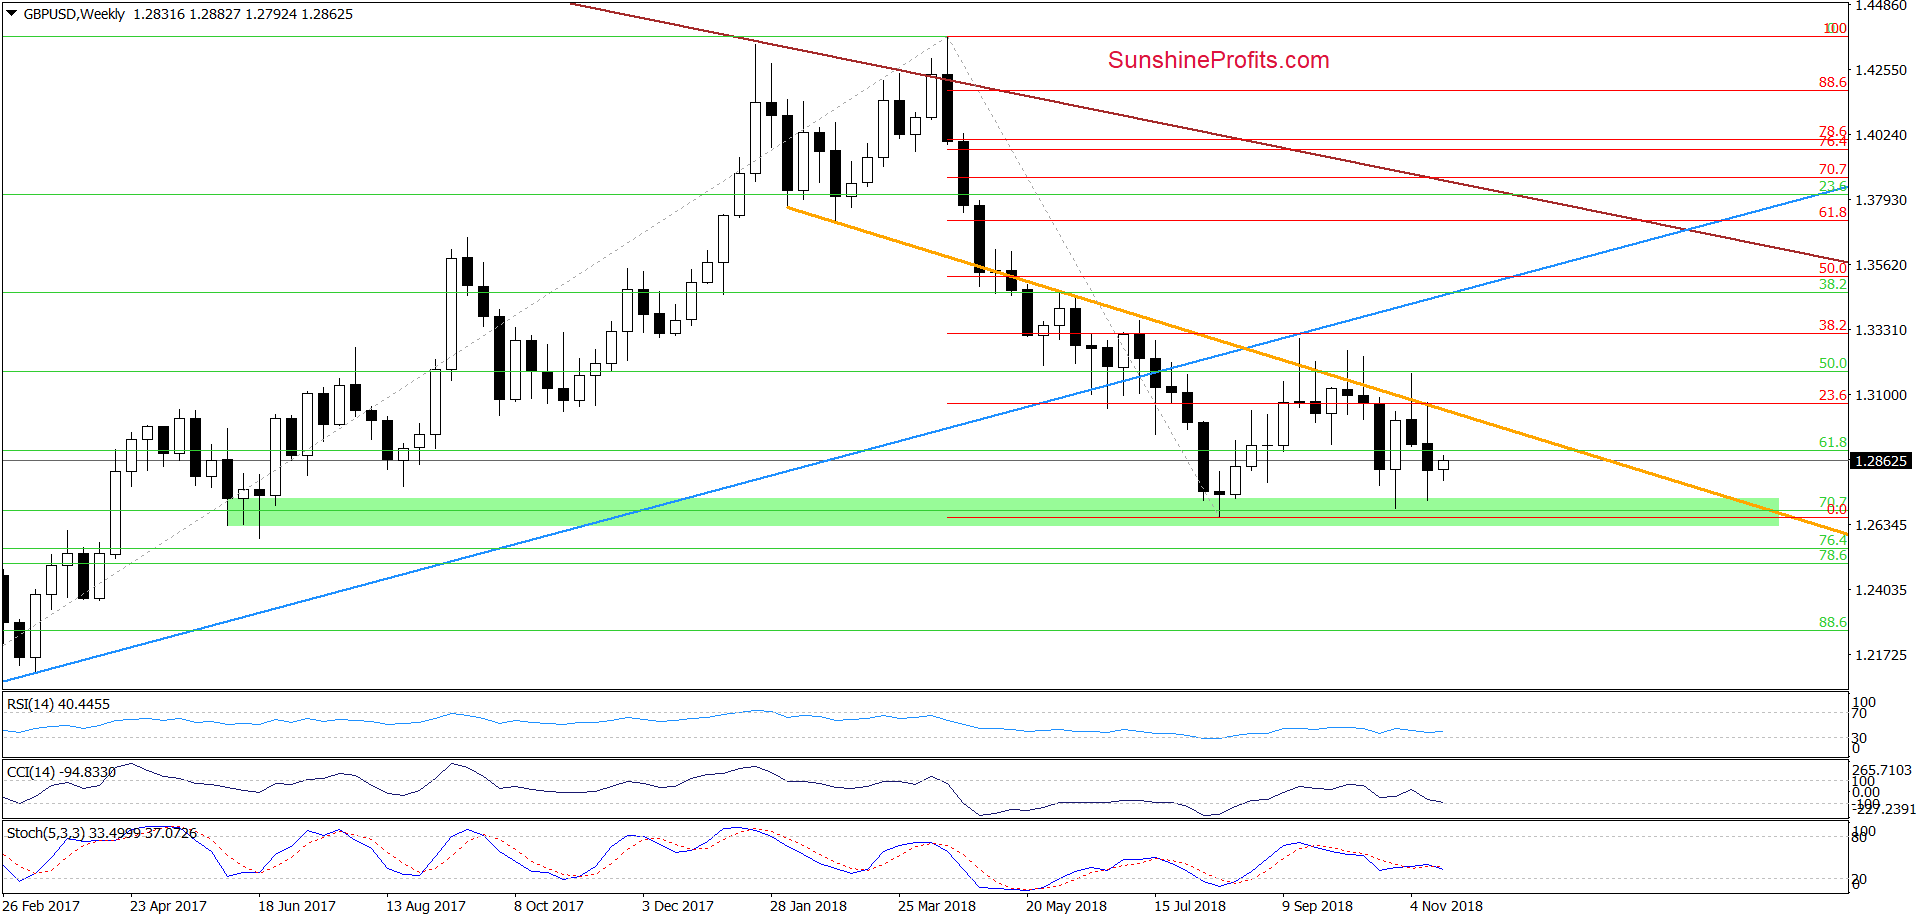
On the weekly chart, we see that currency bears pushed GBP/USD lower as we had expected. Nevertheless, despite this deterioration, the overall situation in the medium term hasn’t changed much as the pair is still trading in a quite narrow range between the above-mentioned orange resistance line and the green support zone.
What does it mean for GBP/USD? In our opinion, it means that as long as there is no breakout above the orange resistance or a breakdown below the recent lows another bigger medium-term move is not likely to be seen and short-term moves in both directions are very likely.
How did the last week’s price action affect the short-term picture of the exchange rate? Let’s examine the daily chart to find out.
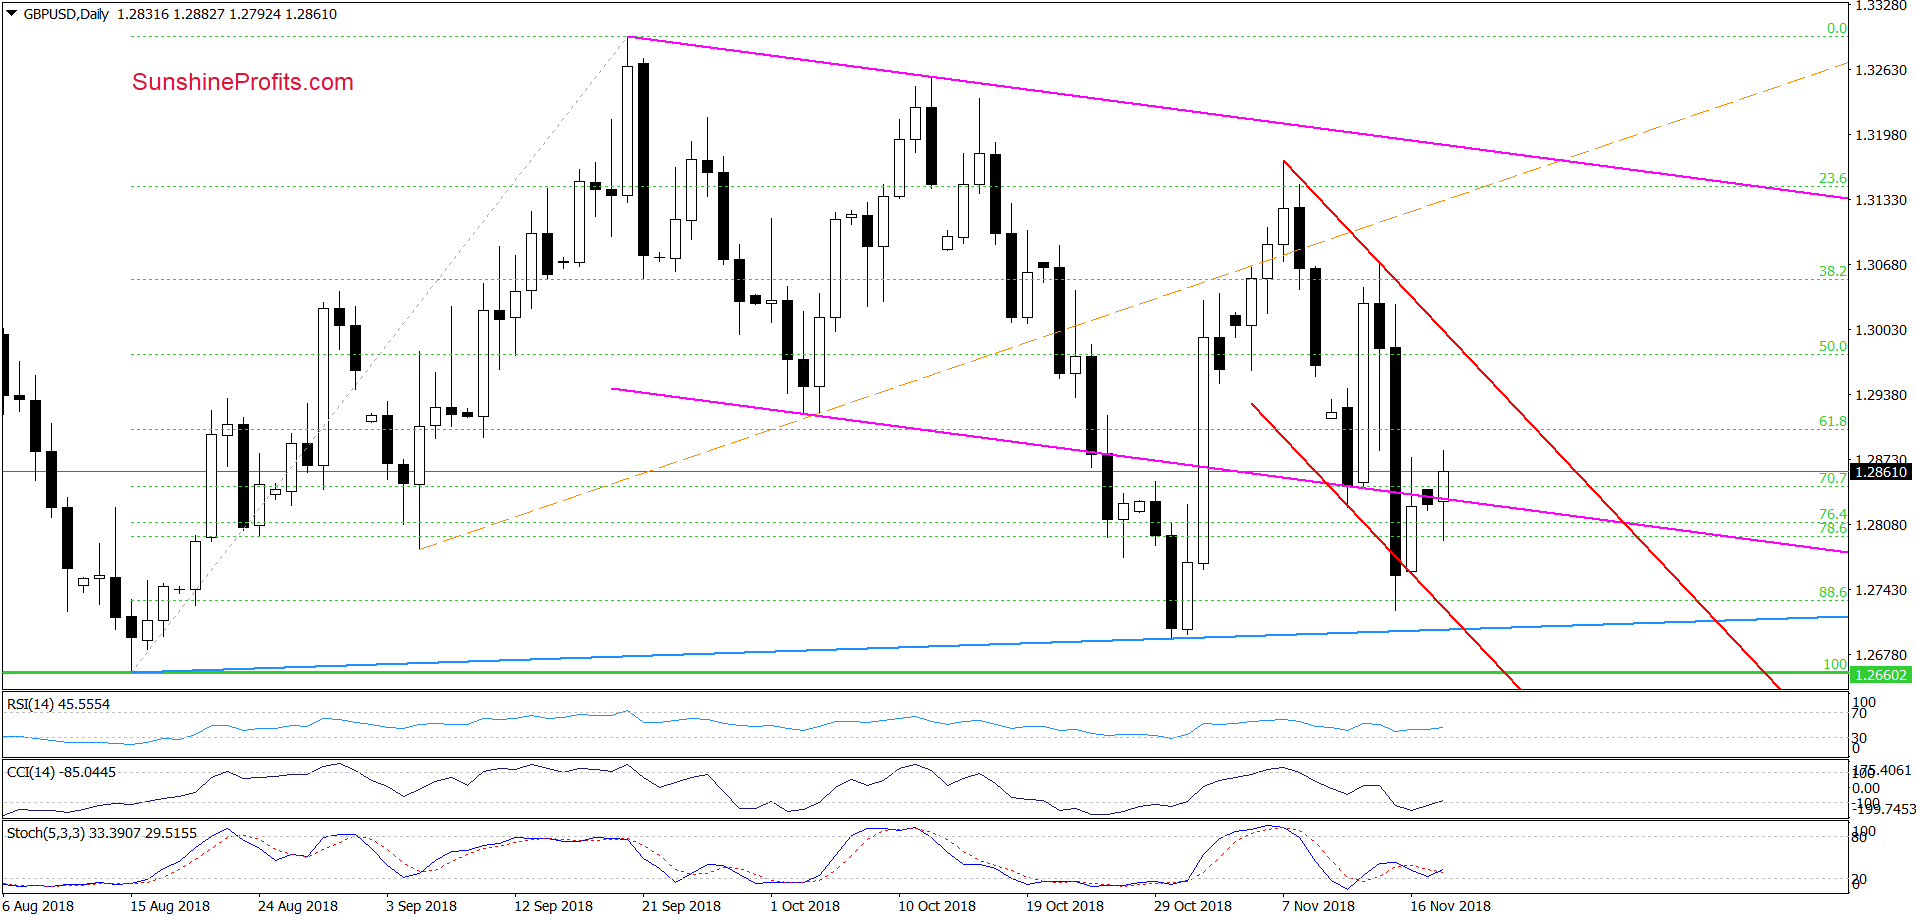
On the above chart, we see that although GBPUSD bounced off the lower border of pink declining trend channel in the previous week, the sellers shower their strength in the following days, pushing the exchange rate under the pink channel.
Thanks to this sharp drop, the pair also slipped slightly below the lower line of the very short-term red declining trend channel, approaching the last-October lows and the blue support line based on the previous lows.
From today’s point of view, we see that Friday’s invalidation of the tiny breakdown under the red channel triggered a move to the north and an invalidation of the breakdown below the pink channel.
Nevertheless, considering the very sudden changes that took place last week, we prefer to treat this currency pair with caution. Therefore, as long as GBP/USD remains between the levels we described analyzing the weekly chart, we probably will not decide to open any positions. If, however, anything changes and one of the sides of the market shows greater credibility (by closing the session above the upper line of the red declining channel), we will consider opening long positions, but with very tight stop-loss order and the initial target. We will keep you informed.
Trading position (short-term; our opinion): None positions are justified from the risk/reward perspective.
USD/CHF
Quoting our Thursday’s commentary:
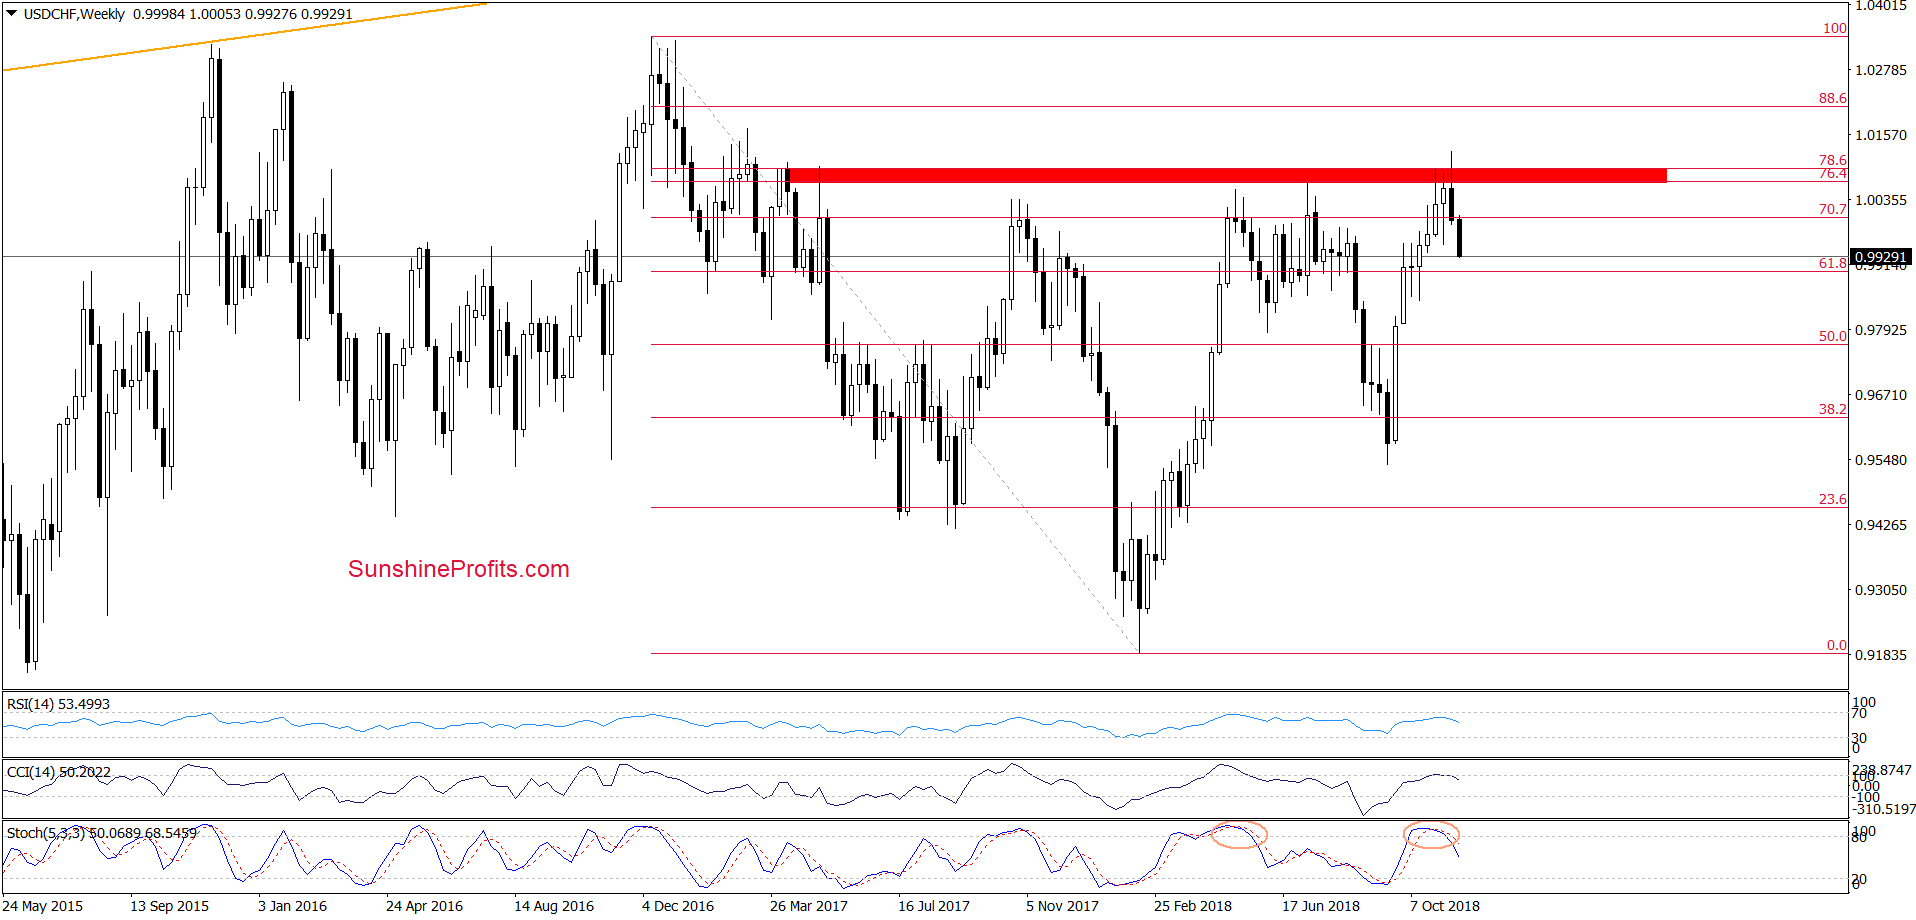
The first thing that catches the eye on the weekly chart is an invalidation of the earlier breakout above the red resistance zone (created by the 76.4% and the 78.6% Fibonacci retracements), which doesn’t bode well for further rally.
Additionally, there are very high readings of the medium-term indicators and the sell signal generated by the Stochastic Oscillator, which increase the probability of another reversal from here in the coming week(s). This scenario is also reinforced by the fact that this area was strong enough to stop the buyers several times in the past, triggering bigger moves to the downside.
On top of that, we also found pro-decline factors by analyzing the daily chart:
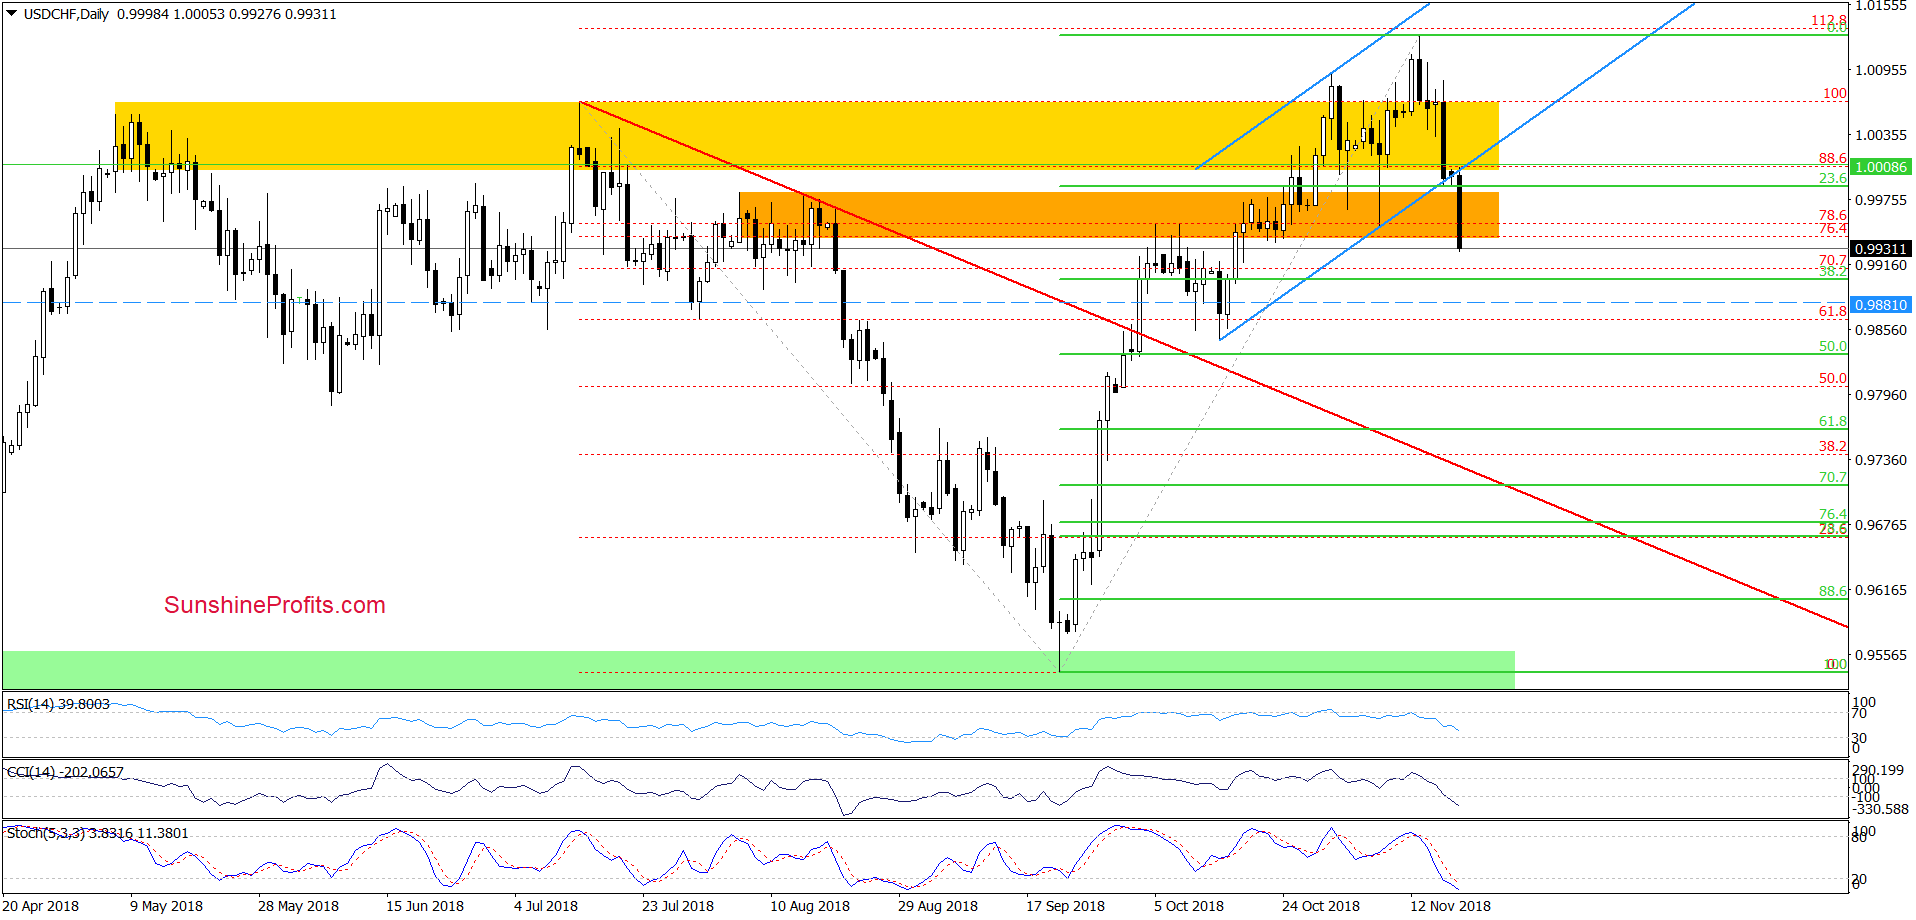
(…) although USD/CHF broke above the October peak, the proximity to the 112.8% Fibonacci extension (and the medium-term resistance zone) encouraged currency bears to act.
Thanks to their attack, the exchange rate pulled back, invalidating the earlier breakout above the yellow resistance zone (…) Additionally, all daily indicators generated the ell signals, suggesting that further deterioration is just around the corner.
Therefore, if the situation develops in line with the above assumption and USD/CHF declines from current levels, we’ll see at least a test of the lower border of the blue rising trend channel in the very near future.
From today's point of view, we see that USD/CHF not only tested the above-mentioned downside target on Friday, but also broke below it, making our short positions even more profitable earlier today.
Taking this bearish development into account, we believe that the exchange rate will extend declines and test the 38.2% Fibonacci retracement or even the mid-October lows in the coming week.
Trading position (short-term; our opinion): profitable short positions with a stop loss order at 1.0192 and the initial downside target at 0.9881 are justified from the risk/reward perspective.
Administrative Note Regarding This and Next Week’s Publication Schedule
The long Thanksgiving weekend is approaching. There will be no / limited trading in the final part of this week and we will be taking this opportunity to take some time off from our regular analyses. Tomorrow’s Alert will be published normally, and Wednesday’s Alert will likely be very brief. There will be no regular Alerts on Thursday and Friday. The Monday’s (November 26th) and Tuesday’s (November 27th) Alerts will most likely be very short as well.
However, the above does not mean that we will stop monitoring the market entirely. Conversely, the time is quite critical, so despite taking time off from regular tasks, we will be monitoring the market and if anything urgent happens, we will let you know through a quick intraday Alert.
Thank you.
Nadia Simmons
Forex & Oil Trading Strategist
Przemyslaw Radomski, CFA
Founder, Editor-in-chief, Gold & Silver Fund Manager
Gold & Silver Trading Alerts
Forex Trading Alerts
Oil Investment Updates
Oil Trading Alerts

