

Although USD/CHF climbed to an important resistance zone, daily indicators generated sales signals and a pro-bearish candlestick formation appeared on the daily chart, the sellers weren’t unable to generate a sizable move to the downside, which could take USD/CHF to the south. What bothers them so much?
In our opinion the following forex trading positions are justified - summary:
- EUR/USD: long (a stop-loss order at 1.1616; the initial upside target at 1.1825)
- GBP/USD: none
- USD/JPY: none
- USD/CAD: short (a stop-loss order at 1.3503; the initial downside target at 1.3003)
- USD/CHF: none
- AUD/USD: none
EUR/USD
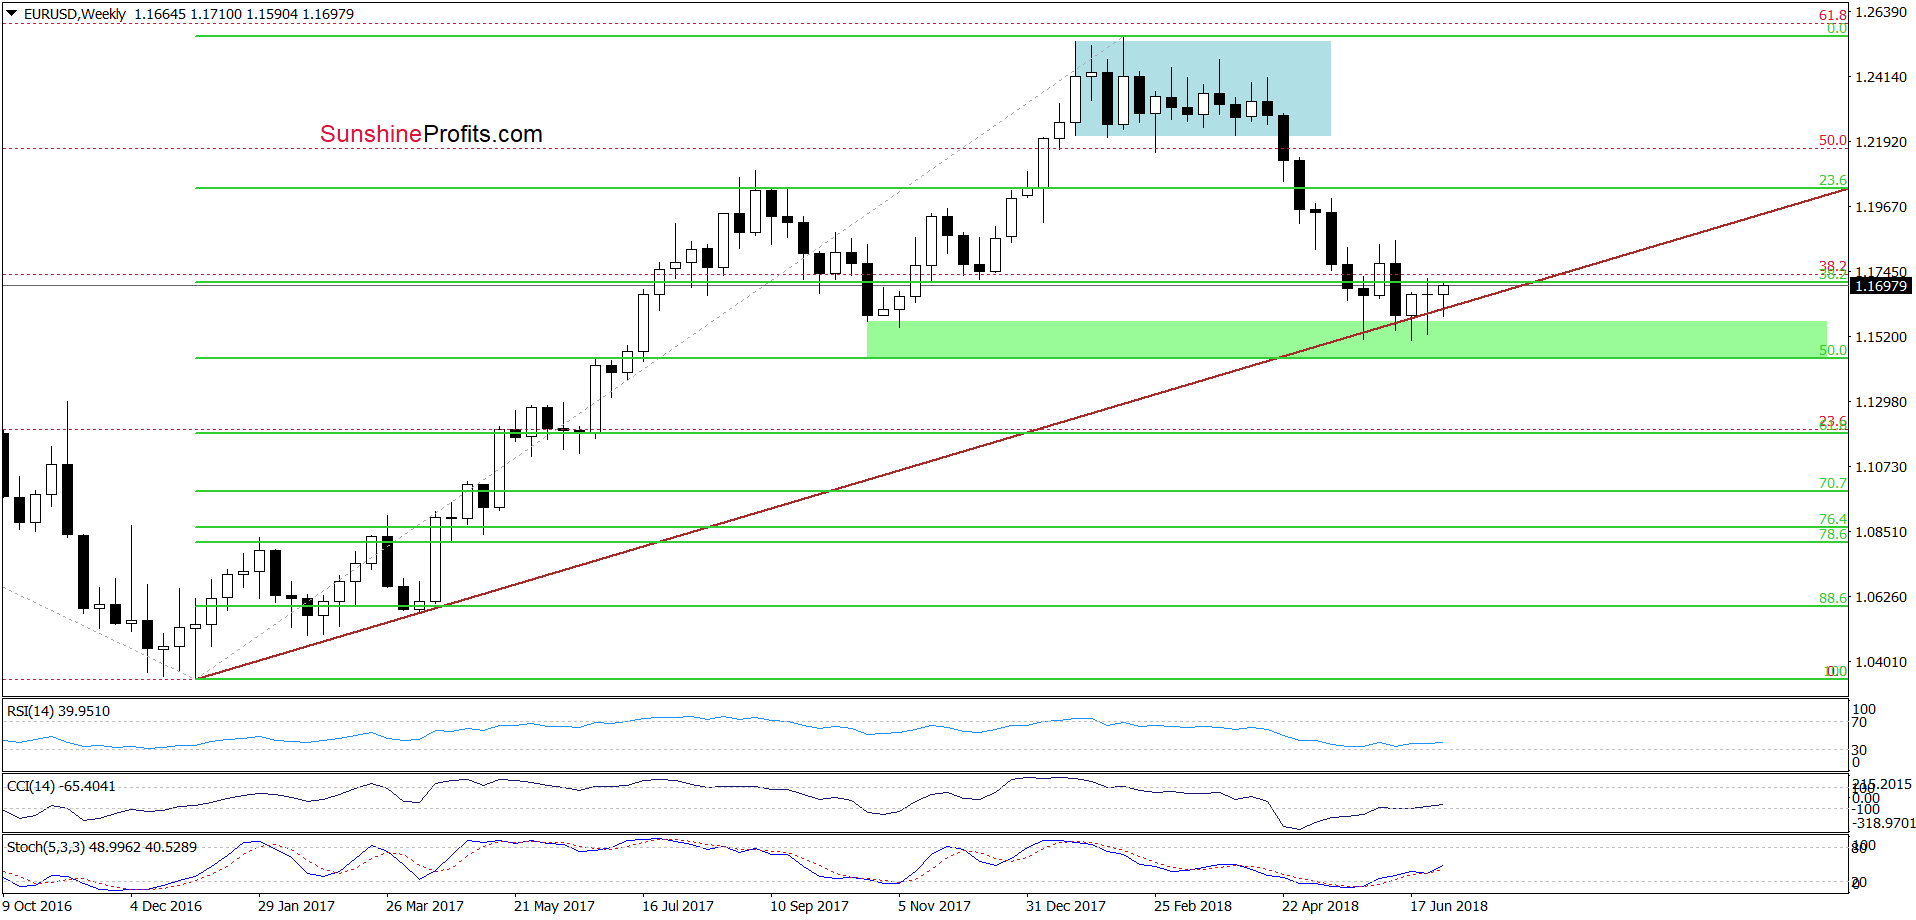
On the weekly chart, we see that EUR/USD extended gains above the long-term brown rising support line, which suggests a test of the June peak in the coming week.
Are there any resistances that could thwart pro-growth plans?
Before we answer this question, let’s recall the quote from our last Forex Trading Alert:
(…) the exchange rate remains under the upper border of the brown triangle, which means that further improvement will be more likely only if we see a breakout above this resistance line.
What can happen if we see such price action? If currency bulls show strength, the pair will likely also break above the late June high and test 23.6% Fibonacci retracement or even the yellow resistance zone (created by the June peaks) in the following days.
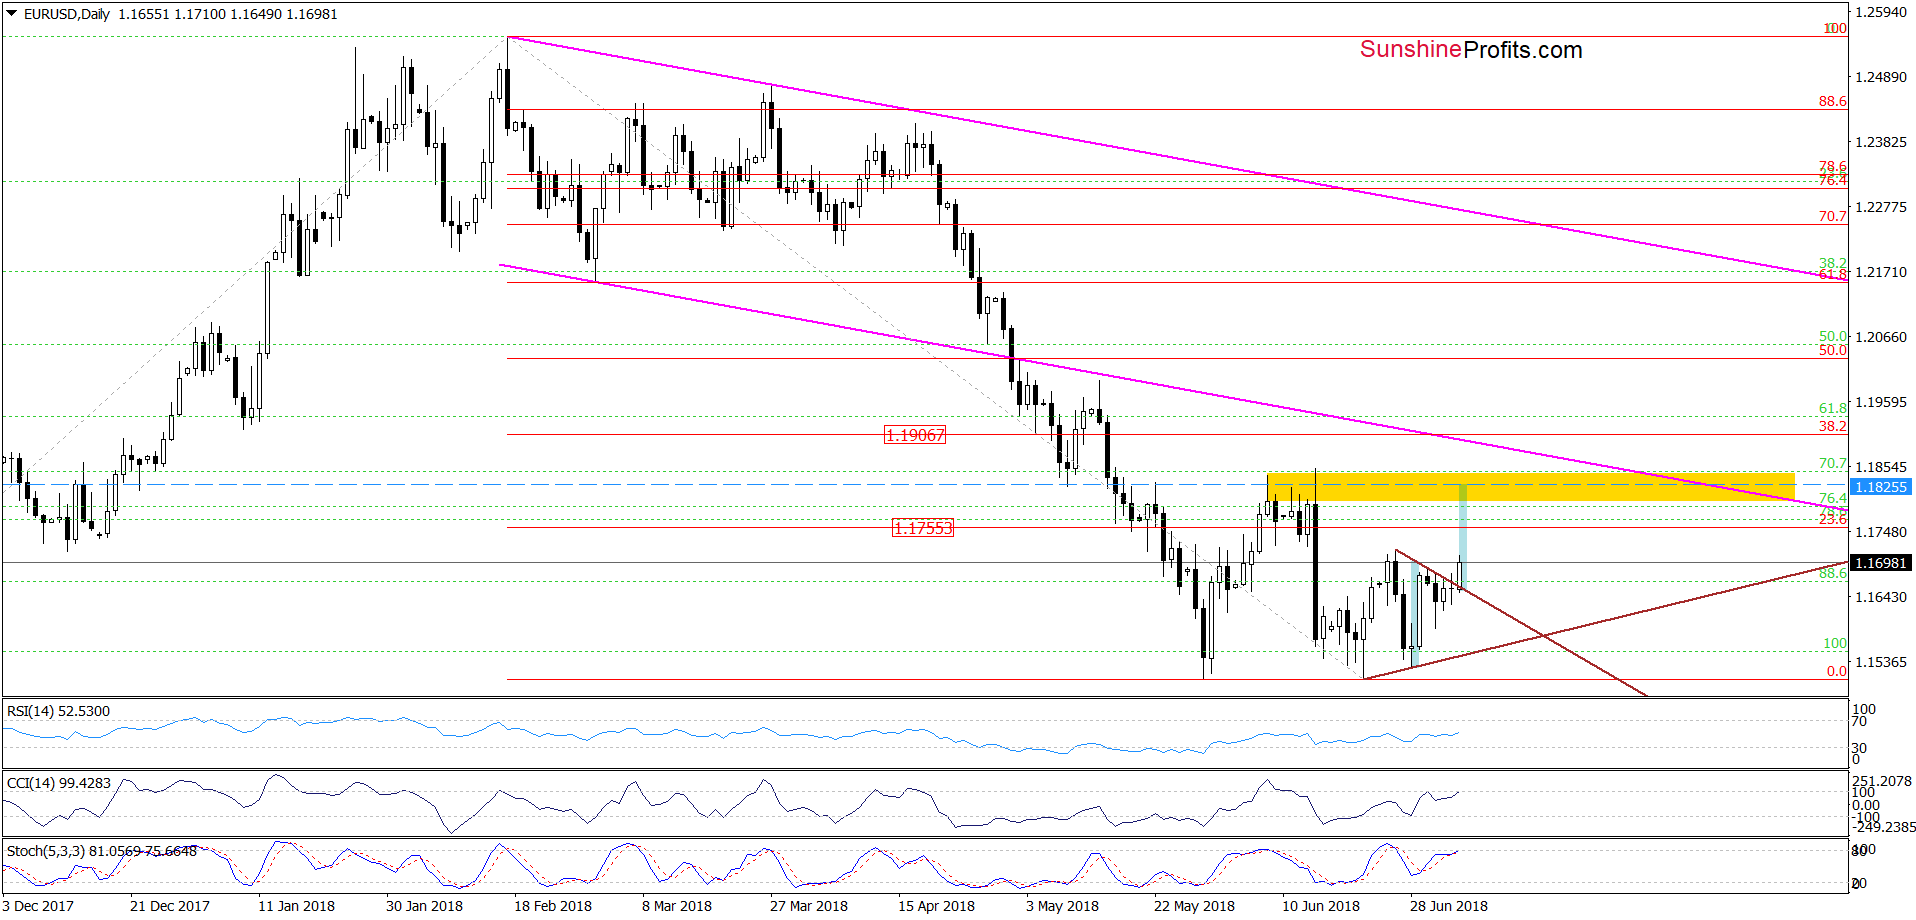
The first thing that catches the eye on the short-term chart is the breakout above the upper line of the triangle, which suggests further improvement and a test of the yellow resistance zone in the coming days.
Additionally, in this area, the size of the upward move will correspond to the height of the triangle, which increases the probability that market participants will reach (at least) the level of 1.1825.
Taking all the above into account, we think that opening long position with a stop-loss order at 1.1616 and an initial upside target at 1.1825 is justified from the risk/reward perspective.
Trading position (short-term; our opinion): Long positions (with a stop-loss order at 1.1616 and an initial upside target at 1.1825) are justified from the risk/reward perspective. We will keep you informed should anything change, or should we see a confirmation/invalidation of the above.
USD/JPY
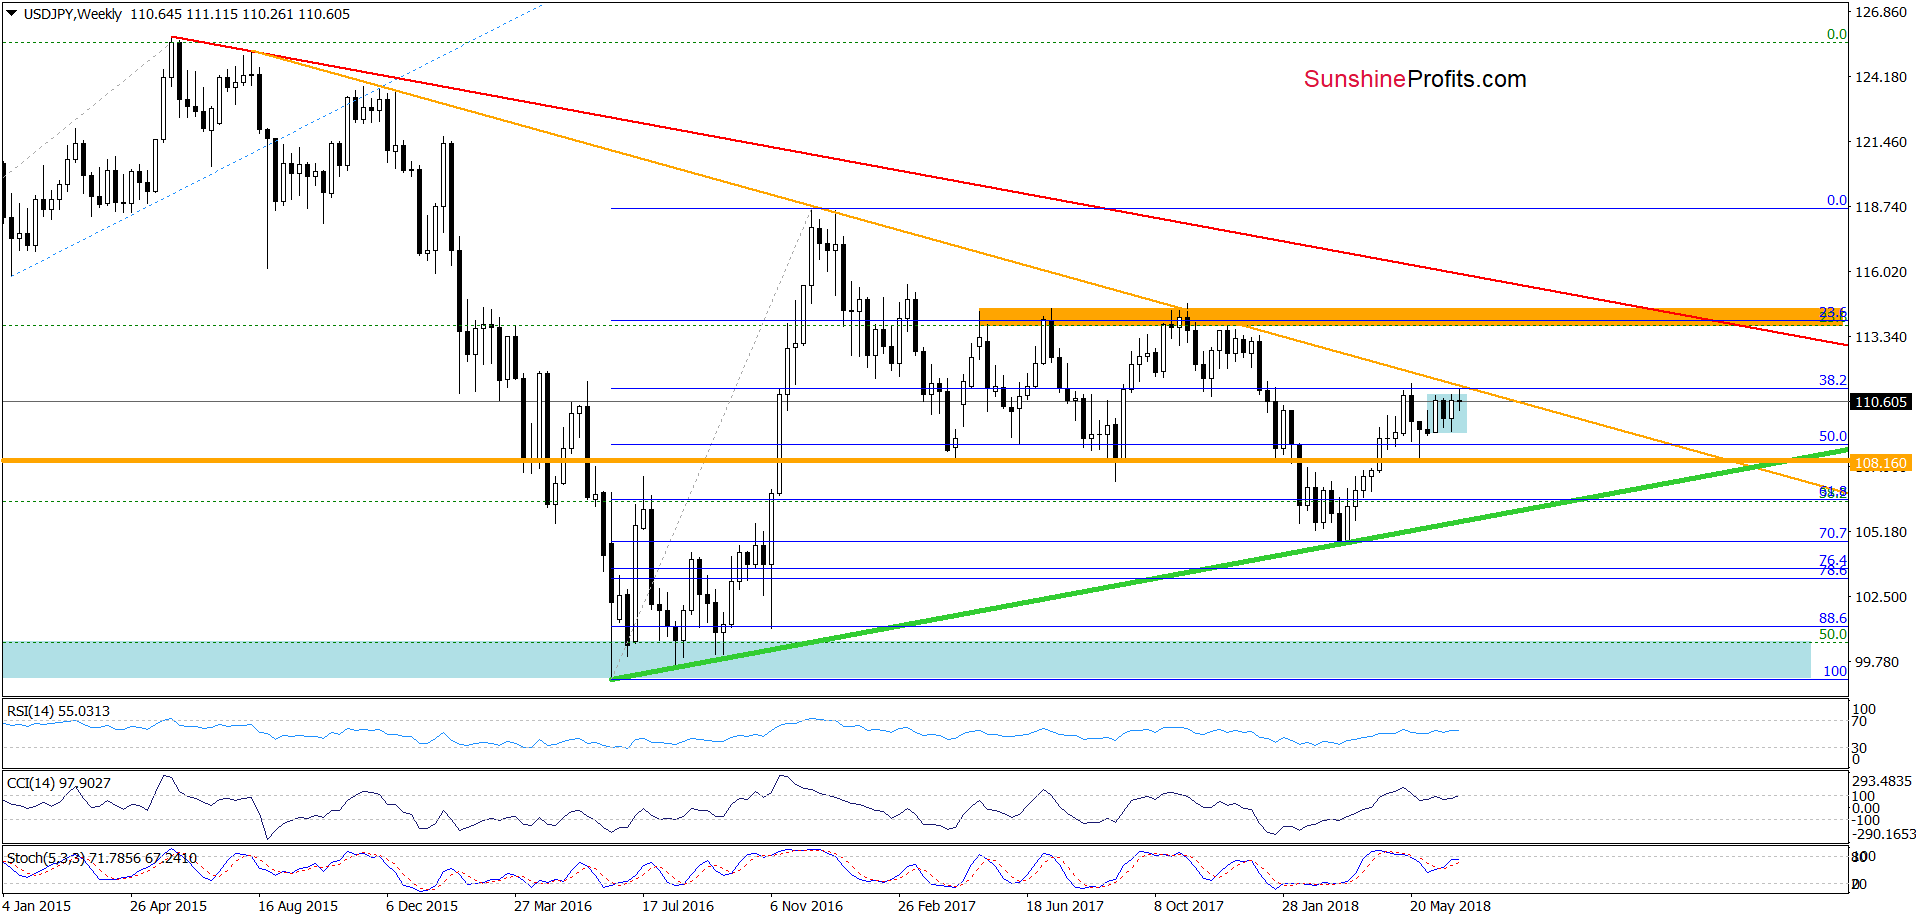
Earlier this week, currency bulls tried to push USD/JPY above the upper border of the blue consolidation, but the major resistance line based on the August, December 2015 and January 2017 peaks (marked with orange) stopped them, triggering a pullback.
Similar situation, w saw many times in the last quarter of 2017, which means that as long as there is no breakout above it a sizable move to the upside is quite doubtful and lower values of USD/JPY should not surprise us.
Will the very short-term chart give currency bulls more hope for higher levels?
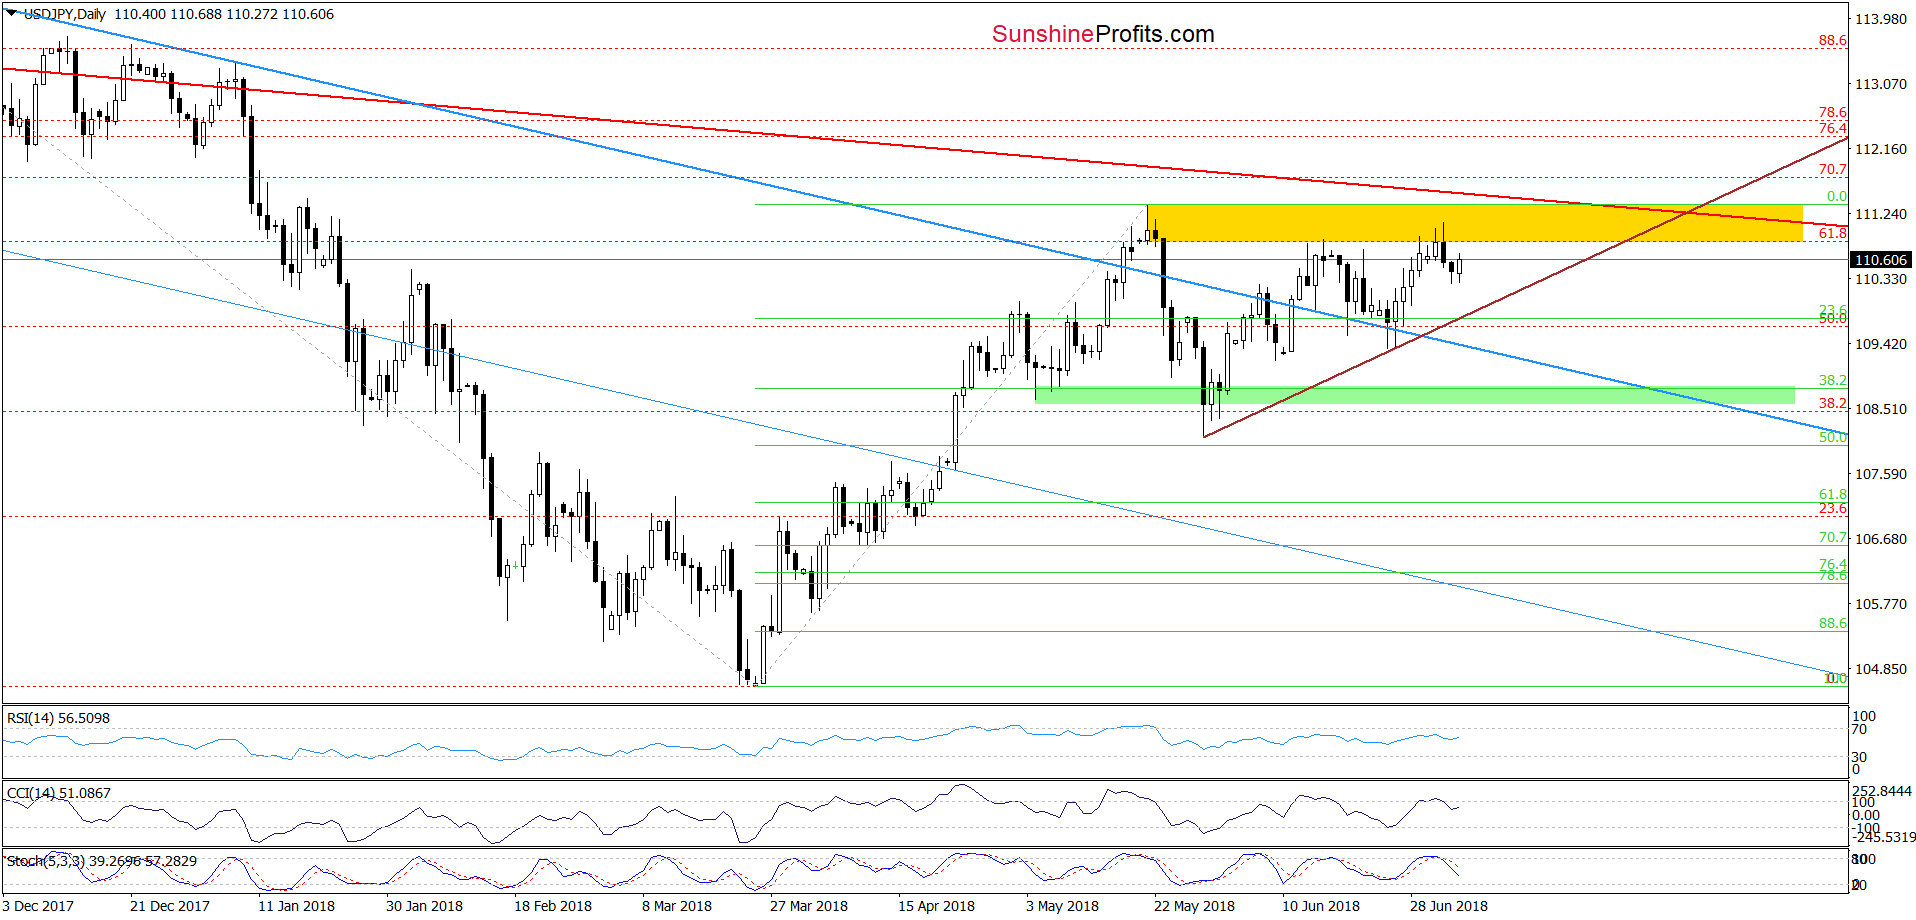
Not really, because the currency pair is still trading under the yellow resistance zone based on the previous highs.
Additionally, the current position of the indicators also favors their opponents as the CCI and the Stochastic Oscillator generated sell signals suggesting that further deterioration is only a matter of time (probably a very short time).
If this is the case and the exchange rate reverses from current levels, we’ll likely see a test of the strength of the brown rising support line based on the previous lows (currently around 109.78) in the following days.
Trading position (short-term; our opinion): No positions are justified from the risk/reward perspective. We will keep you informed should anything change, or should we see a confirmation/invalidation of the above.
USD/CHF
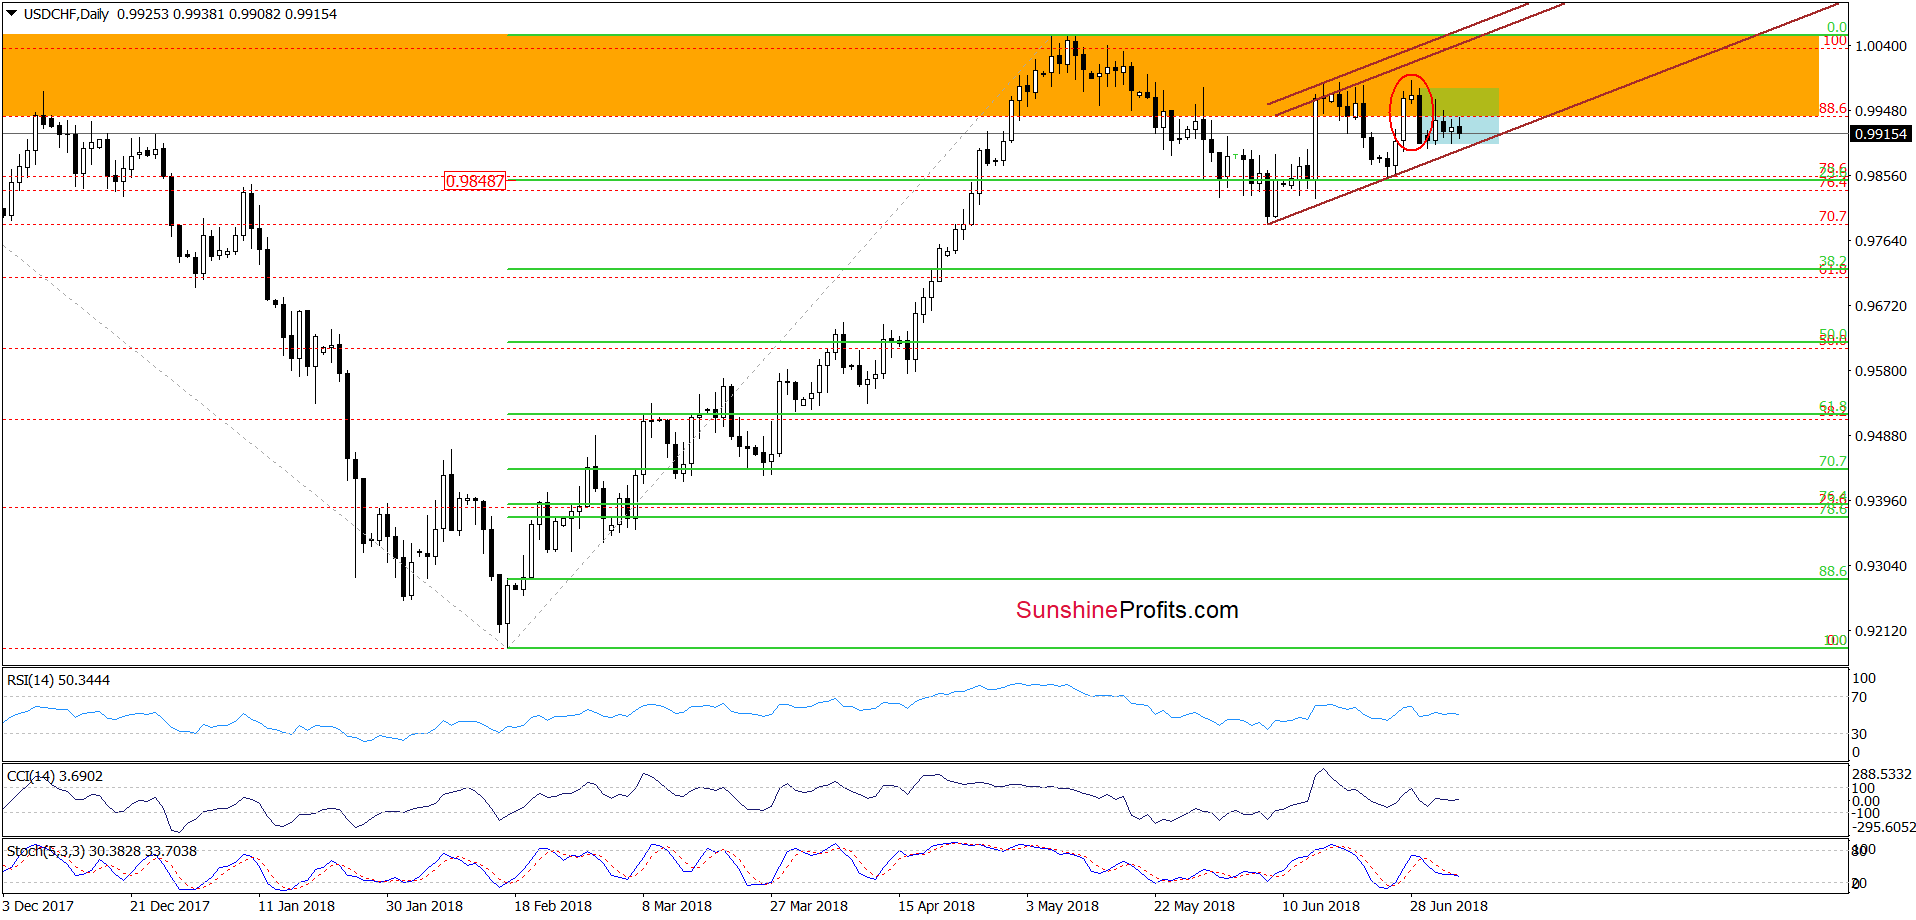
Looking at the daily chart, we see that the overall situation in short term hasn’t changed much as USD/CHF remains in the blue consolidation between the orange resistance zone and the lower border of the brown rising trend channel, which makes the very short-term picture a bit unclear.
Why? Because as long as there is no breakout above the orange resistance zone or a breakdown below the lower line of the consolidation and the brown rising trend channel a bigger move is not likely to be seen.
What are the arguments of currency bears?
- First, the sell signals generated by the daily indicators.
- Second, USD/CHF created an evening star on the daily chart (we marked it with a red ellipse), which is a pro-bearish candlestick formation that reinforces the resistance area created by the June peaks.
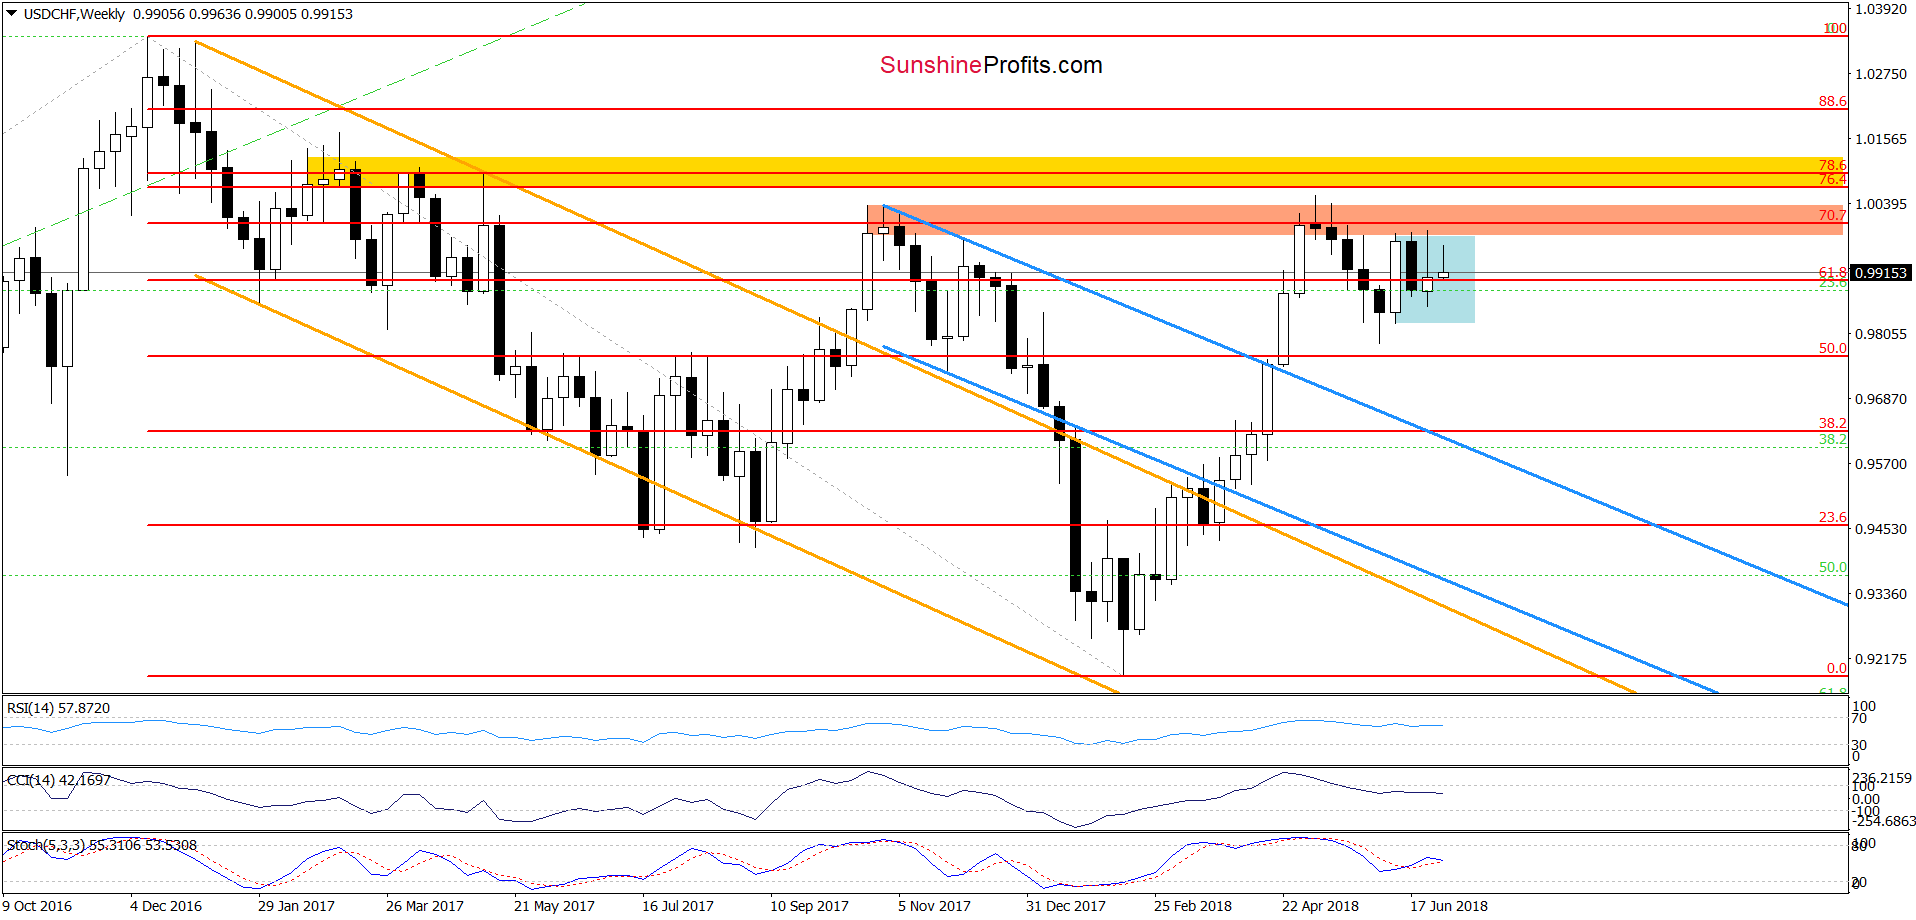
- Third, even if the pair goes higher from here, currency bulls will have to overcome the yellow resistance zone (marked on the weekly chart below) before they can enjoy significant increases.
Taking all of the above factors into account, the question arises: why the bears were not able to generate a sizable move to the south in previous weeks? Well, the best answer to this question you will find on the long-term chart below.
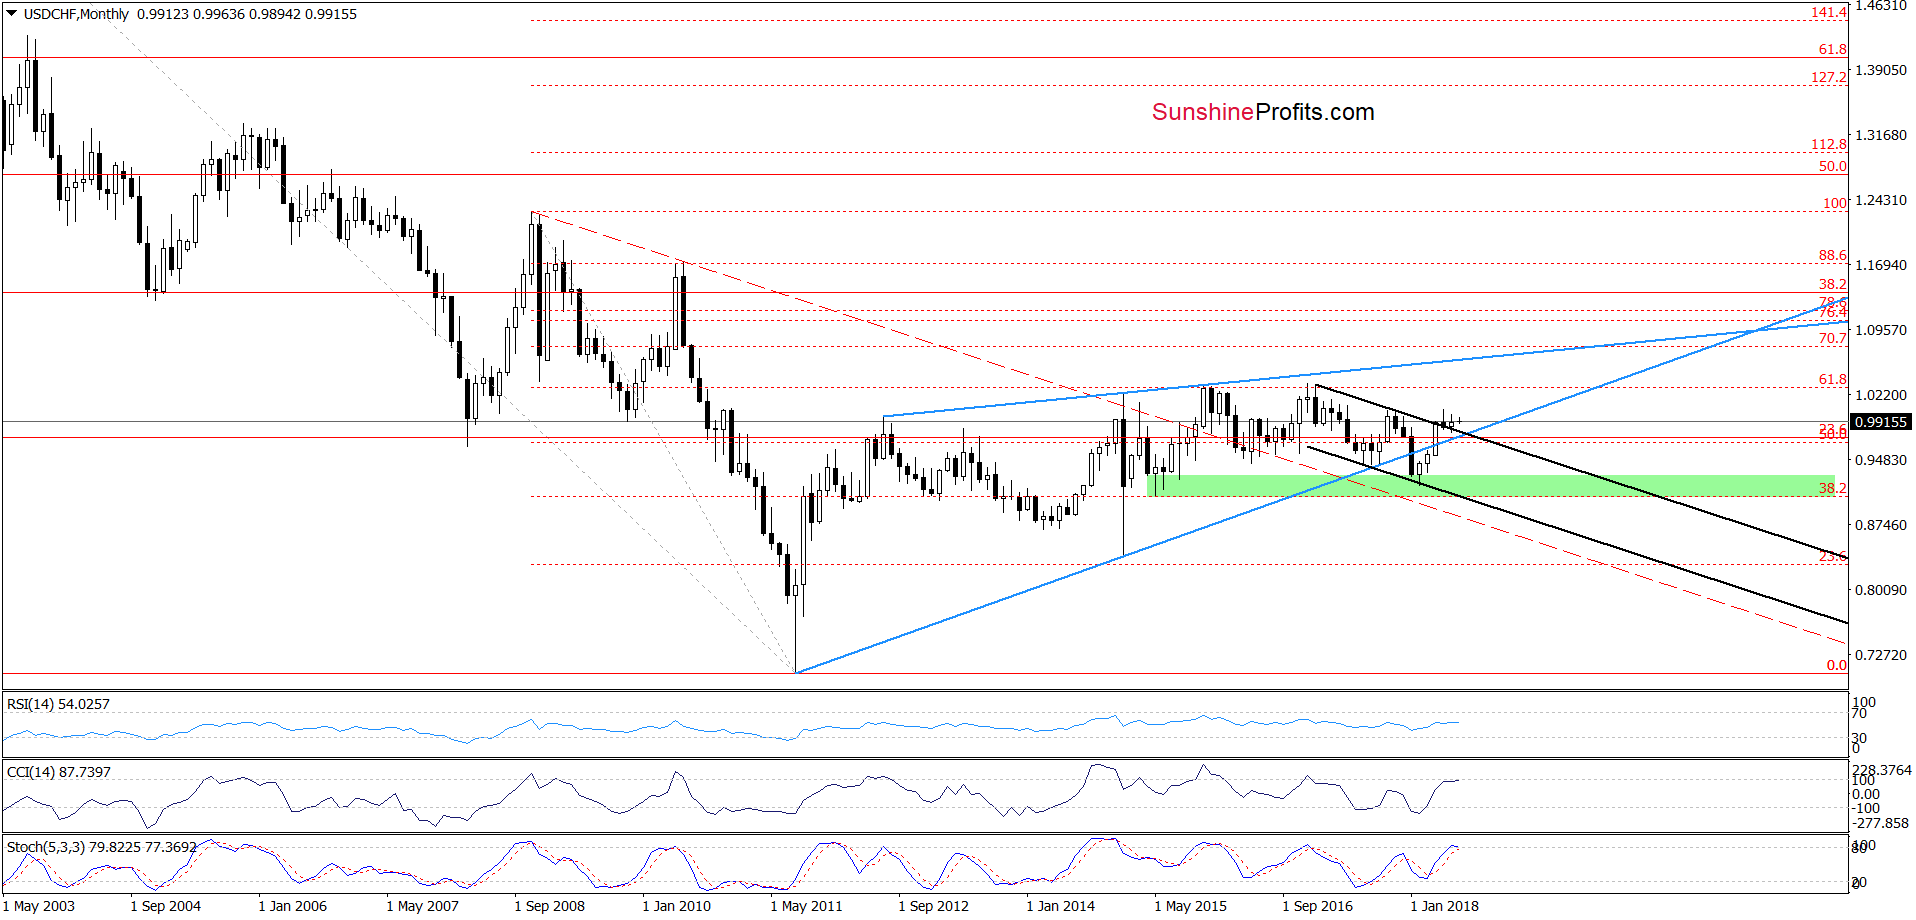
From the monthly perspective, we see that USD/CHF broke above the upper line of the black declining trend channel in April. Although currency bears tried to push the exchange rate below it in recent months, all their attempts failed, which means that their opponents have as solid ally on their side. In other words, as long as there is no invalidation of the breakout above this important line (the major support at the moment), a sizable move to the downside is not likely to be seen and one more move to the upside should not surprise us in the coming weeks.
Trading position (short-term; our opinion): No positions are justified from the risk/reward perspective. We will keep you informed should anything change, or should we see a confirmation/invalidation of the above.
Thank you.
Nadia Simmons
Forex & Oil Trading Strategist
Przemyslaw Radomski, CFA
Founder, Editor-in-chief, Gold & Silver Fund Manager
Gold & Silver Trading Alerts
Forex Trading Alerts
Oil Investment Updates
Oil Trading Alerts

