

Although USD/CAD broke above the medium-term declining resistance line, currency bulls didn’t manage to trigger further improvement, which resulted in a pullback. Will we see a verification of this breakout or rather further deterioration in the coming days?
In our opinion the following forex trading positions are justified - summary:
- EUR/USD: short (a stop-loss order at 1.2250; the initial downside target at 1.1466)
- GBP/USD: short (a stop-loss order at 1.3773; the initial downside target at 1.3317)
- USD/JPY: none
- USD/CAD: none
- USD/CHF: none
- AUD/USD: none
EUR/USD
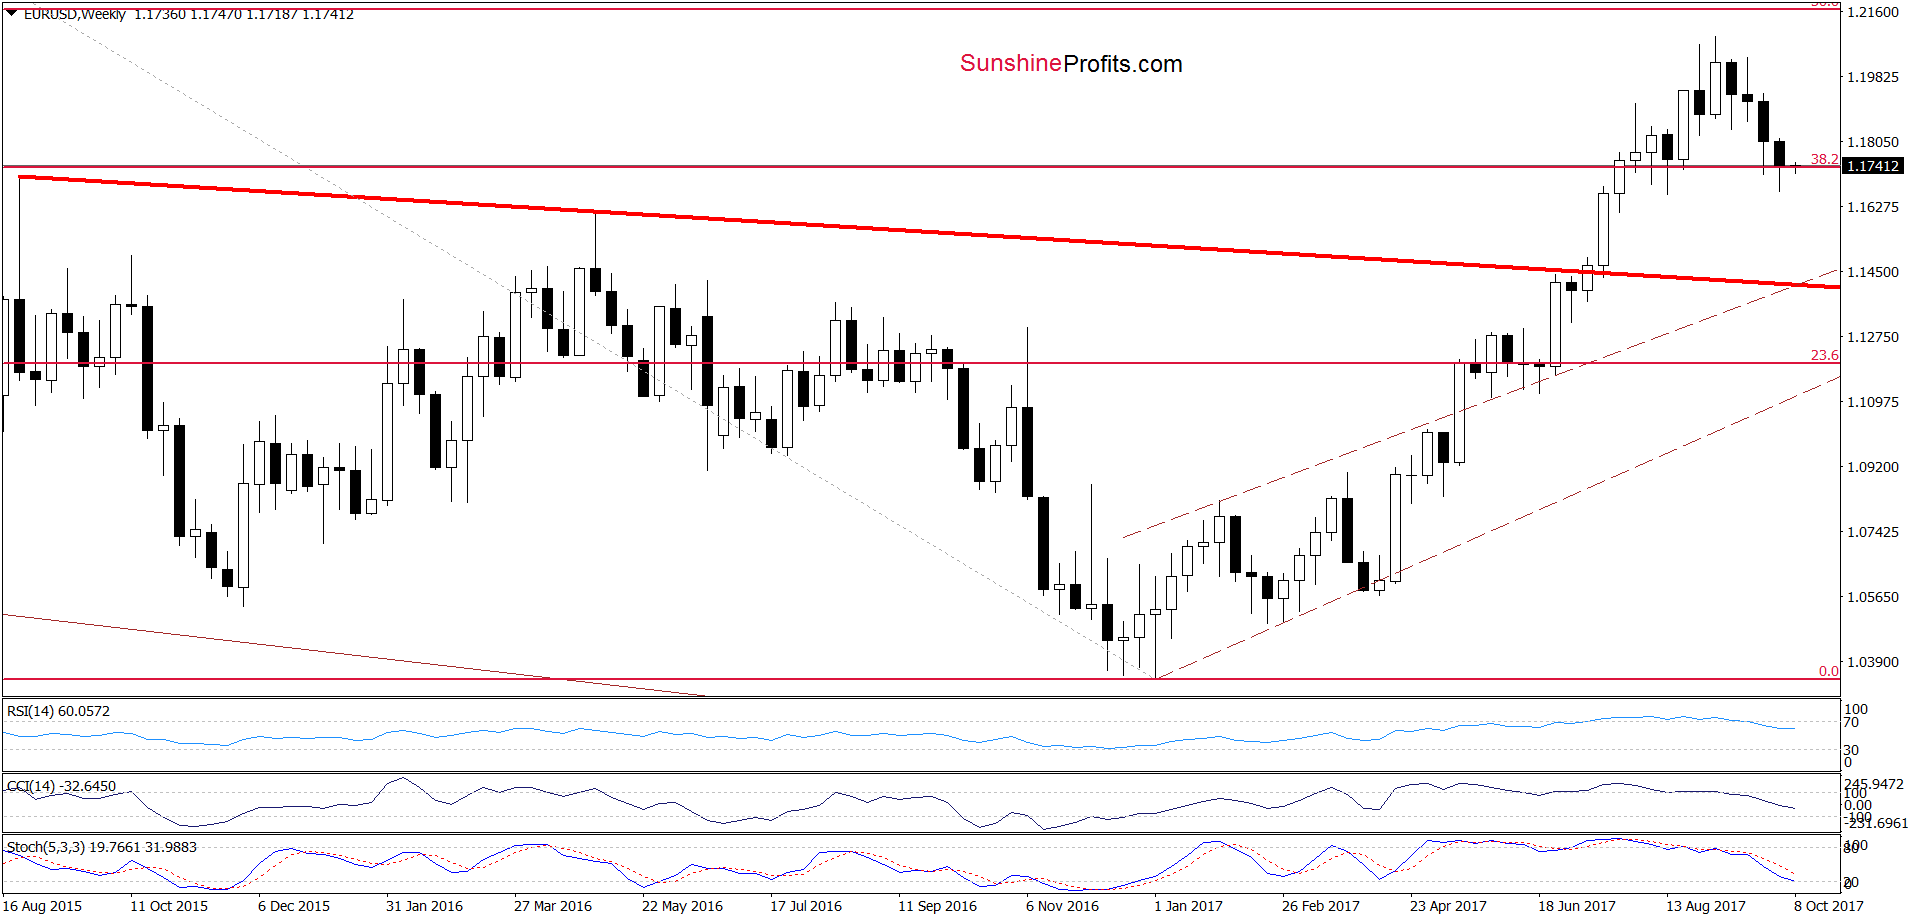
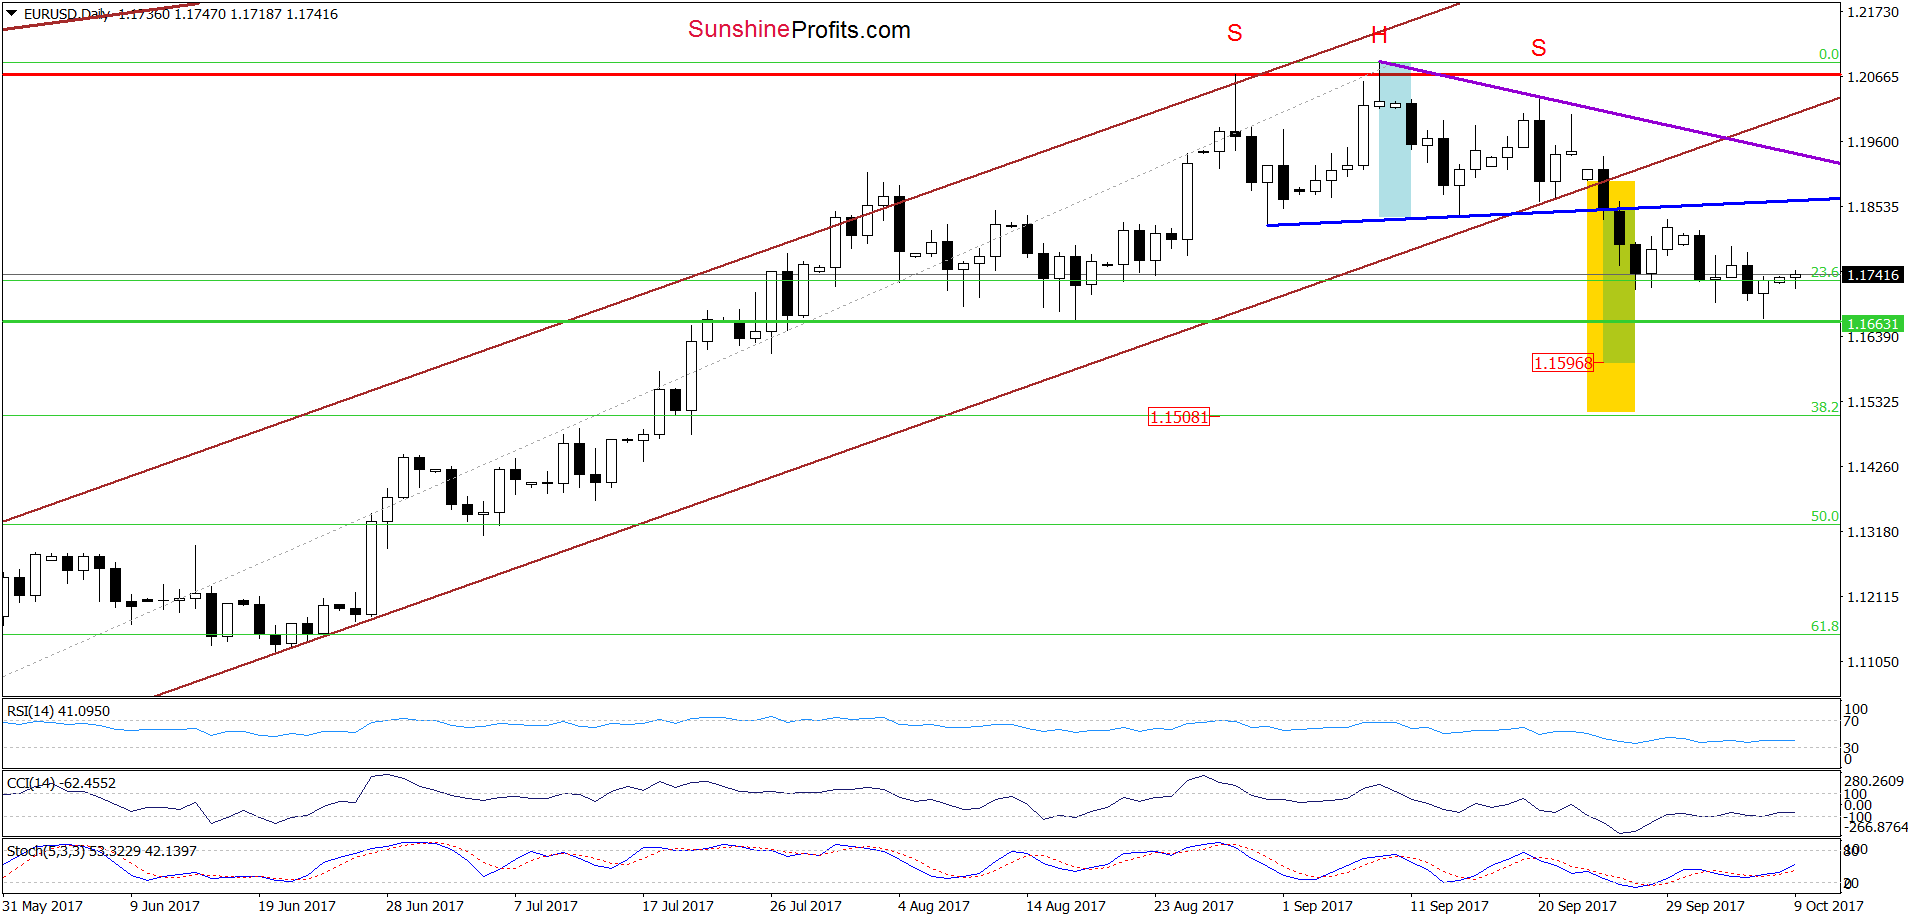
Looking at the above charts, we see that the overall situation hasn’t changed much as EUR/USD is trading around the previously-broken 38.2% Fibonacci retracement (seen on the weekly chart) and the 23.6% Fibonacci retracement marked on the daily chart. Nevertheless, taking into account Friday drop to the green horizontal support line (based on the mid-August low) and the buy signals generated by the daily indicators, it seems that we may see a short-lived rebound (even to the last week highs) in the coming days.
Will such price action change anything? In our opinion, it’s doubtful, because as long as the exchange rate remains under the neck line of the head and shoulders formation (the blue resistance line), this bearish pattern is underway, suggesting lower values of EUR/USD.
Very short-term outlook: mixed with bearish bias
Short-term outlook: bearish
MT outlook: mixed
LT outlook: mixed
Trading position (short-term; our opinion): Short profitable positions (with a stop-loss order at 1.2250 and the initial downside target at 1.1466) are justified from the risk/reward perspective. We will keep you informed should anything change, or should we see a confirmation/invalidation of the above.
USD/CAD
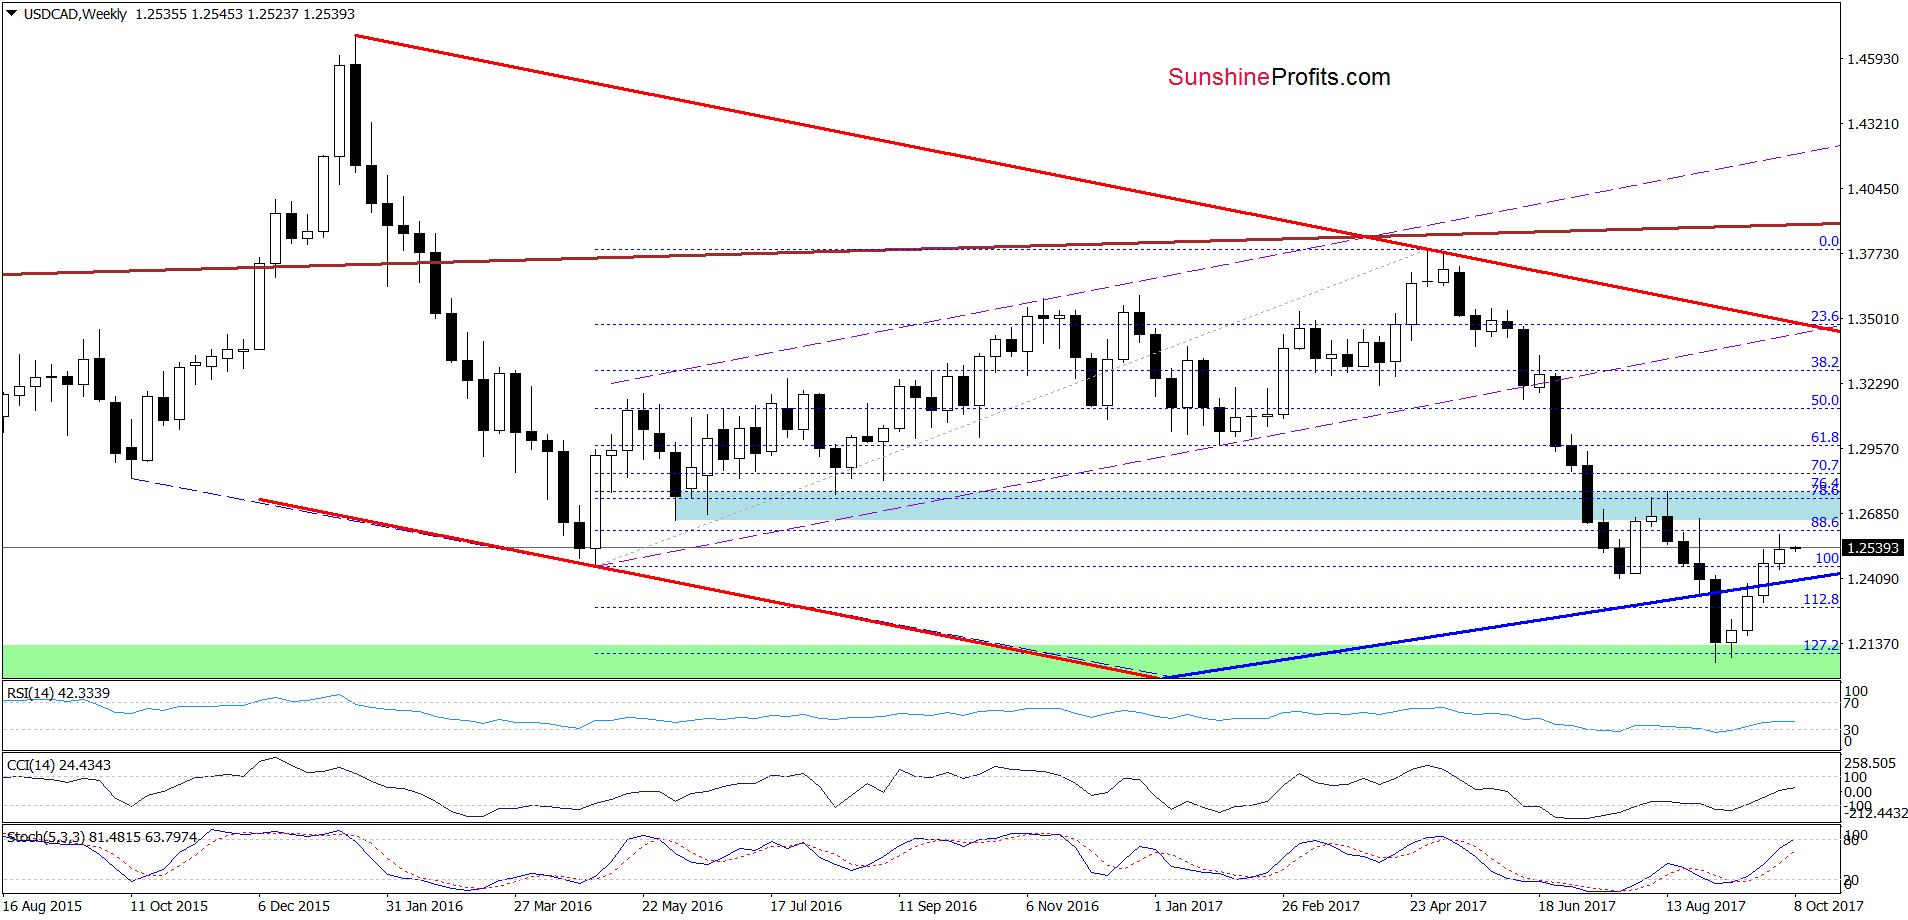
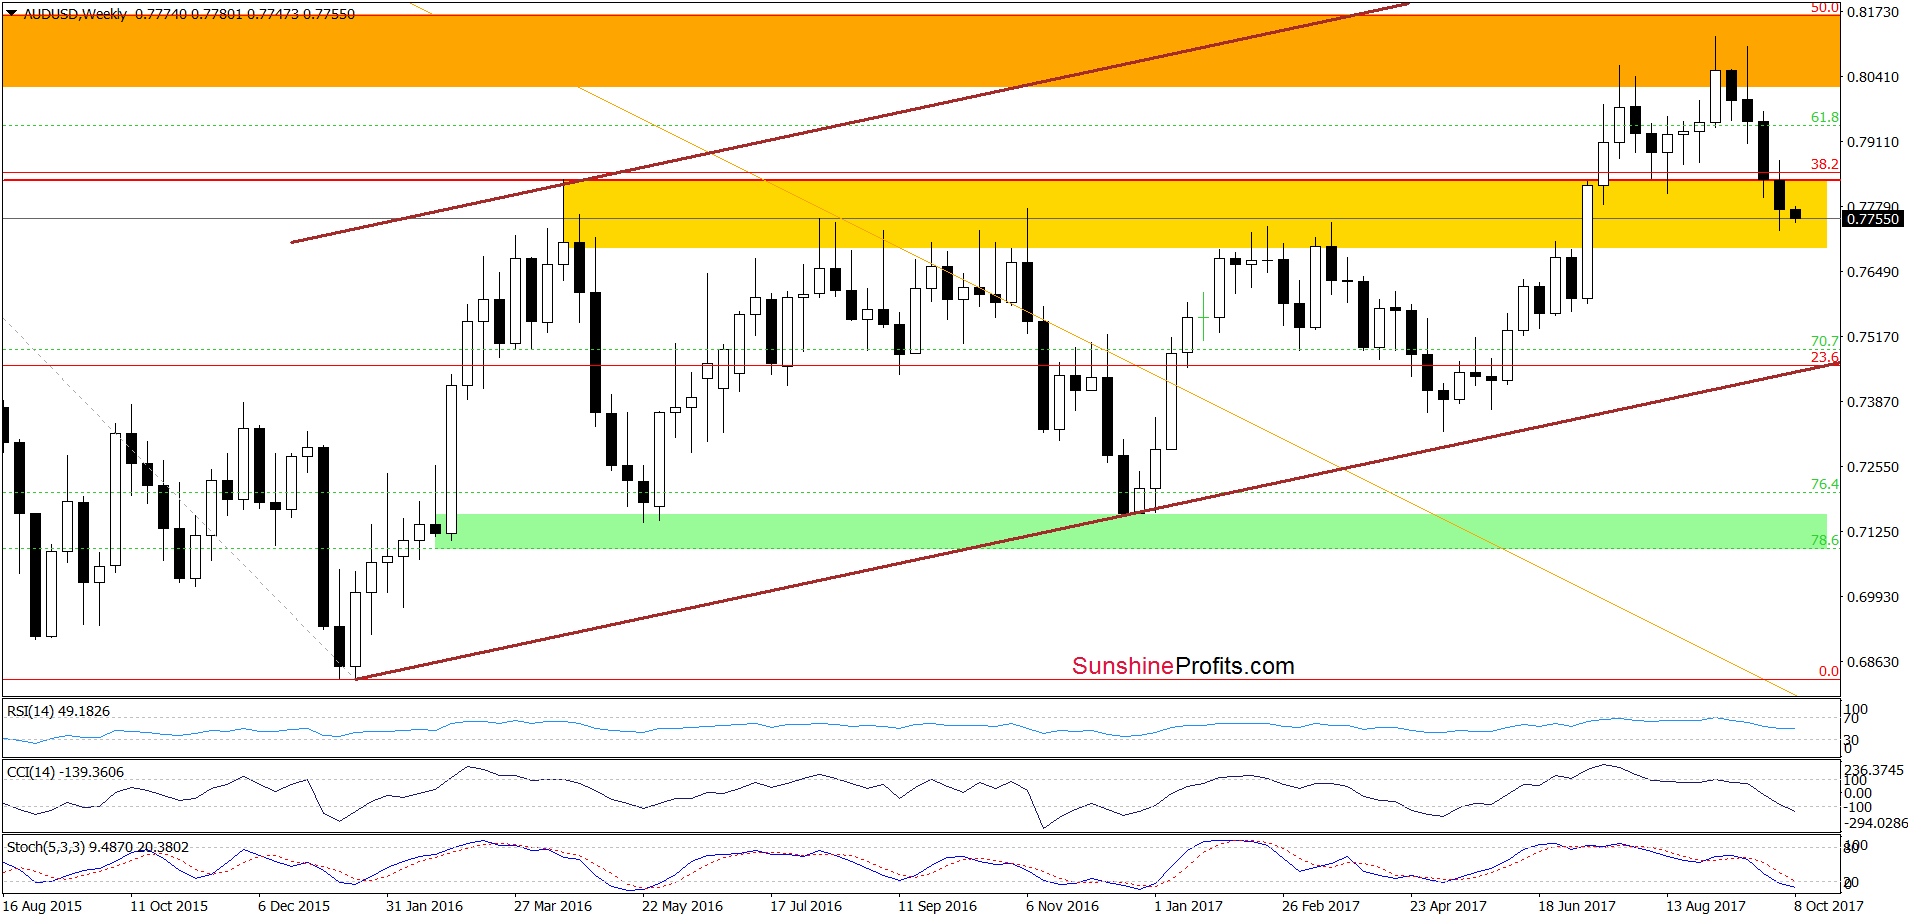
On the weekly chart, we see that although USD/CAD pulled back a bit, the exchange rate is still trading above the previously-broken blue support line and the buy signals generated by the medium-term indicators remain in play, suggesting further improvement in the coming week.
But will we see such price action? Let’s examine the daily char and find out.
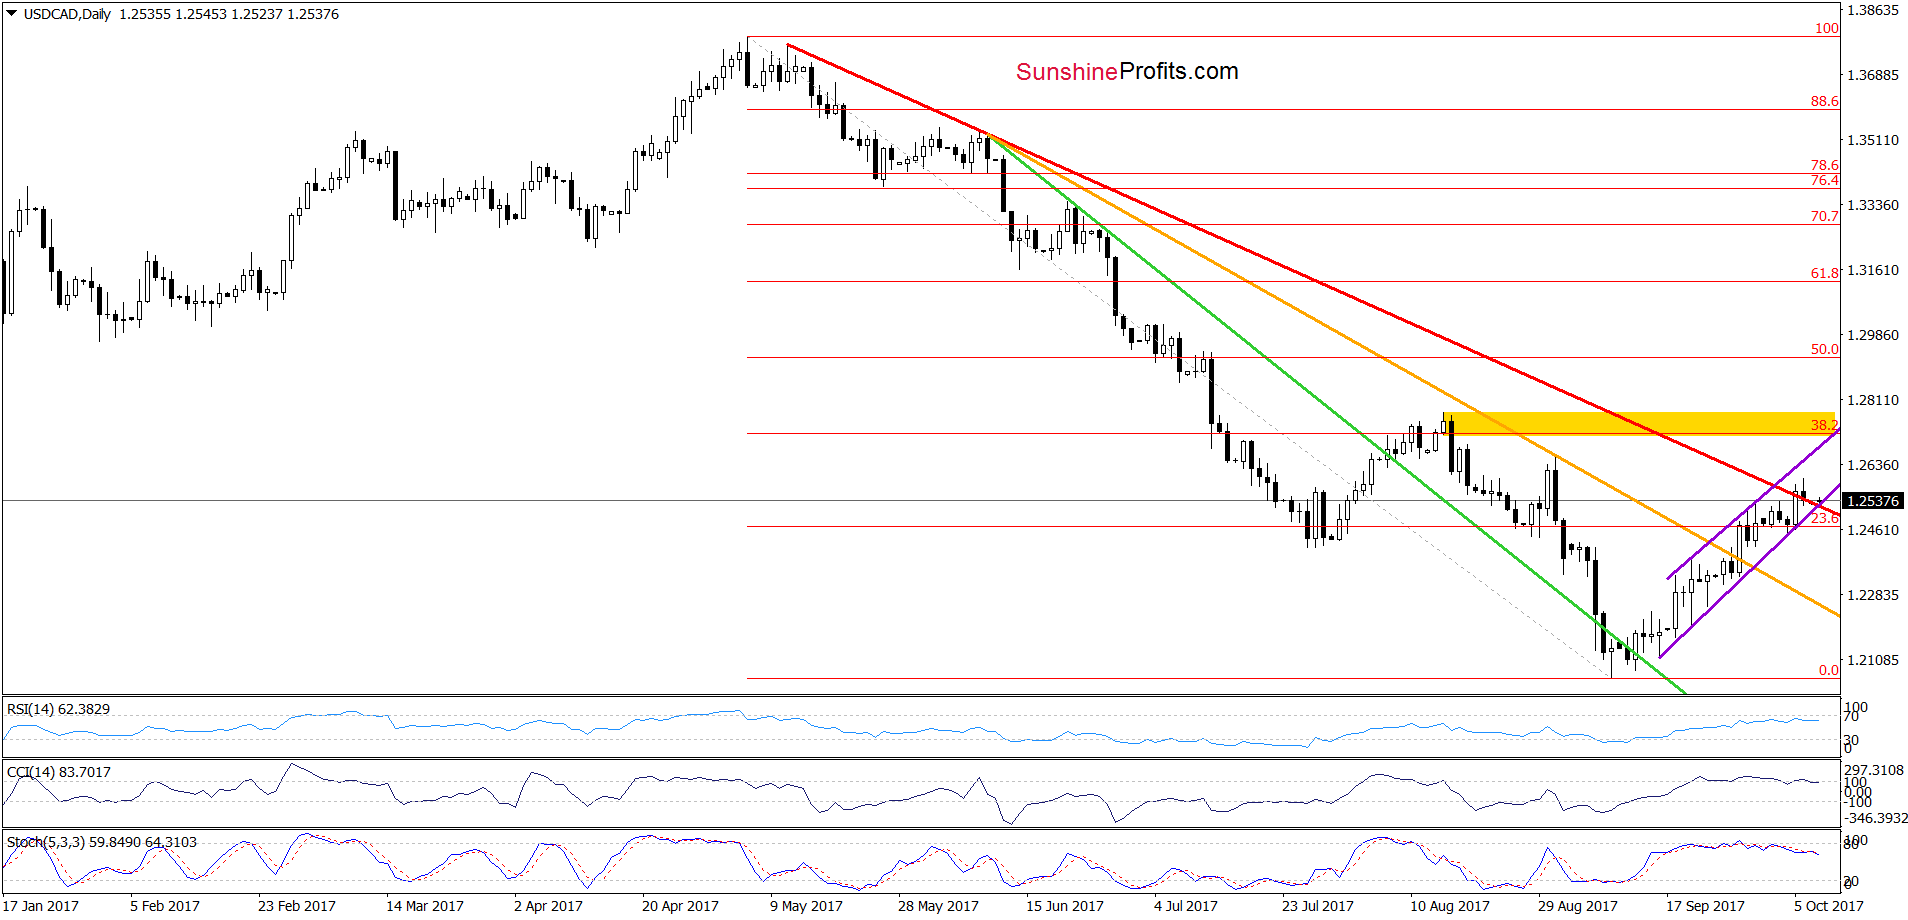
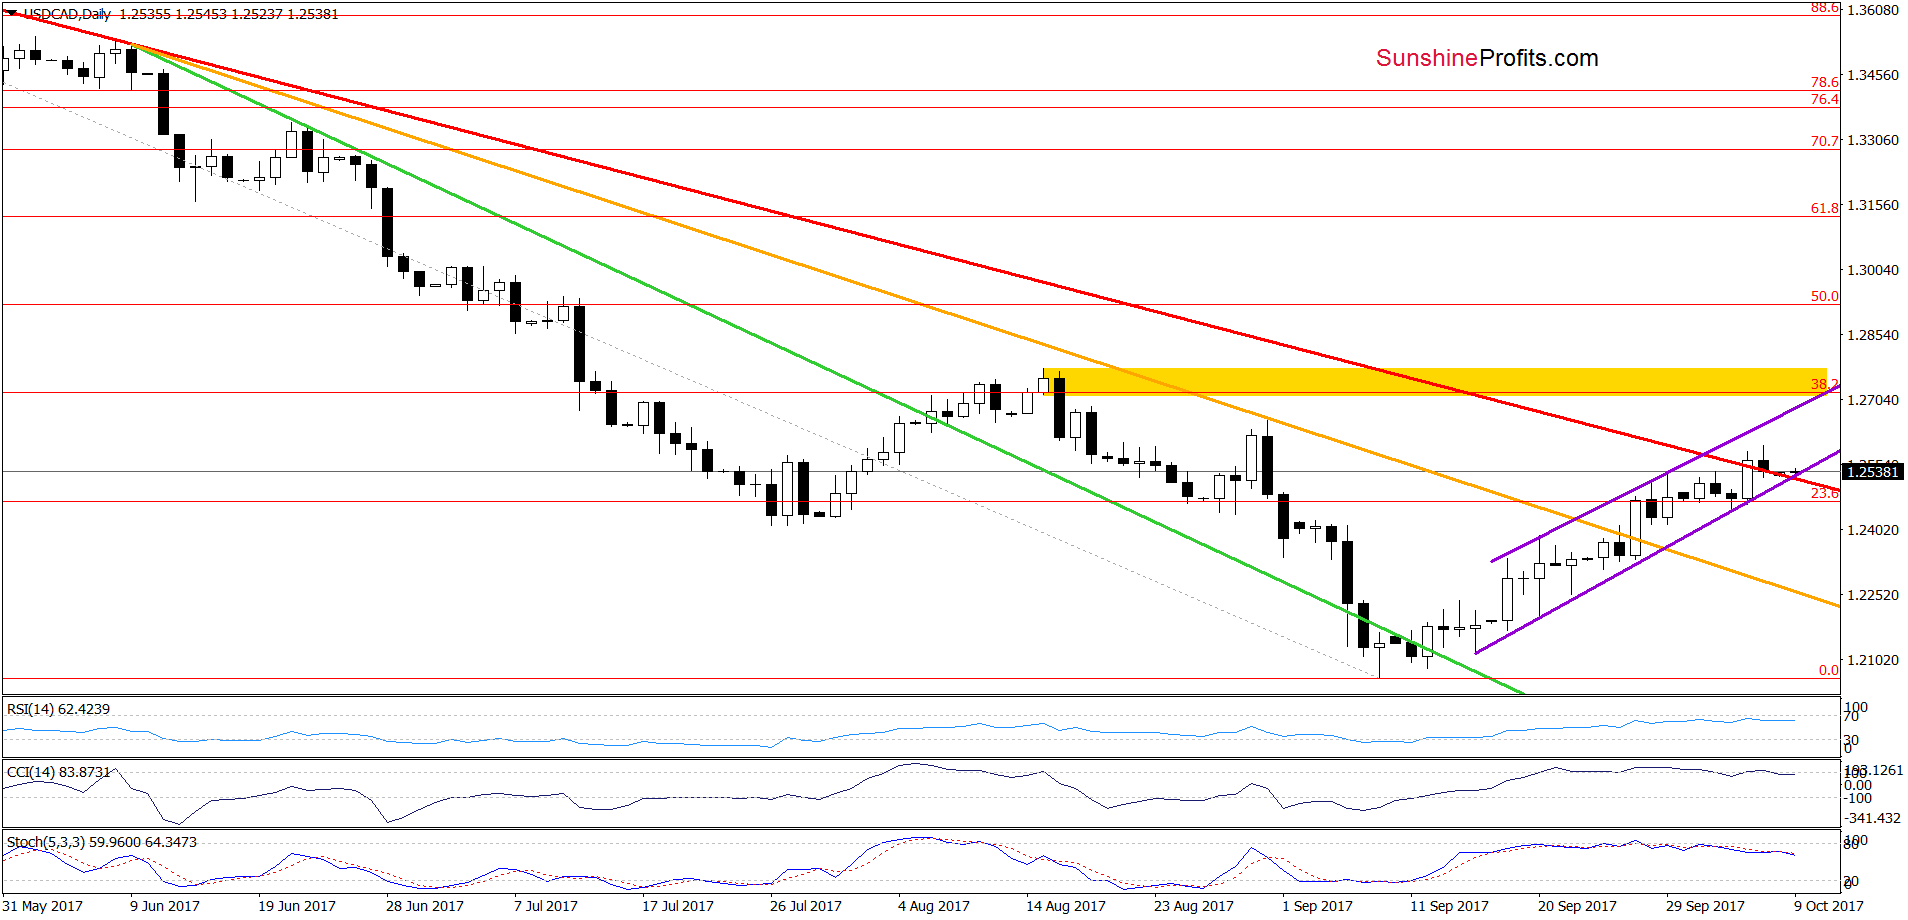
From today’s point of view, we see that although USD/CAD climbed above the red declining resistance line based on the May and June highs, currency bulls had some problems to push the pair higher. As a result, the exchange rate pulled back and slipped to the above-mentioned red line and the lower border of the purple rising trend channel.
What’s next? The current position of the indicators (the sell signals generated by the CCI and the Stochastic Oscillator) suggests that lower values of USD/CAD are just around the corner. Nevertheless, in our opinion, such price action will be more likely and reliable only if the pair closes today’s (or one of the following) session under both above-mentioned support lines. In this case, the exchange rate will likely come back to around 1.2446, where the last week’s low is. However, if these two important support lines withstand the selling pressure, we may see an increase to the upper line of the purple rising trend channel and the yellow resistance zone in the following days.
Very short-term outlook: mixed
Short-term outlook: mixed
MT outlook: mixed
LT outlook: mixed
Trading position (short-term; our opinion): No positions are justified from the risk/reward perspective at the moment. We will keep you informed should anything change, or should we see a confirmation/invalidation of the above.
AUD/USD
Quoting our last commentary on this currency pair:
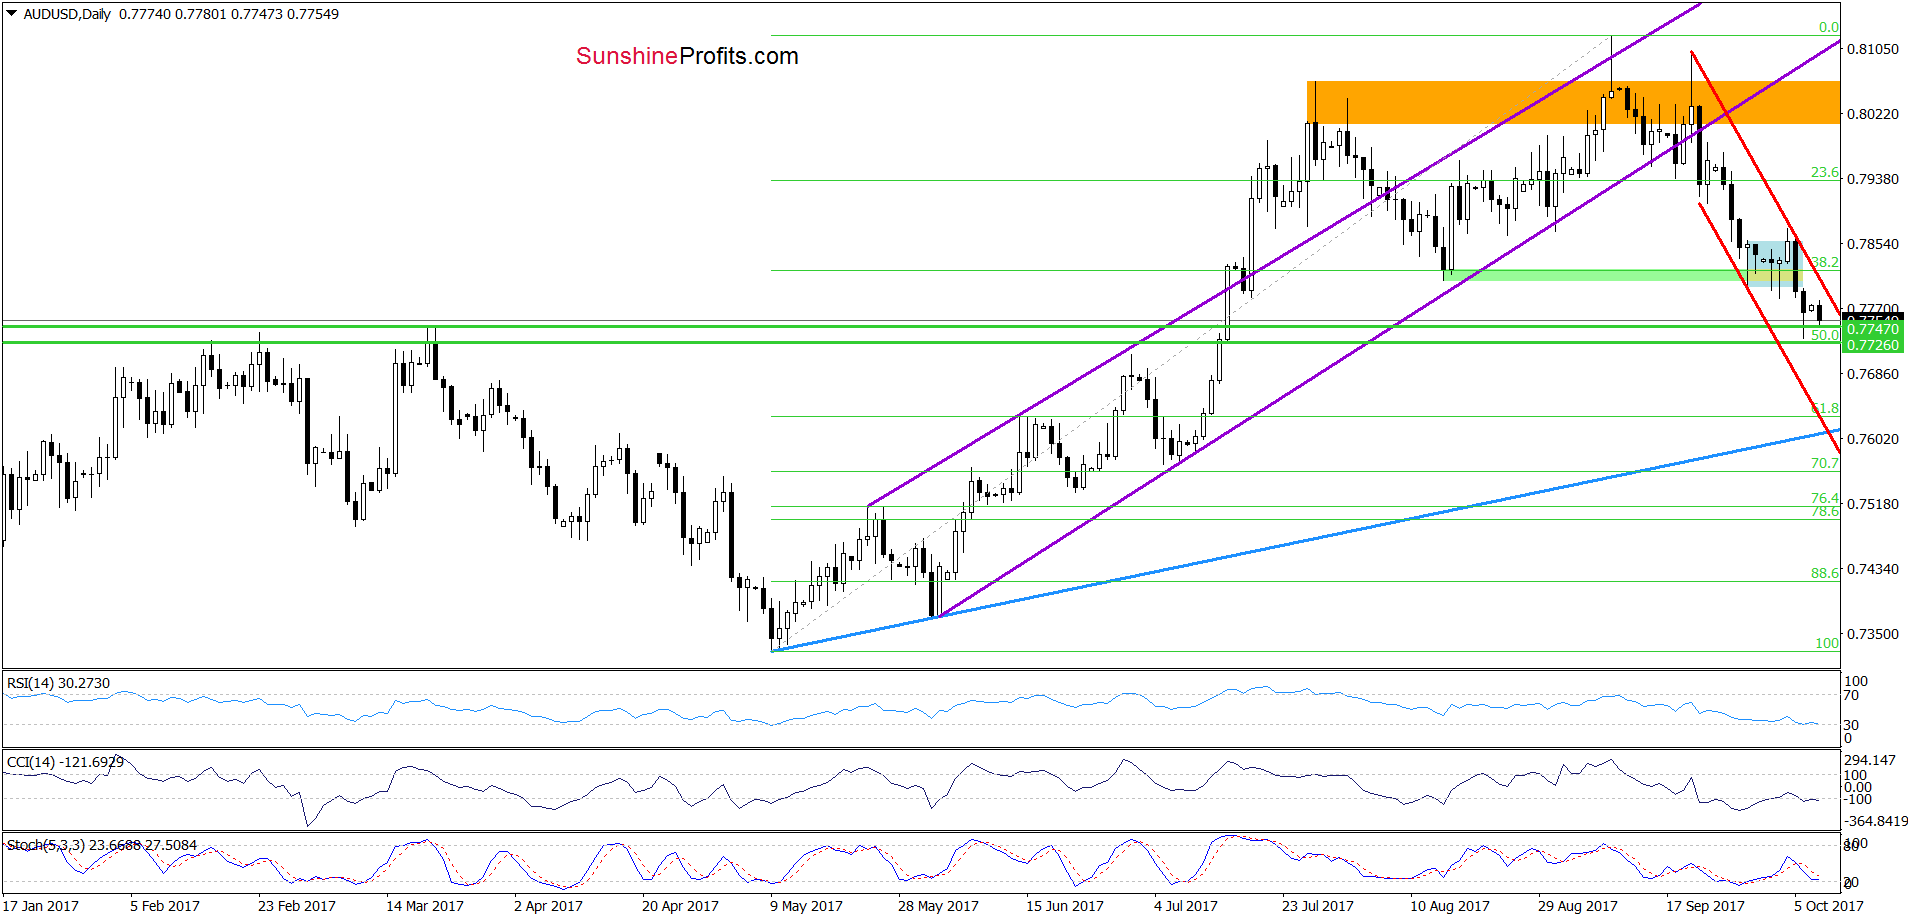
(…) taking into account the size of the recent rebound (it was visibly smaller than the move, which we saw in the second half of September), we think that the pair will decline even lower and test the next support zone created by the green horizontal lines based on the March peaks and the 50% Fibonacci retracement (based on the entire May-September upward move) in the coming week.
On the daily chart, we see that the situation developed in line with the above scenario and AUD/USD slipped to our downside target on Friday. Although the pair rebounded slightly, currency bears pushed the exchange rate lower earlier today, which suggests that we’ll see a test of the last week’s low later in the day. When can we expect a bigger move to the upside? In our opinion, it will be likely only if AUD/USD successfully breaks above the upper border of the red declining trend channel.
Very short-term outlook: mixed with bearish bias
Short-term outlook: mixed
MT outlook: mixed
LT outlook: mixed
Trading position (short-term; our opinion): No positions are justified from the risk/reward perspective. We will keep you informed should anything change, or should we see a confirmation/invalidation of the above.
Thank you.
Nadia Simmons
Forex & Oil Trading Strategist
Przemyslaw Radomski, CFA
Founder, Editor-in-chief, Gold & Silver Fund Manager
Gold & Silver Trading Alerts
Forex Trading Alerts
Oil Investment Updates
Oil Trading Alerts

