

In recent days, currency bulls pushed the greenback higher against its Canadian counterpart, which resulted in a breakout above the September peak. Thanks to this increase, USD/CAD climbed to the resistance area reinforced by the long-term resistance line. Is it enough to stop further improvement in the following days?
- EUR/USD: none
- GBP/USD: none
- USD/JPY: short (a stop-loss order at 114.62; the initial downside target at 111.84)
- USD/CAD: short (a stop-loss order at 1.3401; the initial downside target at 1.2934)
- USD/CHF: short (a stop loss order at 1.0192; the initial downside target at 0.9881)
- AUD/USD: none
EUR/USD
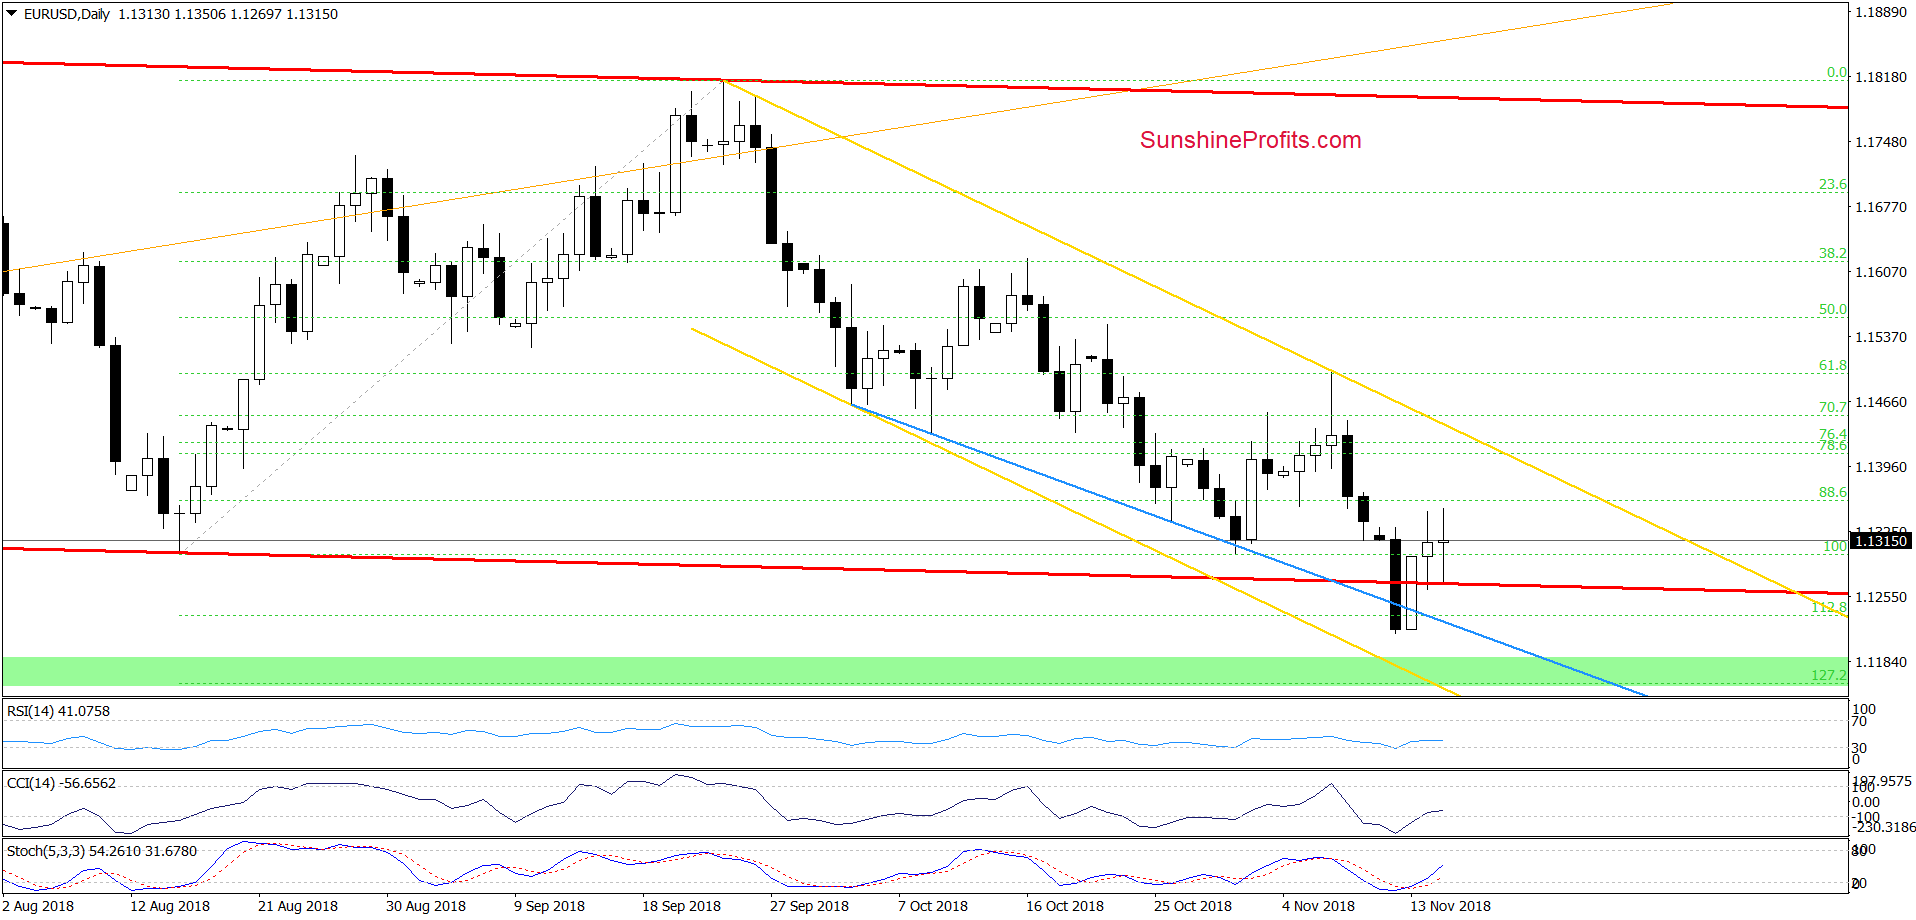
Looking at the daily chart, we see that the overall situation in the very short term hasn’t changed much as EUR/USD is trading at yesterday’s levels. Therefore, our Wednesday’s commentary remains up-to-date also today:
(…) currency bulls triggered a rebound, which took EUR/USD above the lower line of the red trend channel and resulted in an invalidation of the earlier breakdown.
Earlier today, the pair verified yesterday’s move, which in combination with the current position of the daily indicators suggests that another upswing may be just around the corner.
Taking all the above into account, we think that if the situation develops in line with this scenario, currency bulls will likely test the short-term yellow resistance line in the very near future.
Trading position (short-term; our opinion): No positions are justified from the risk/reward perspective after the stop-loss order closed our short positions.
USD/CAD
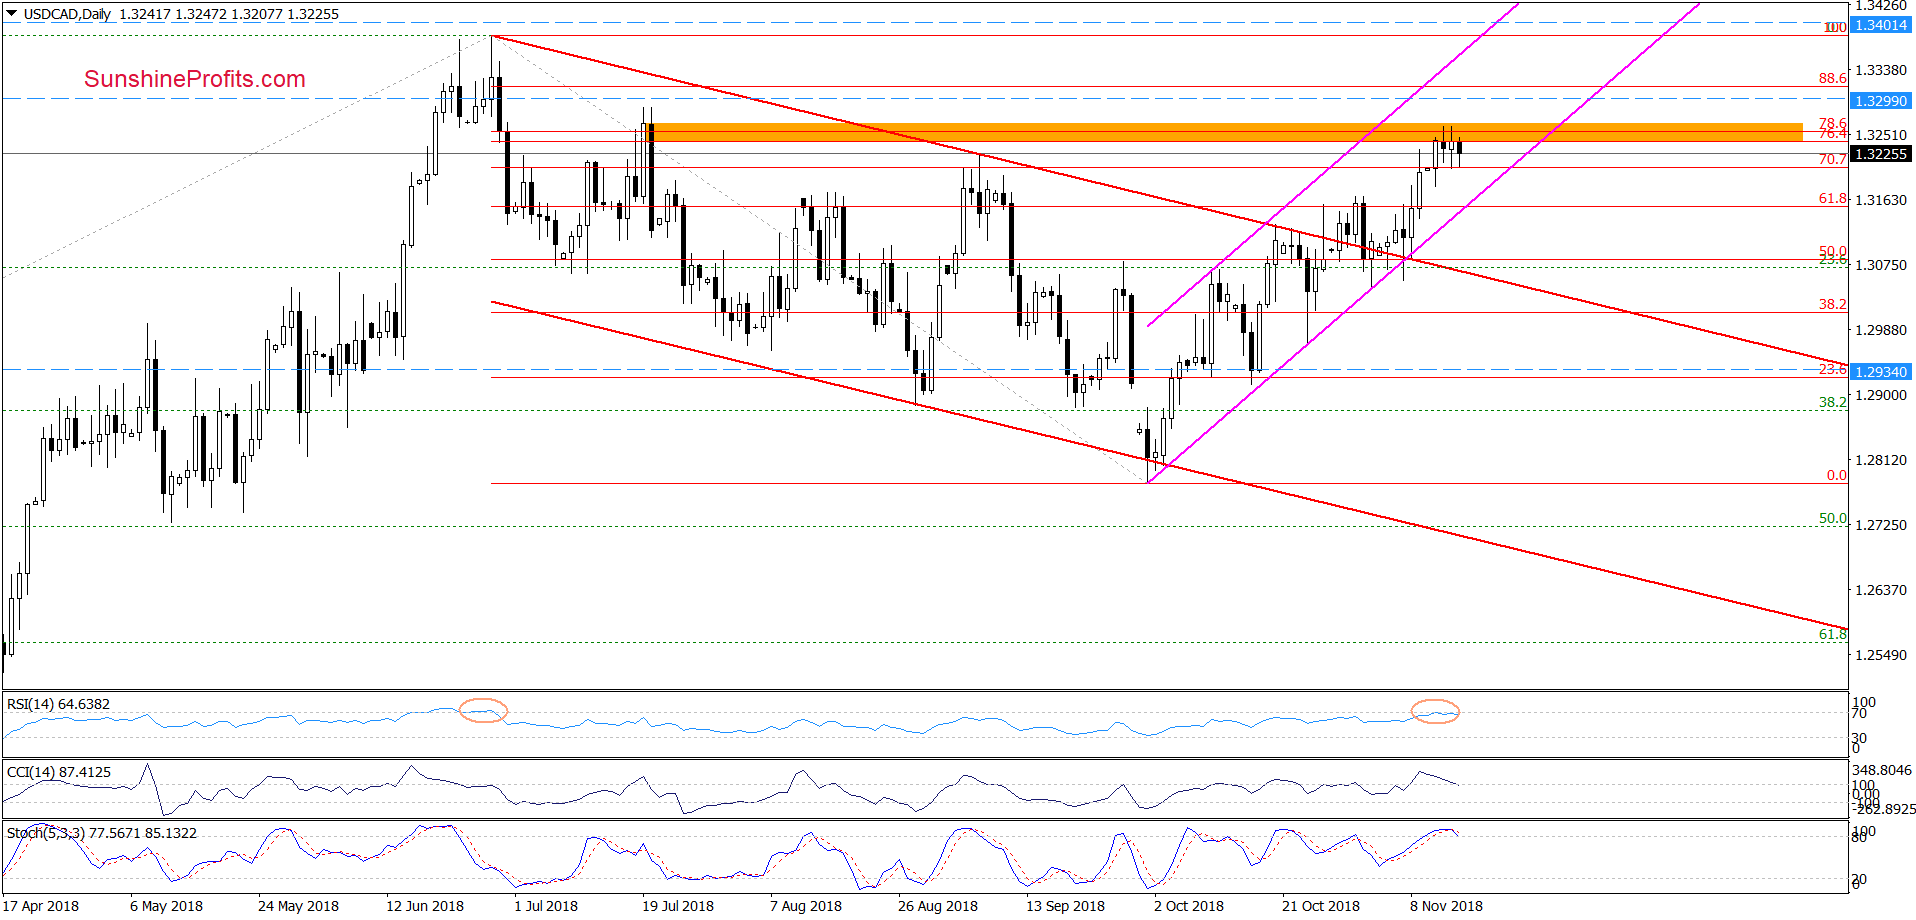
From today’s point of view, we see that USD/CAD is trading in a very near range slightly below the orange resistance zone created by the 76.4%, 78.6% Fibonacci retracements and July peaks (in terms of daily openings and closures), which suggests that the buyers could lost some strength after the recent increases.
Additionally, the RSI climbed to its highest level since late-June. Back then, such high reading of the indicator preceded a sizable move do the downside in the following weeks, which suggests that we could see a similar price action in the near future – especially when we factor in the current position of other daily indicators (the CCI and the Stochastic Oscillator generated the sell signals earlier today).
Taking all the above into account, we think that if the pair moves to the south from current levels, we’ll see not only a decline to the lower border of the pink rising trend channel, but also a test of the upper line of the red trend channel in the coming week(s).
Finishing today’s commentary on this currency pair, it is also worth noting that the recent upward move took the pair to one more resistance, which is seen more clearly on the chart below.
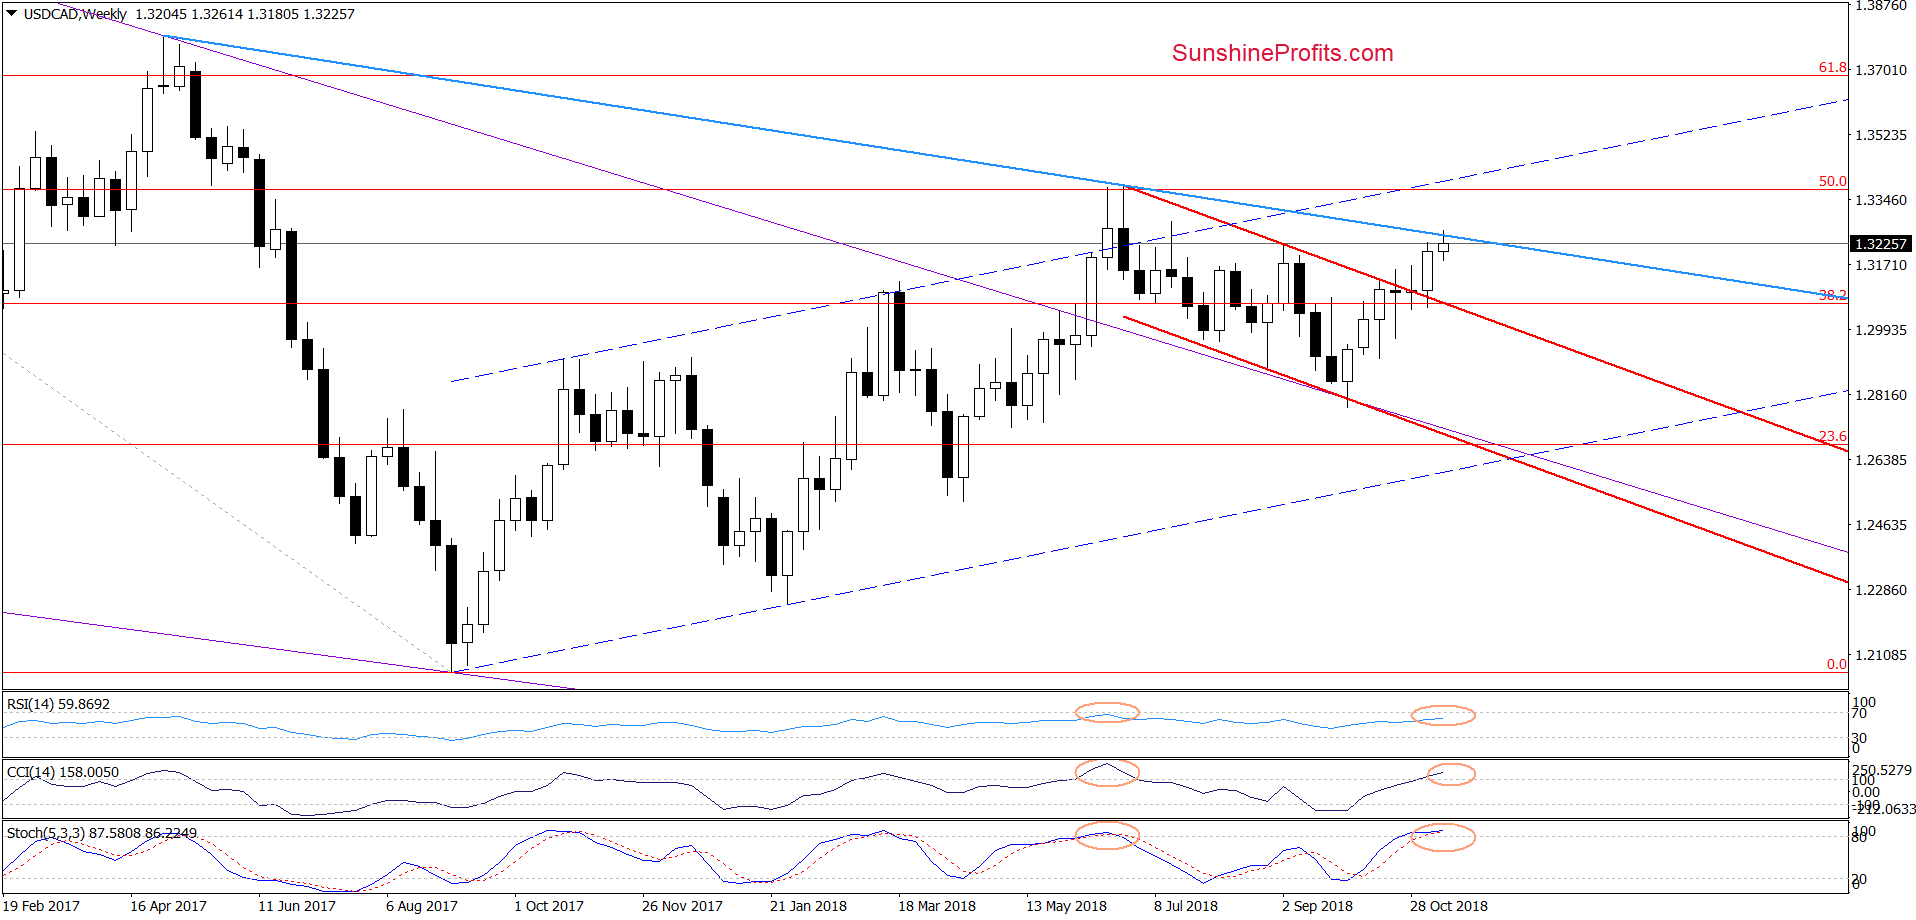
From this perspective, we see that USD/CAD also climbed to the blue declining resistance line based on the previous (the April 2017 and June 2018) peaks, increasing the probability of reversal later this week.
On top of that, all medium-term indicators increased to the highest levels since June, adding currency bears even more reasons to act.
Trading position (short-term; our opinion): short positions with a stop-loss order at 1.3401 and the initial downside target at 1.2934 are justified from the risk/reward perspective.
USD/CHF
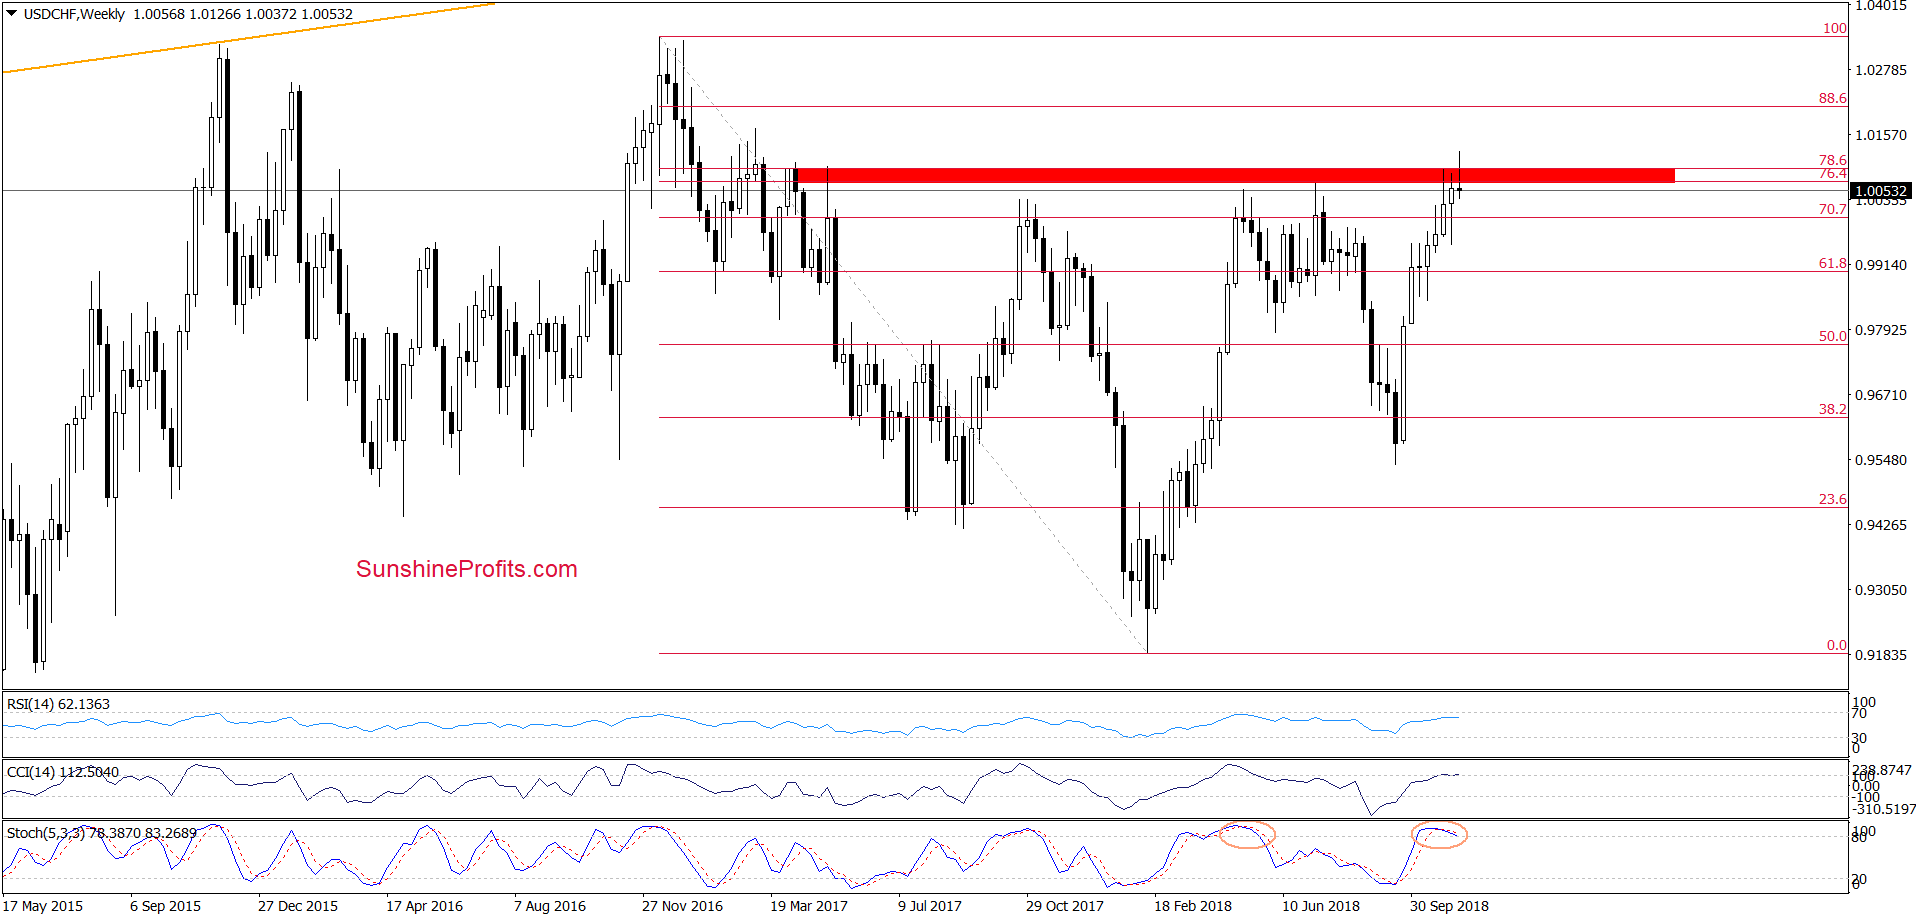
The first thing that catches the eye on the weekly chart is an invalidation of the earlier breakout above the red resistance zone (created by the 76.4% and the 78.6% Fibonacci retracements), which doesn’t bode well for further rally.
Additionally, there are very high readings of the medium-term indicators and the sell signal generated by the Stochastic Oscillator, which increase the probability of another reversal from here in the coming week(s). This scenario is also reinforced by the fact that this area was strong enough to stop the buyers several times in the past, triggering bigger moves to the downside.
Having said the above, let’s check what can we infer from the very short-term chart.
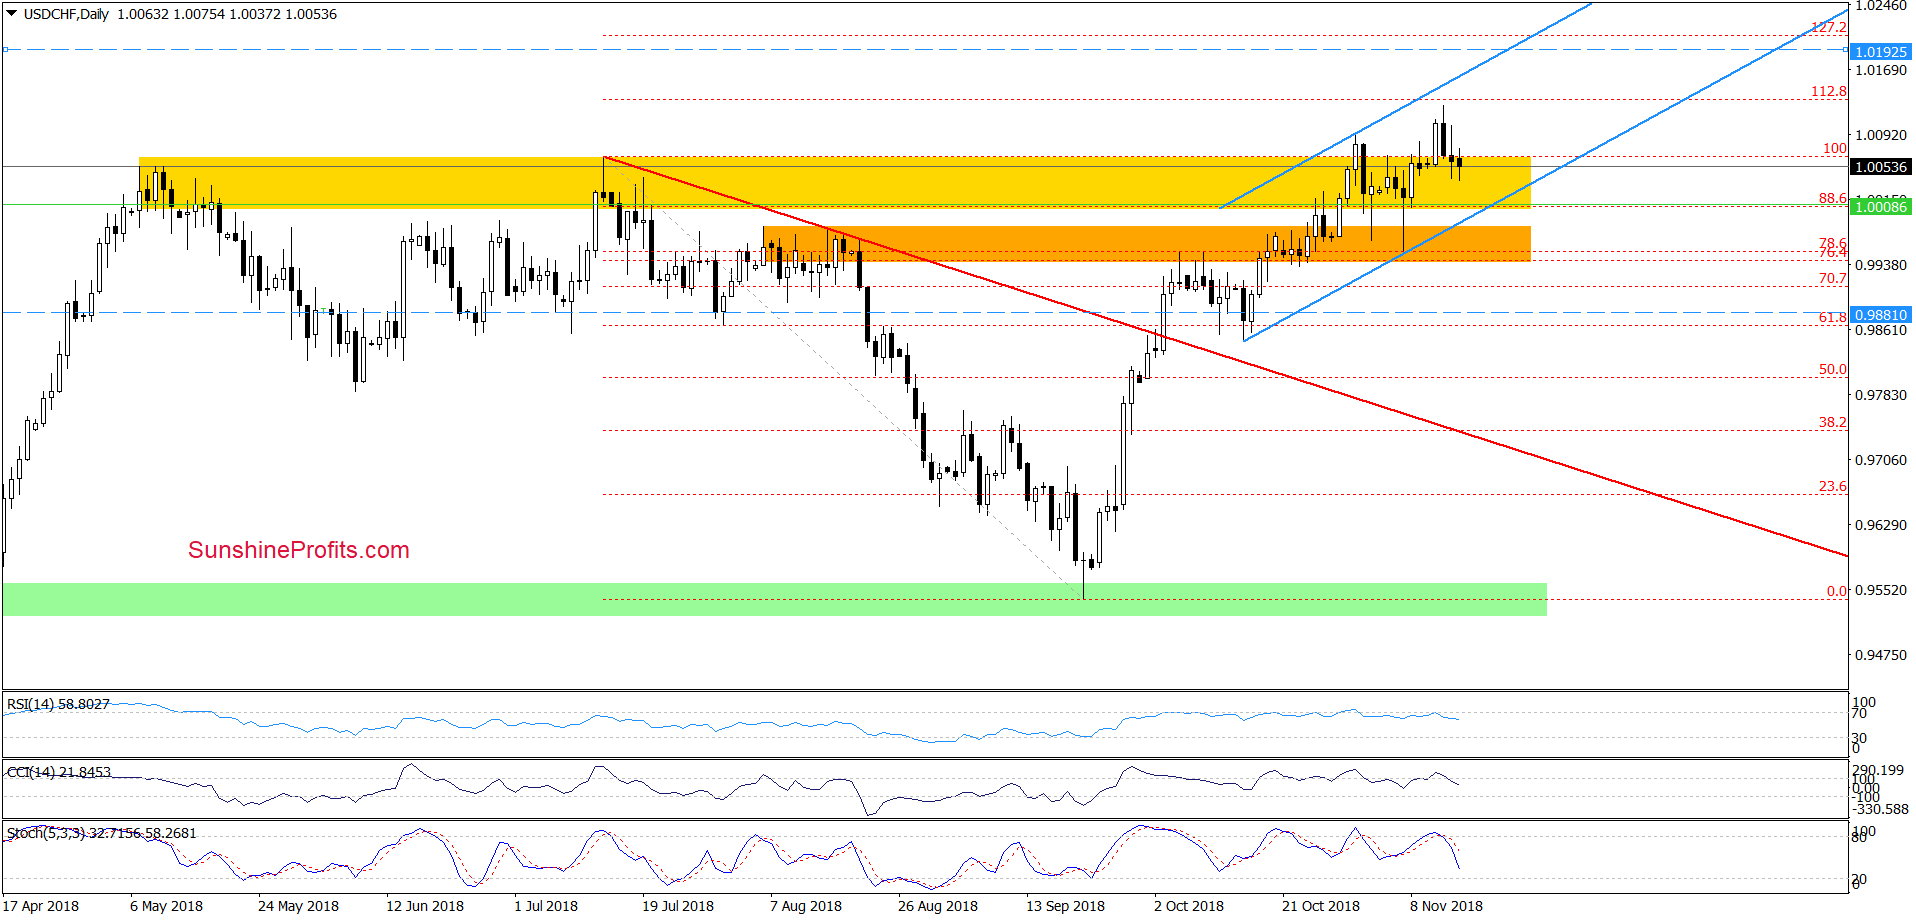
Looking at the daily chart, we see that although USD/CHF broke above the October peak, the proximity to the 112.8% Fibonacci extension (and the medium-term resistance zone) encouraged currency bears to act.
Thanks to their attack, the exchange rate pulled back, invalidating the earlier breakout above the yellow resistance zone in recent days. Additionally, all daily indicators generated the ell signals, suggesting that further deterioration is just around the corner.
Therefore, if the situation develops in line with the above assumption and USD/CHF declines from current levels, we’ll see at least a test of the lower border of the blue rising trend channel in the very near future.
Trading position (short-term; our opinion): short positions with a stop loss order at 1.0192 and the initial downside target at 0.9881 are justified from the risk/reward perspective.
Thank you.
Nadia Simmons
Forex & Oil Trading Strategist
Przemyslaw Radomski, CFA
Founder, Editor-in-chief, Gold & Silver Fund Manager
Gold & Silver Trading Alerts
Forex Trading Alerts
Oil Investment Updates
Oil Trading Alerts

