

Yesterday, USD/CAD boke below early December lows and closed the day under the 38.2% Fibonacci retracement. Will these negative events encourage currency bears to test the long-term support line?
In our opinion the following forex trading positions are justified - summary:
- EUR/USD: short (a stop-loss order at 1.2250; the initial downside target at 1.1510)
- GBP/USD: short (a stop-loss order at 1.3773; the next downside target at 1.3000)
- USD/JPY: none
- USD/CAD: none
- USD/CHF: none
- AUD/USD: none
EUR/USD
Yesterday, we wrote the following:
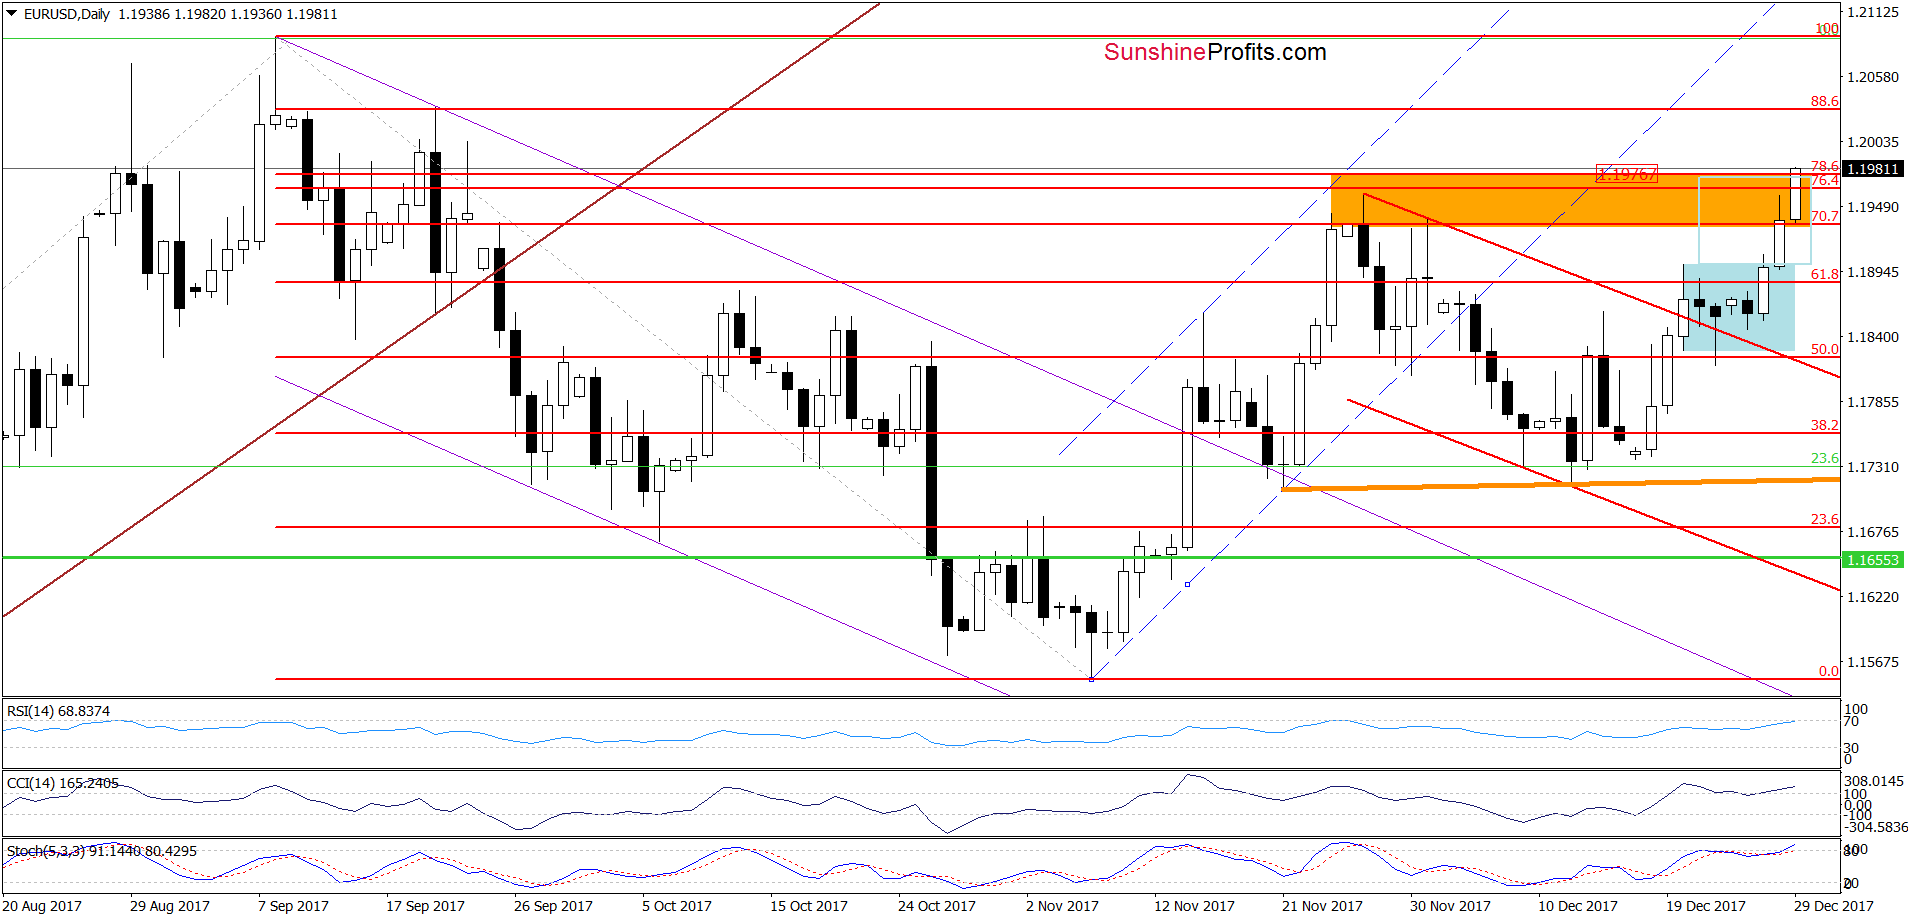
(…) breakout above the upper border of the blue consolidation. Taking this fact into account, we can see a test of the late-November high or even an increase to the 78.6% Fibonacci retracement, where the size of the move will correspond to the height of the consolidation.
From today’s point of view, we see that the situation developed in line with the above scenario and currency bulls pushed the exchange rate to the upside targets. Earlier today, we noticed a breakout above the orange resistance zone, however, it’s not confirmed and the resistance area created by September highs is quite close, which suggests that the space for gains may be limited – especially when factor in the current position of the daily indicators and the key resistance zone marked on the long-term chart below.
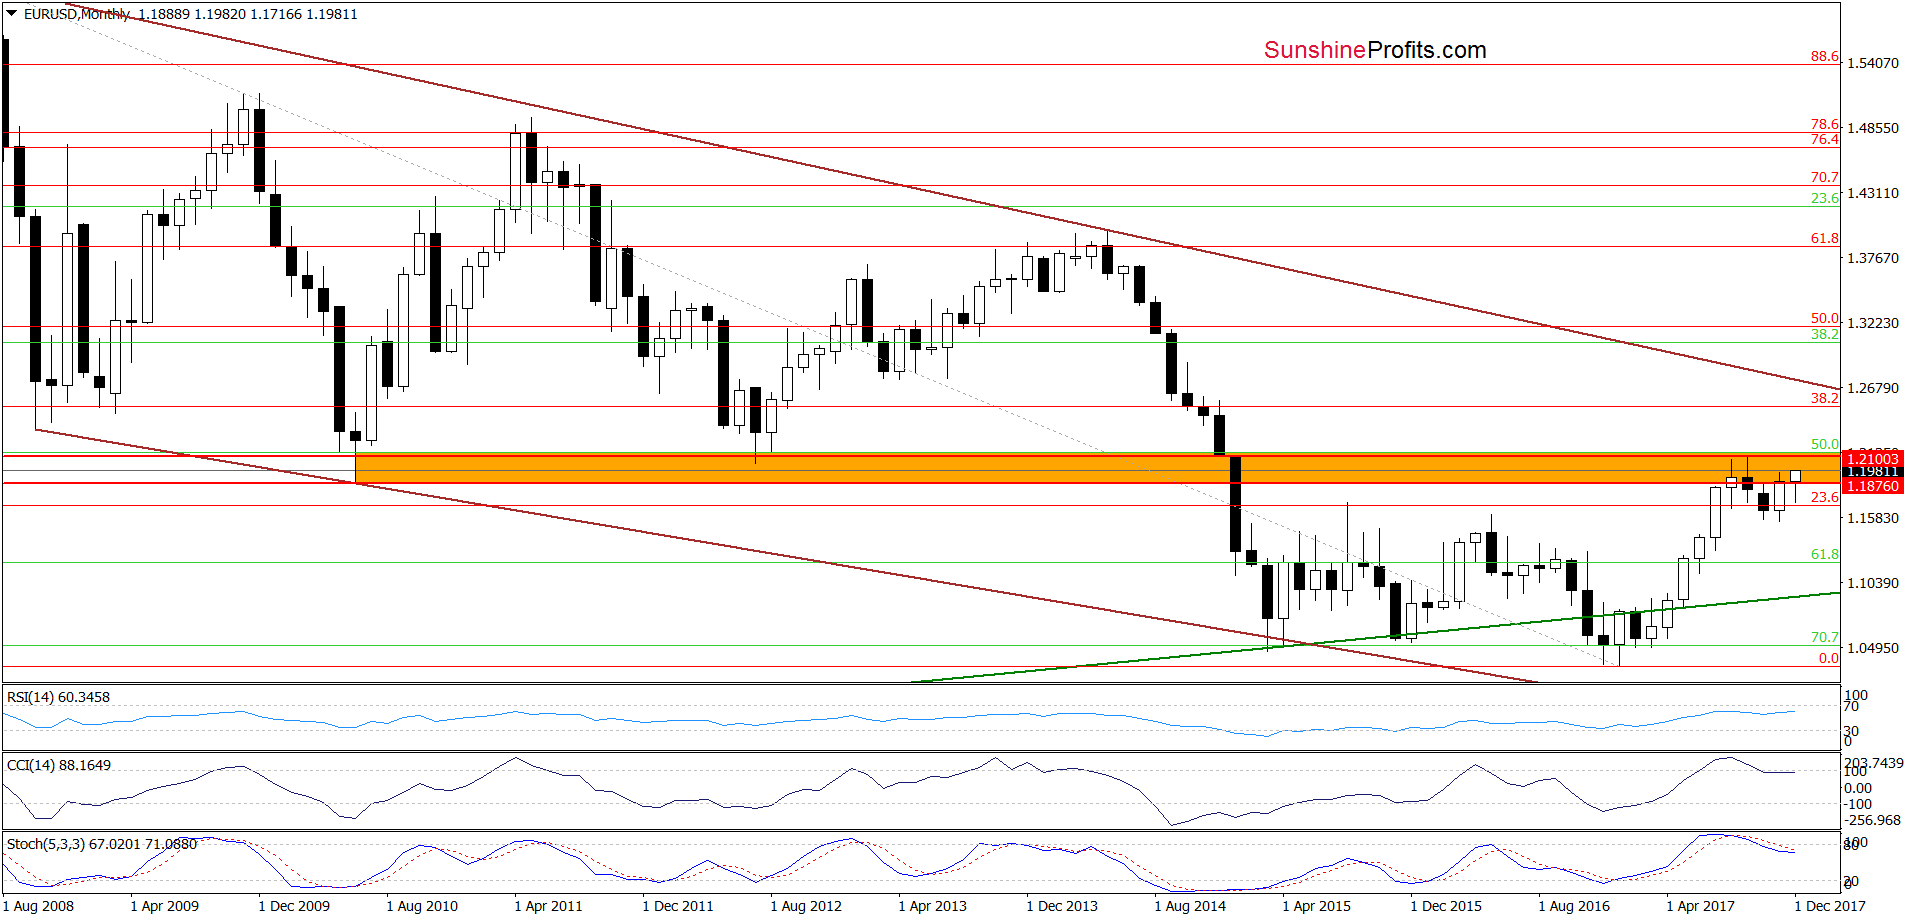
Connecting the dots, we think that even if EUR/USD moves a bit higher from here (to the 88.6% Fibonacci retracement), we think that reversal is just around the corner.
Trading position (short-term; our opinion): short positions (with a stop-loss order at 1.2250 and the initial downside target at 1.1510) continue to be justified from the risk/reward perspective. We will keep you informed should anything change, or should we see a confirmation/invalidation of the above.
USD/JPY
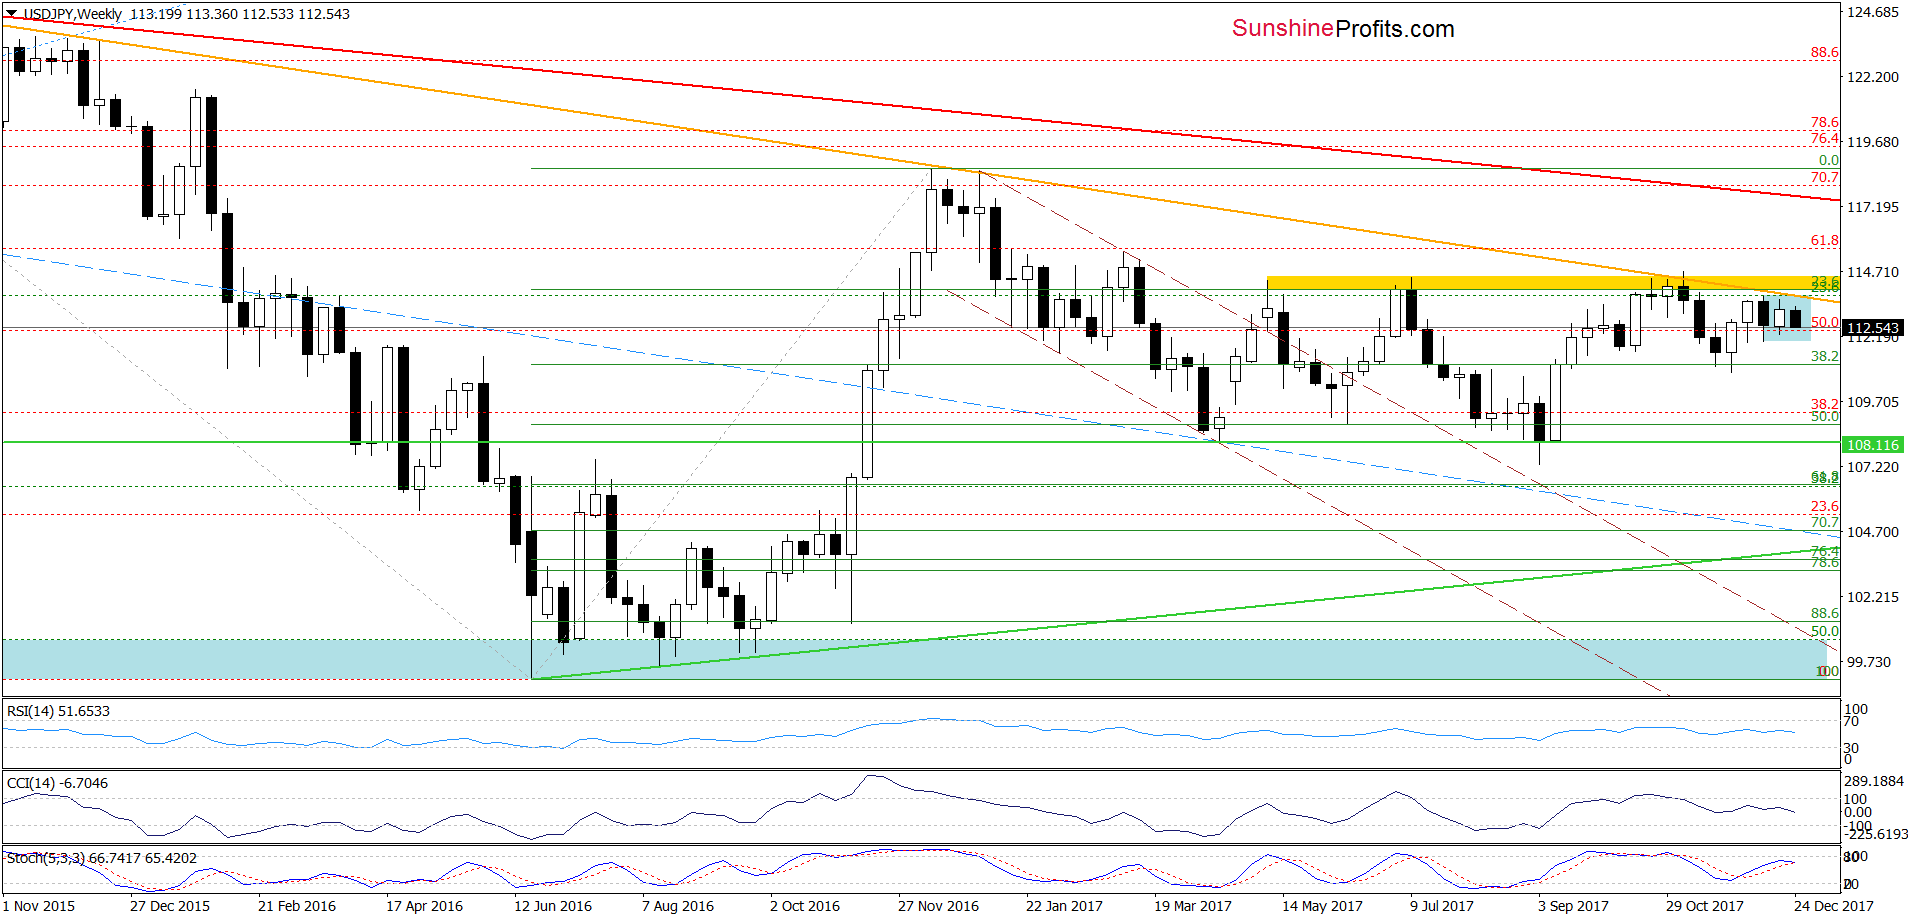
From the medium-term perspective, we see that although USD/JPY moves lower (since our last commentary on this currency pair was posted), the pair continues its trading in the blue consolidation under the yellow resistance zone and the orange declining resistance line.
How did this drop affect the very short-term chart? Let’s examine the daily chart and find out.
On Wednesday, we wrote the following:
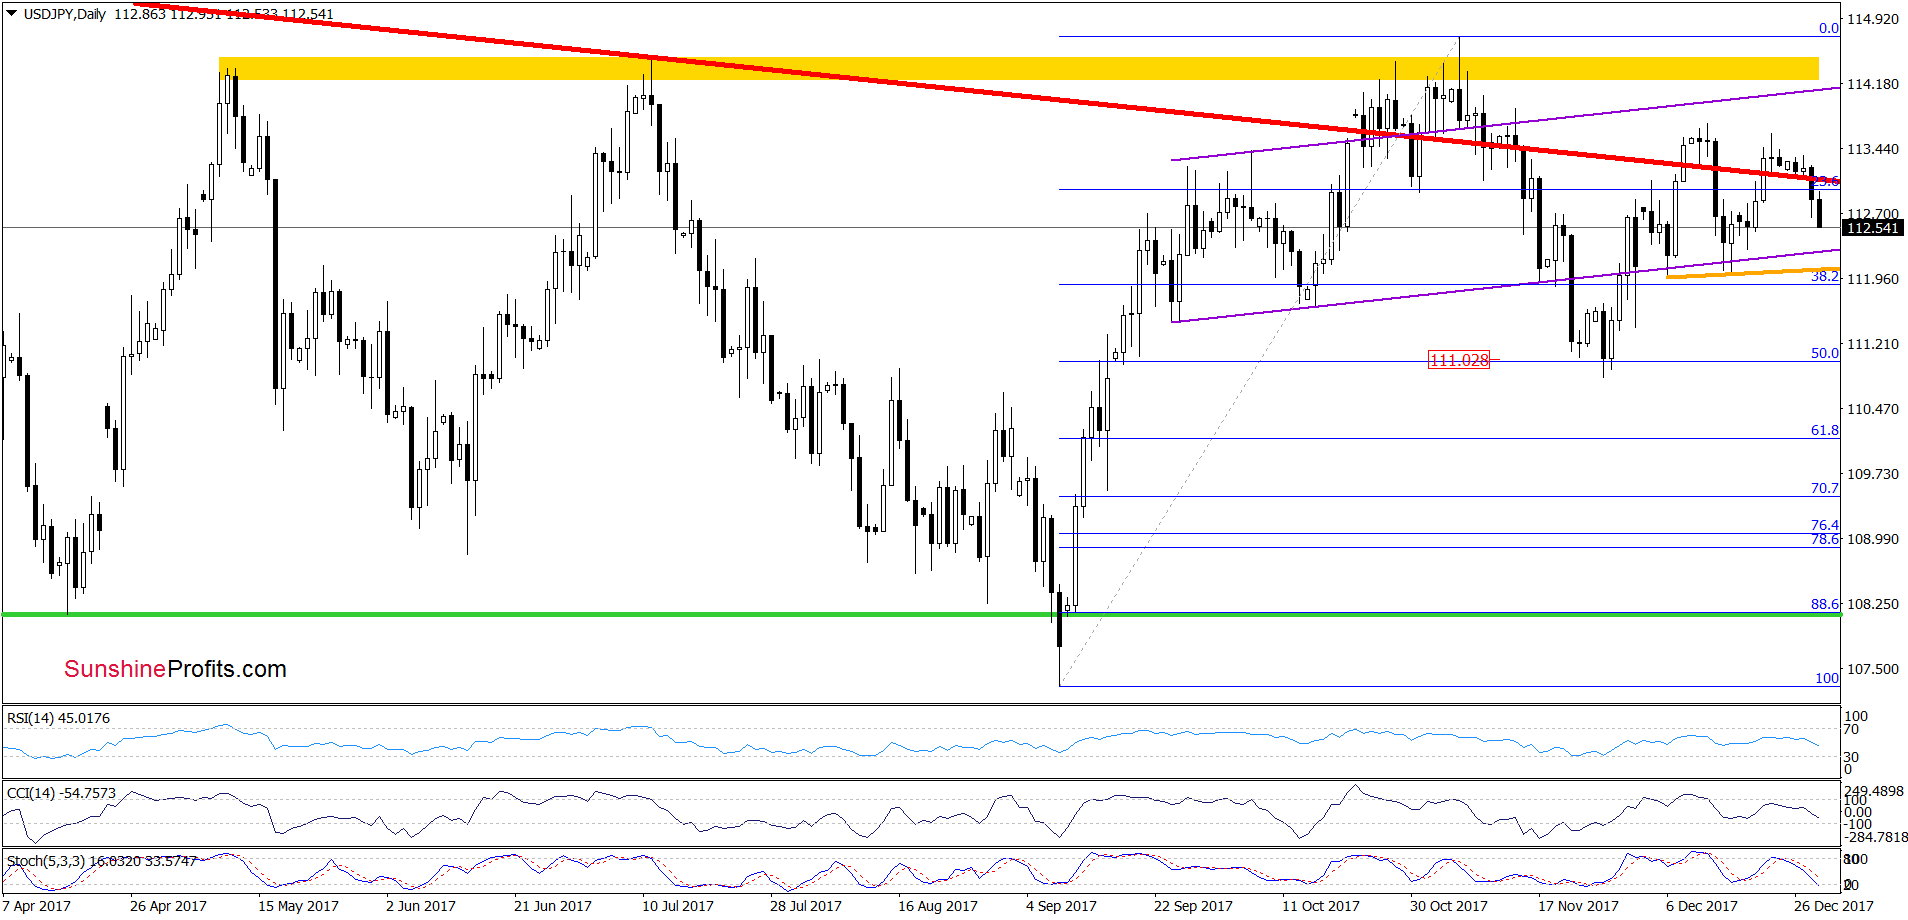
(…) although USD/JPY came back above the long-term red declining resistance line and invalidated the earlier breakdown, currency bulls didn’t push the pair significantly higher, showing their weakness. We saw similar price action at the end of October, at the beginning of November and at the beginning of this month, which doesn’t bode well for further improvement.
Why? (…) in all previous cases, USD/JPY sooner or later turned south, which resulted in the invalidation of the previous breakouts. Taking this fact into account and combining it with the sell signal generated by the Stochastic Oscillator, we think that we’ll see one more move to the downside in the coming days.
Looking at the daily chart, we see that the situation developed in tune with our assumptions and USD/JPY declined in recent days. How low could the exchange rate go in the coming days? We think that the best answer to this question will be the quote from our Wednesday’s alert:
(…) if the exchange rate closes today’s session (or one of the following) under the red line, we’ll likely see a test of the orange support line based on the previous lows in the following days. However, if this area is broken, the next downside target for currency bears will be around 110.82-111, where the 50% Fibonacci retracement and the November lows are.
Trading position (short-term; our opinion): No positions are justified from the risk/reward perspective now. We will keep you informed should anything change, or should we see a confirmation/invalidation of the above.
USD/CAD
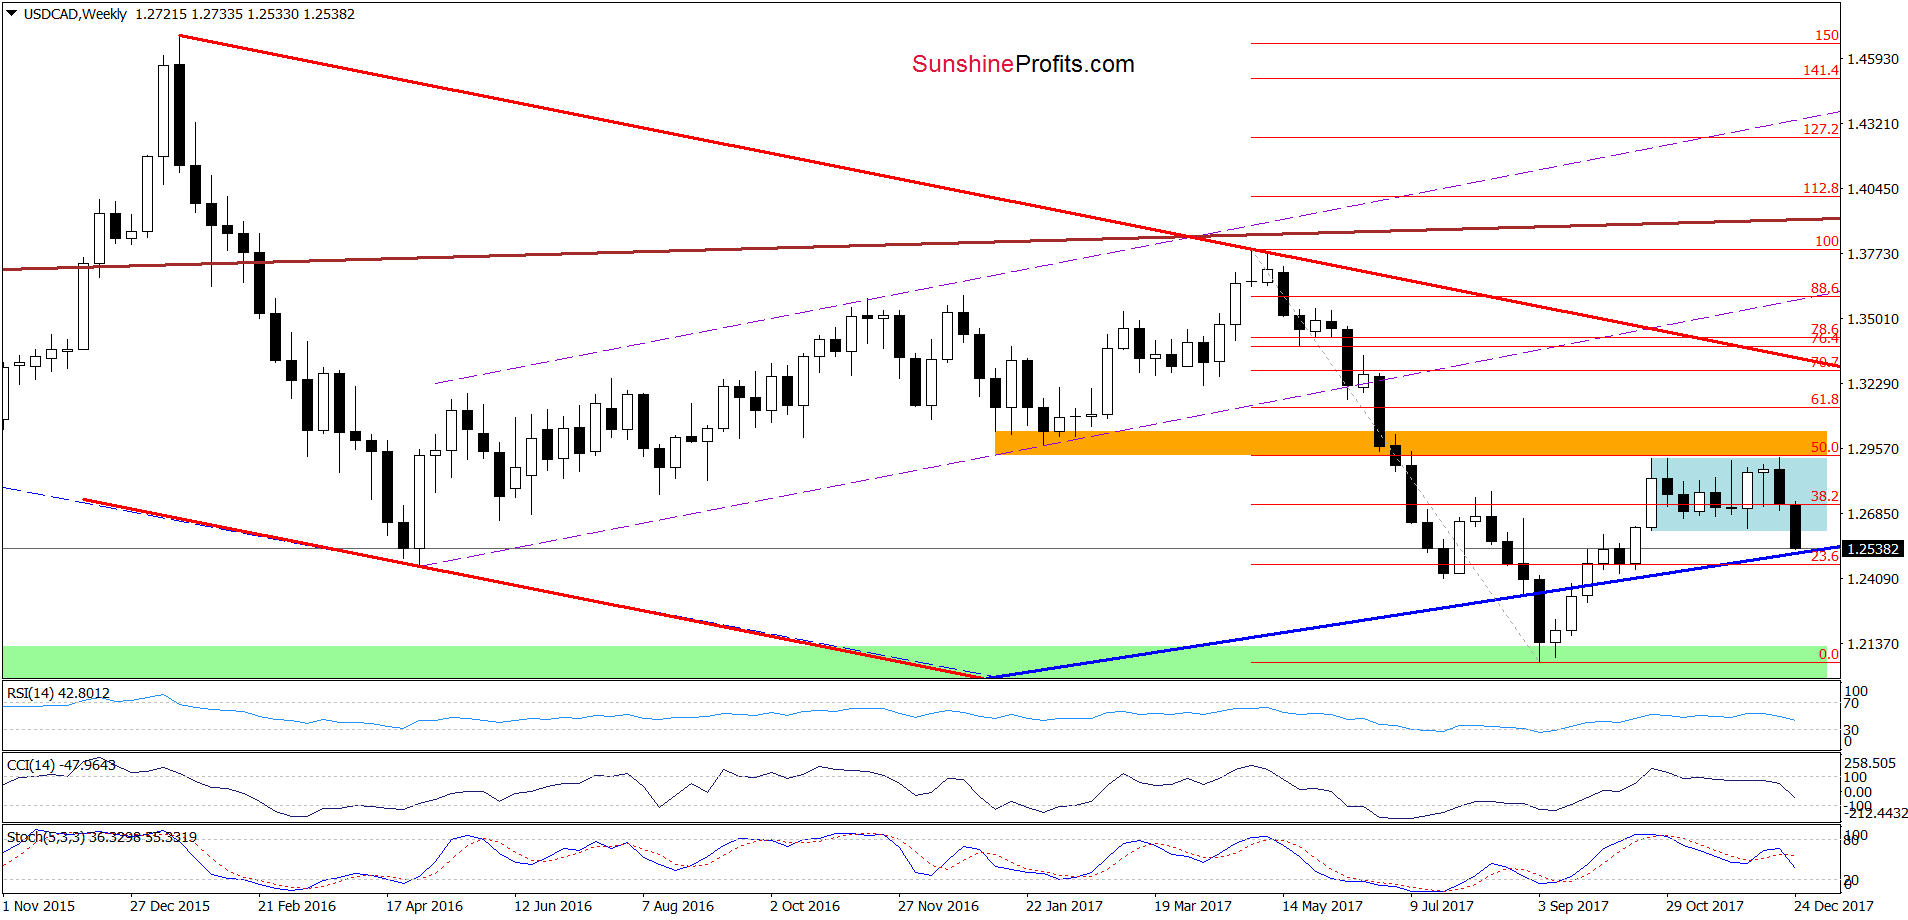
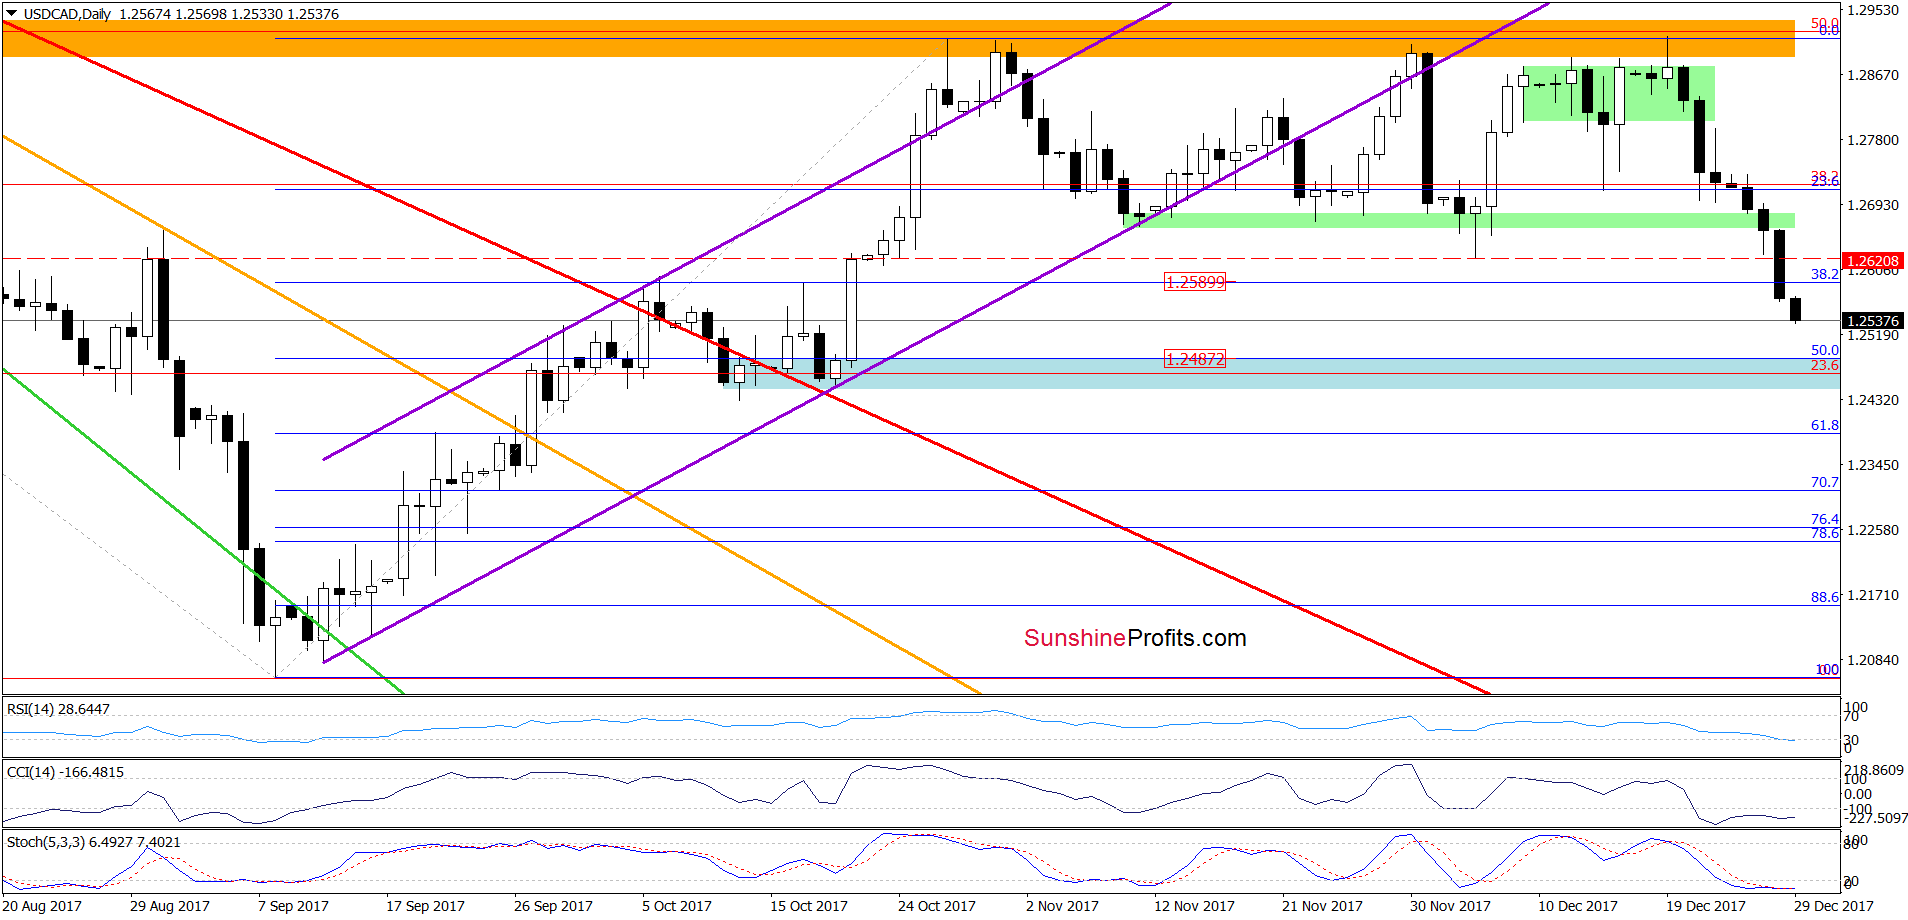
Quoting our Wednesday’s alert:
(…) what could happen if the pair breaks under this month’s low? In our opinion, such price action will result in a decline to the 38.2% Fibonacci retracement (around 1.2590) or even to 1.2525, where the long-term blue support line (seen more clearly on the charts below) currently is.
As you see on the above charts, currency bears pushed USD/CAD lower (as we had expected), which resulted in a drop below the 38.2% Fibonacci retracement. Yesterday, the exchange rate closed the day under this support, which triggered further deterioration earlier today.
This suggests that we’ll see a realization of the Wednesday’s pro-bearish scenario in the very near future. What’s interesting, slightly below the above-mentioned long-term blue support line is also the blue support zone (marked on the daily chart) created by the 50% Fibonacci retracement and October lows, which could stop currency bears in the coming days – especially when we factor in the fact that the daily indicators dropped to their lowest levels since the beginning of the month (as a reminder, back then, such low readings of the indicators preceded an upward move).
Trading position (short-term; our opinion): no positions are justified from the risk/reward perspective now. We will keep you informed should anything change, or should we see a confirmation/invalidation of the above.
Thank you.
Nadia Simmons
Forex & Oil Trading Strategist
Przemyslaw Radomski, CFA
Founder, Editor-in-chief, Gold & Silver Fund Manager
Gold & Silver Trading Alerts
Forex Trading Alerts
Oil Investment Updates
Oil Trading Alerts

