

Although currency bears triggered a sharp decline on Wednesday, their opponents kept cool and erased most of yesterday’s move during today’s session. Can we expect further improvement in the following days?
- EUR/USD: none
- GBP/USD: none
- USD/JPY: long (a stop-loss order at 111.11; the initial upside target at 113.40)
- USD/CAD: none
- USD/CHF: none
- AUD/USD: short (with a stop-loss order at 0.7208; the exit downside target at 0.7055)
EUR/USD
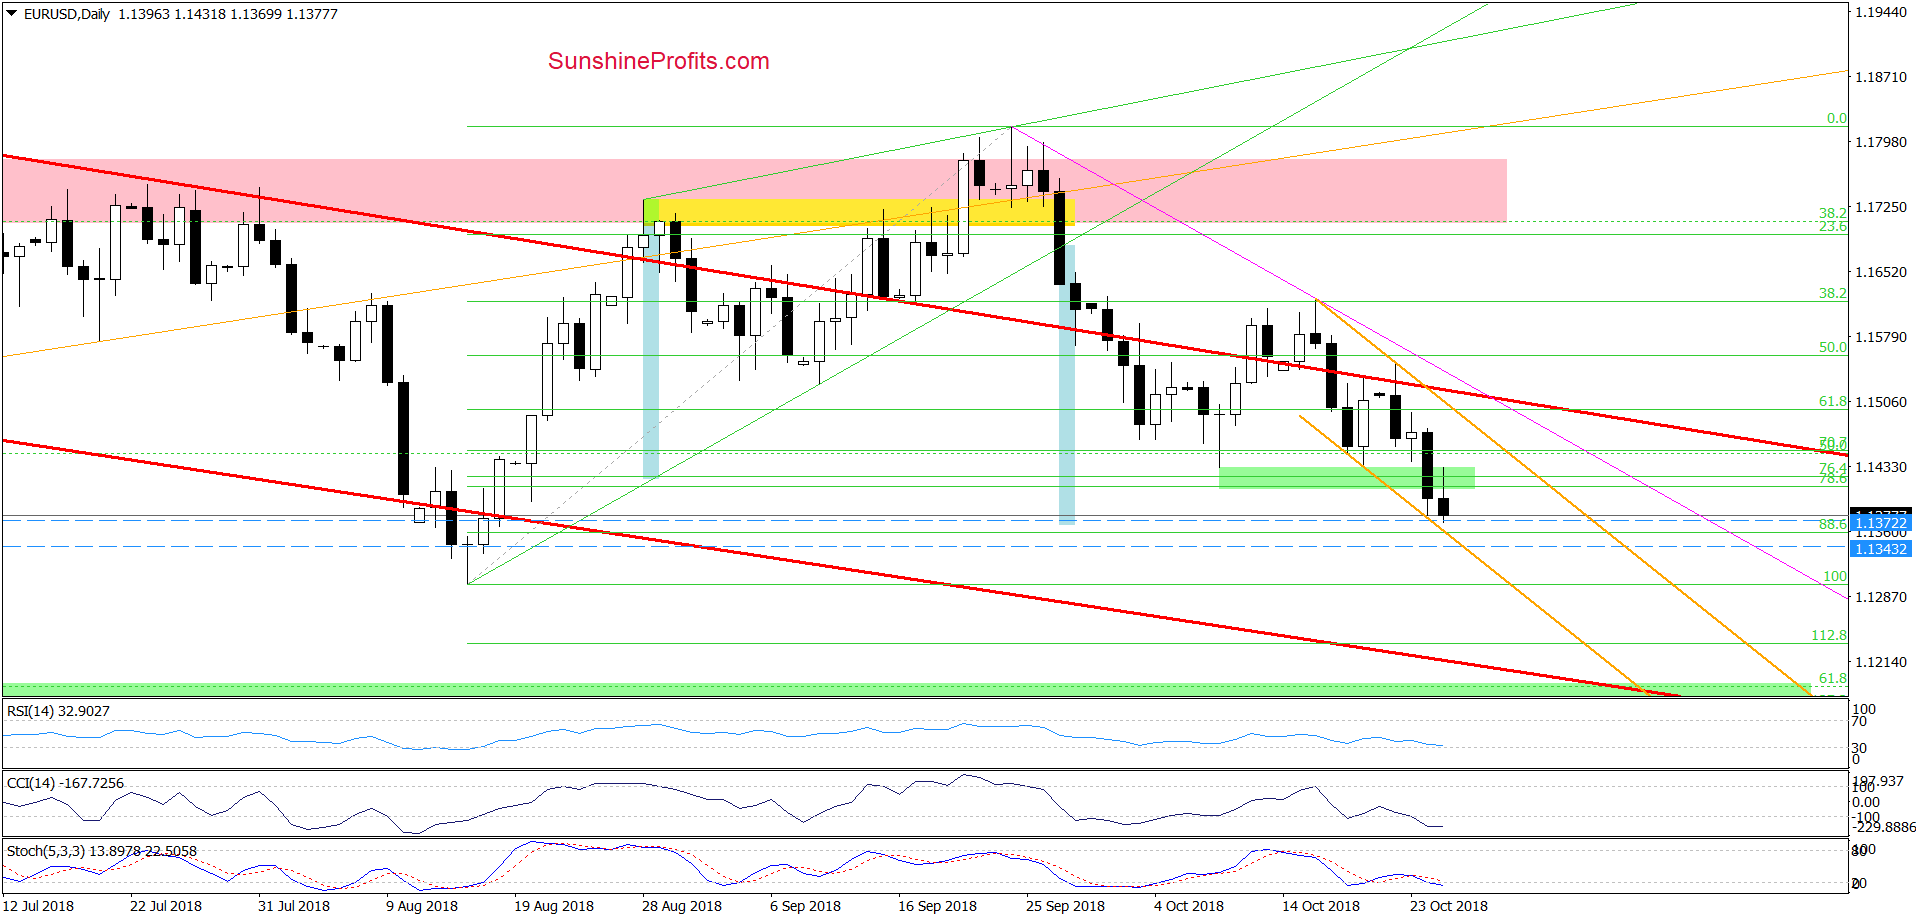
Looking at the daily chart, we see that EUR/USD broke below the green support zone during yesterday’s session and closed the day below it.
Earlier today, currency bulls tried to go higher, but the resistance level based on the last week’s low triggered another move to the downside and the exchange rate slipped to the area where the size of the downward move corresponded to the height of the green rising wedge (marked with blue).
Thanks to this drop, the pair approached the lower border of the very short-term orange declining trend channel and the 88.6% Fibonacci retracement, which together serve as the nearest support area.
Therefore, if currency bulls didn’t manage to hold them, the way to the mid-August lows will be open.
Trading position (short-term; our opinion): None positions are justified from the risk/reward perspective.
USD/CAD
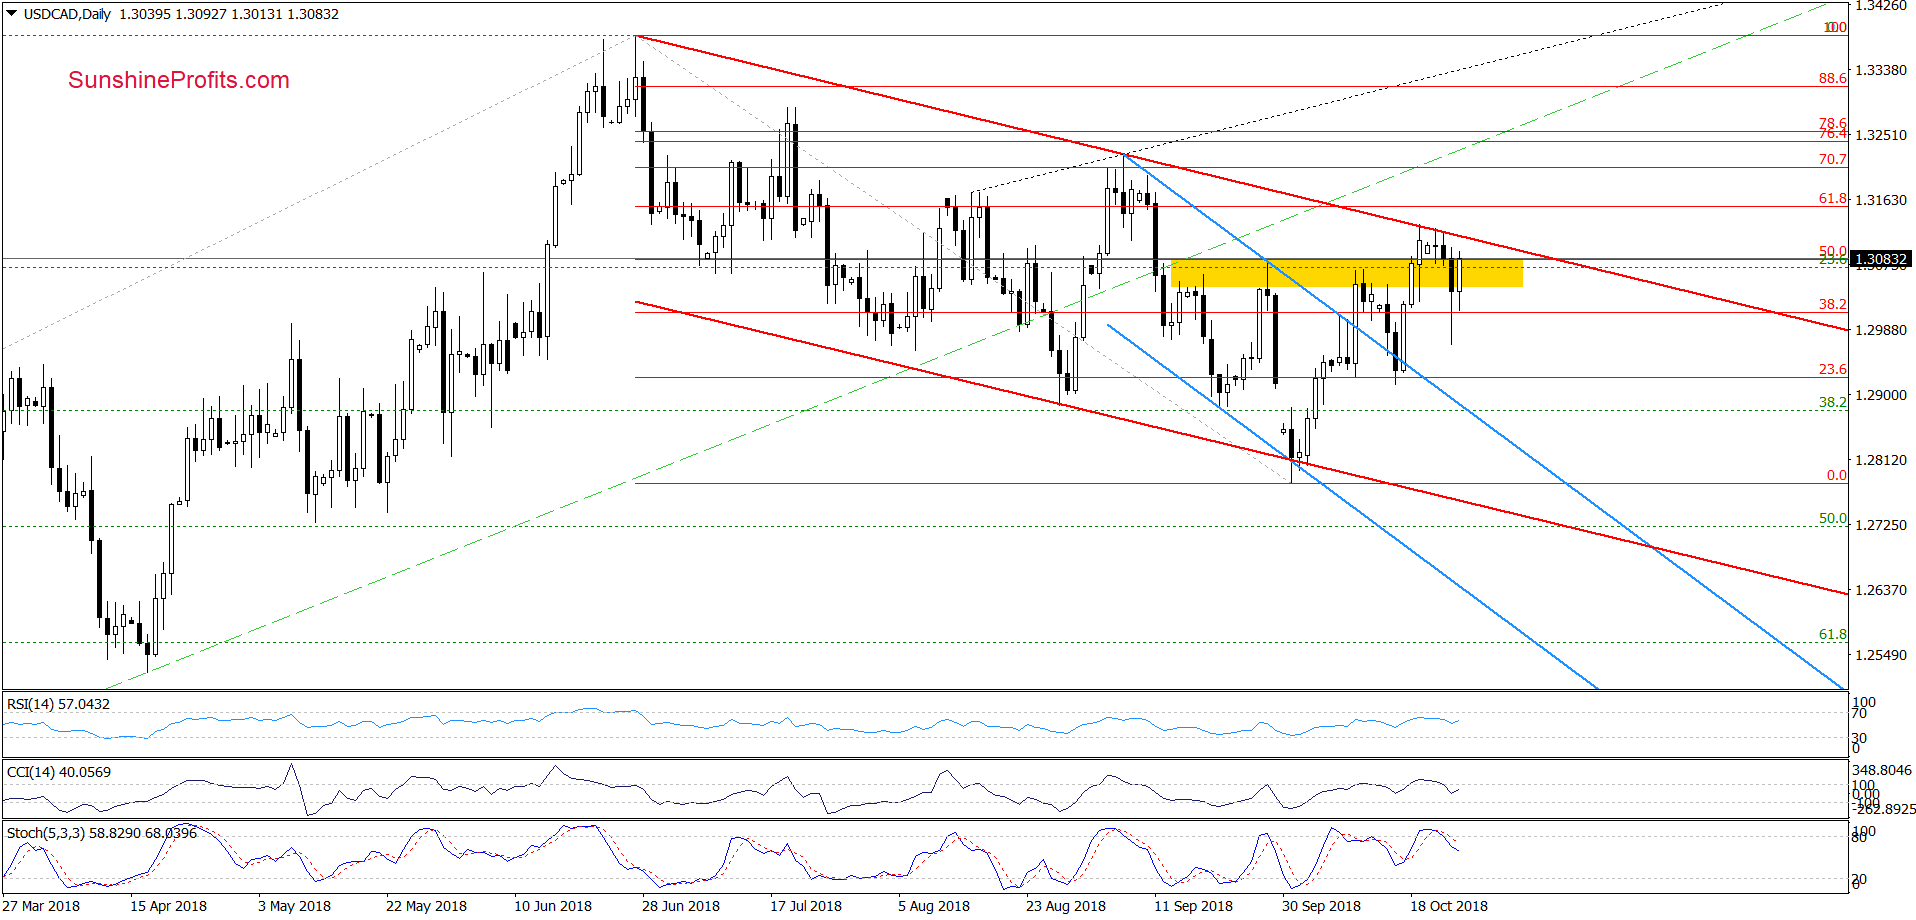
In our last commentary on this currency pair we wrote:
(…) we should keep in mind that the CCI and the Stochastic Oscillator are very close to generating sell signals, which could translate into lower values of USD/CAD in the coming week – especially if the bulls show weakness at current levels.
From today’s point of view, we see that currency bulls didn’t manage to break above the upper border of the red declining trend channel earlier this week, which resulted in a sharp downswing during yesterday’s session.
Despite this move, the byers triggered a rebound before the session closure, which caused further improvement earlier today. Such price action suggests that we’ll likely see another test of the strength of the red resistance line in the very near future.
Nevertheless, we still believe that as long as there is no breakout above the channel or an invalidation of the breakout above the yellow area a bigger move in any direction is not likely to be seen. As always, we’ll keep you - our subscribers - informed should anything change.
Trading position (short-term; our opinion): No positions are justified from the risk/reward perspective.
USD/CHF
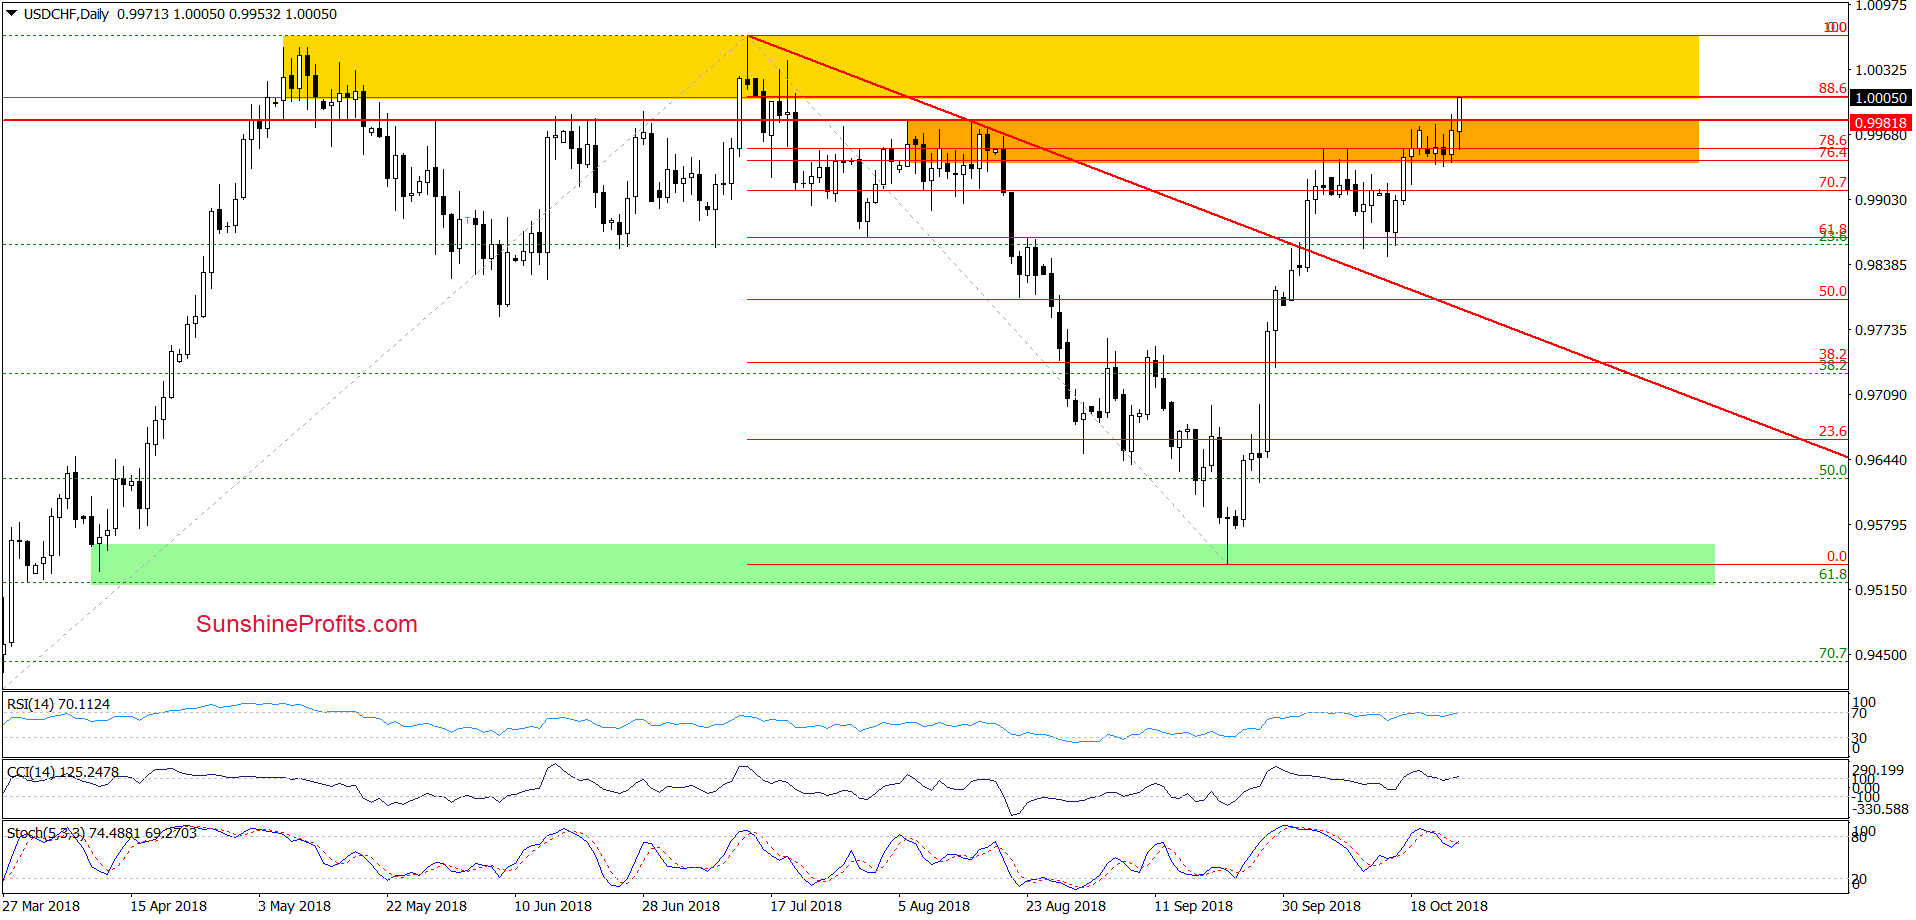
The first thing that catches the eye on the daily chart is the breakout above the orange resistance zone. Nevertheless, despite this improvement, we should keep in mind what we wrote in our last commentary on USD/CHF:
(…) when we take into account the fact that the buy signal re-generated by the Stochastic Oscillator remains in the cards, it seems that currency bulls will try to push the pair higher in the very near future. At this point, however, it is worth keeping in mind that slightly above the orange area the buyers will have to face another strong resistance zone (marked with yellow), which keeps gains in check since mid-July.
Therefore, in our opinion, another significant move to the upside will be more likely and reliable if we see USD/CHF above the yellow resistance zone. Until this time, another reversal from this area should not surprise us – especially if the daily indicators generate sell signals in the coming week.
Trading position (short-term; our opinion): No positions are justified from the risk/reward perspective. We will keep you informed should anything change, or should we see a confirmation/invalidation of the above.
Thank you.
Nadia Simmons
Forex & Oil Trading Strategist
Przemyslaw Radomski, CFA
Founder, Editor-in-chief, Gold & Silver Fund Manager
Gold & Silver Trading Alerts
Forex Trading Alerts
Oil Investment Updates
Oil Trading Alerts

