

Despite the fact that the buyers managed to approach USD/CAD to the June peaks, their triumph didn’t last long. The proximity to the aforementioned highs encouraged the sellers to take action, which resulted in a correction and a breakdowns below very important support lines. What can be the consequences of this event in the coming week?
- EUR/USD: none
- GBP/USD: none
- USD/JPY: short (a stop-loss order at 114.68; the initial downside target at 111.84)
- USD/CAD: short (a stop-loss order at 1.3401; the initial downside target at 1.2934)
- USD/CHF: short (a stop loss order at 1.0192; the initial downside target at 0.9881)
- AUD/USD: long (a stop-loss order at 0.7190; the initial upside target at 0.7440)
EUR/USD
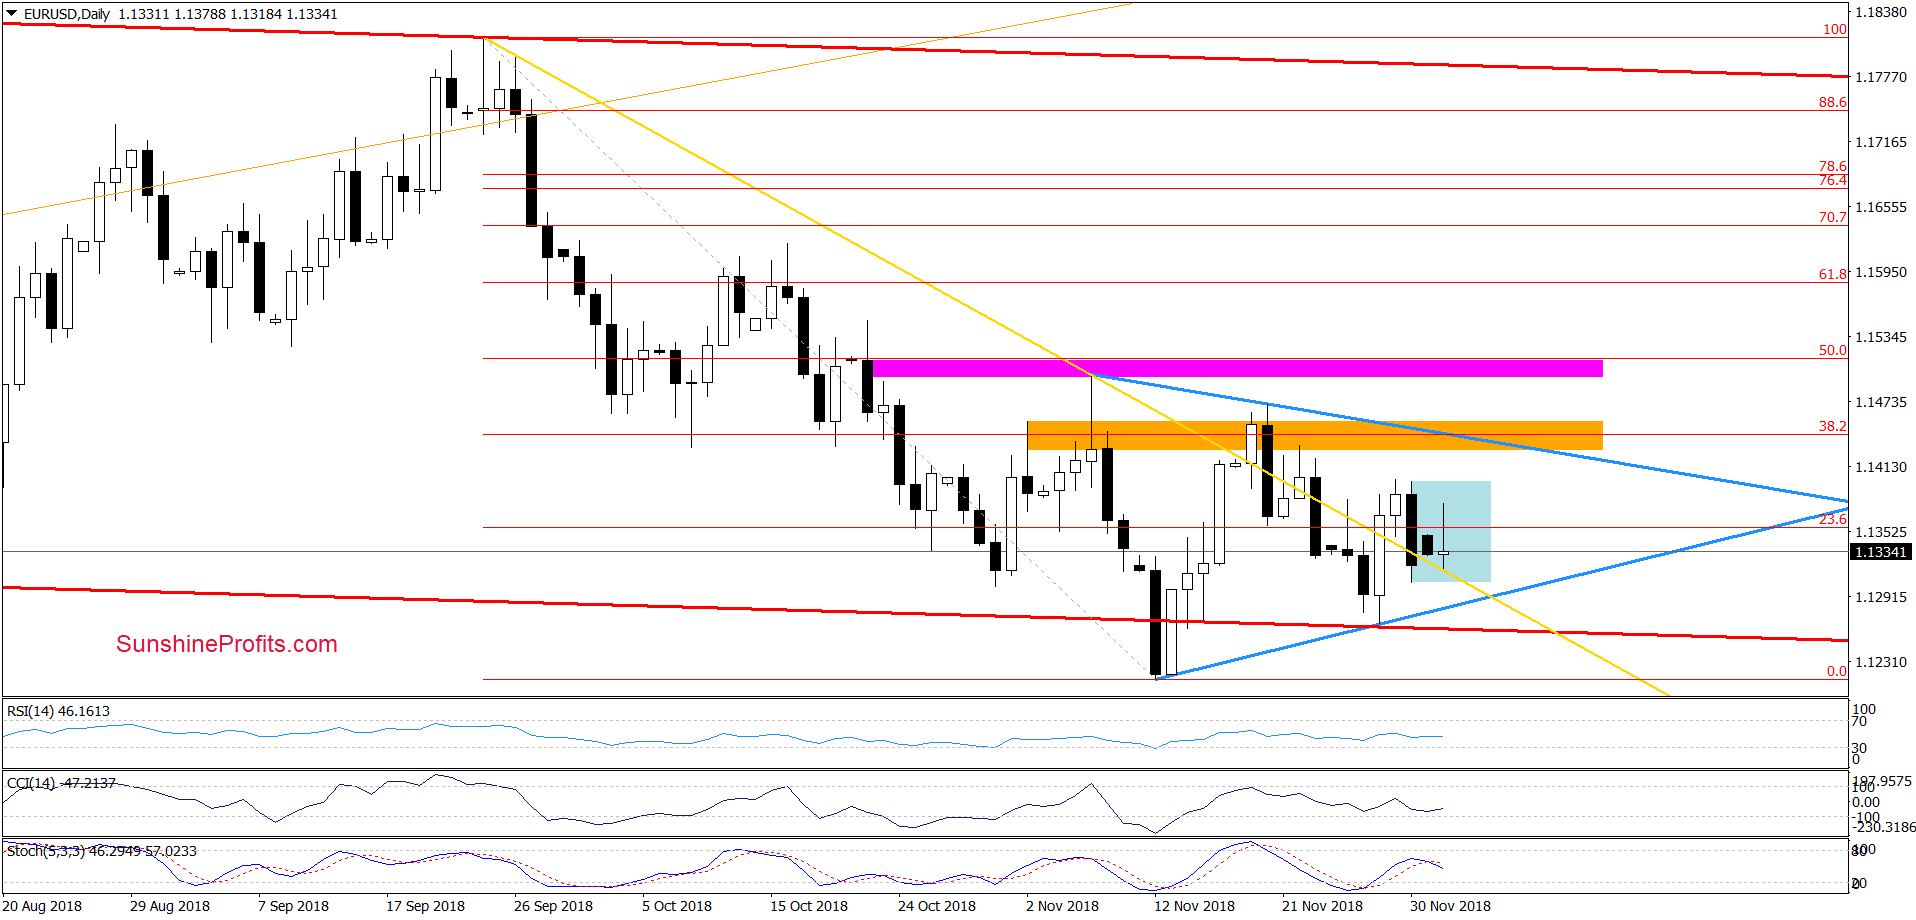
Looking at the daily chart, we see that the sellers managed to close Friday’s session under the yellow and invalidated the earlier breakout once again, which in combination with the sell signal generated by the Stochastic Oscillator doesn’t bode well for higher values of the exchange rate – especially when we factor in today’s price action.
What do we mean by that? On the above chart, we see that currency bulls triggered a rebound earlier today, but despite this action, the proximity to the upper border of the blue consolidation was enough to encourage the bears to act. As a result, the exchange rate pulled back and tested the yellow line.
Nevertheless, in our opinion, the overall situation remains almost unchanged in the short term as EUR/USD is trading not only inside the above-mentioned blue consolidation, but also inside the blue triangle.
Taking these facts into account, we believe that as long as there is no breakout above the upper border of the triangle (or a breakdown under the lower line) another bigger move is not likely o be seen and short-lived moves in both directions should not surprise us in the coming week.
Trading position (short-term; our opinion): No positions are justified from the risk/reward perspective. We will keep you informed should anything change, or should we see a confirmation/invalidation of the above.
USD/JPY
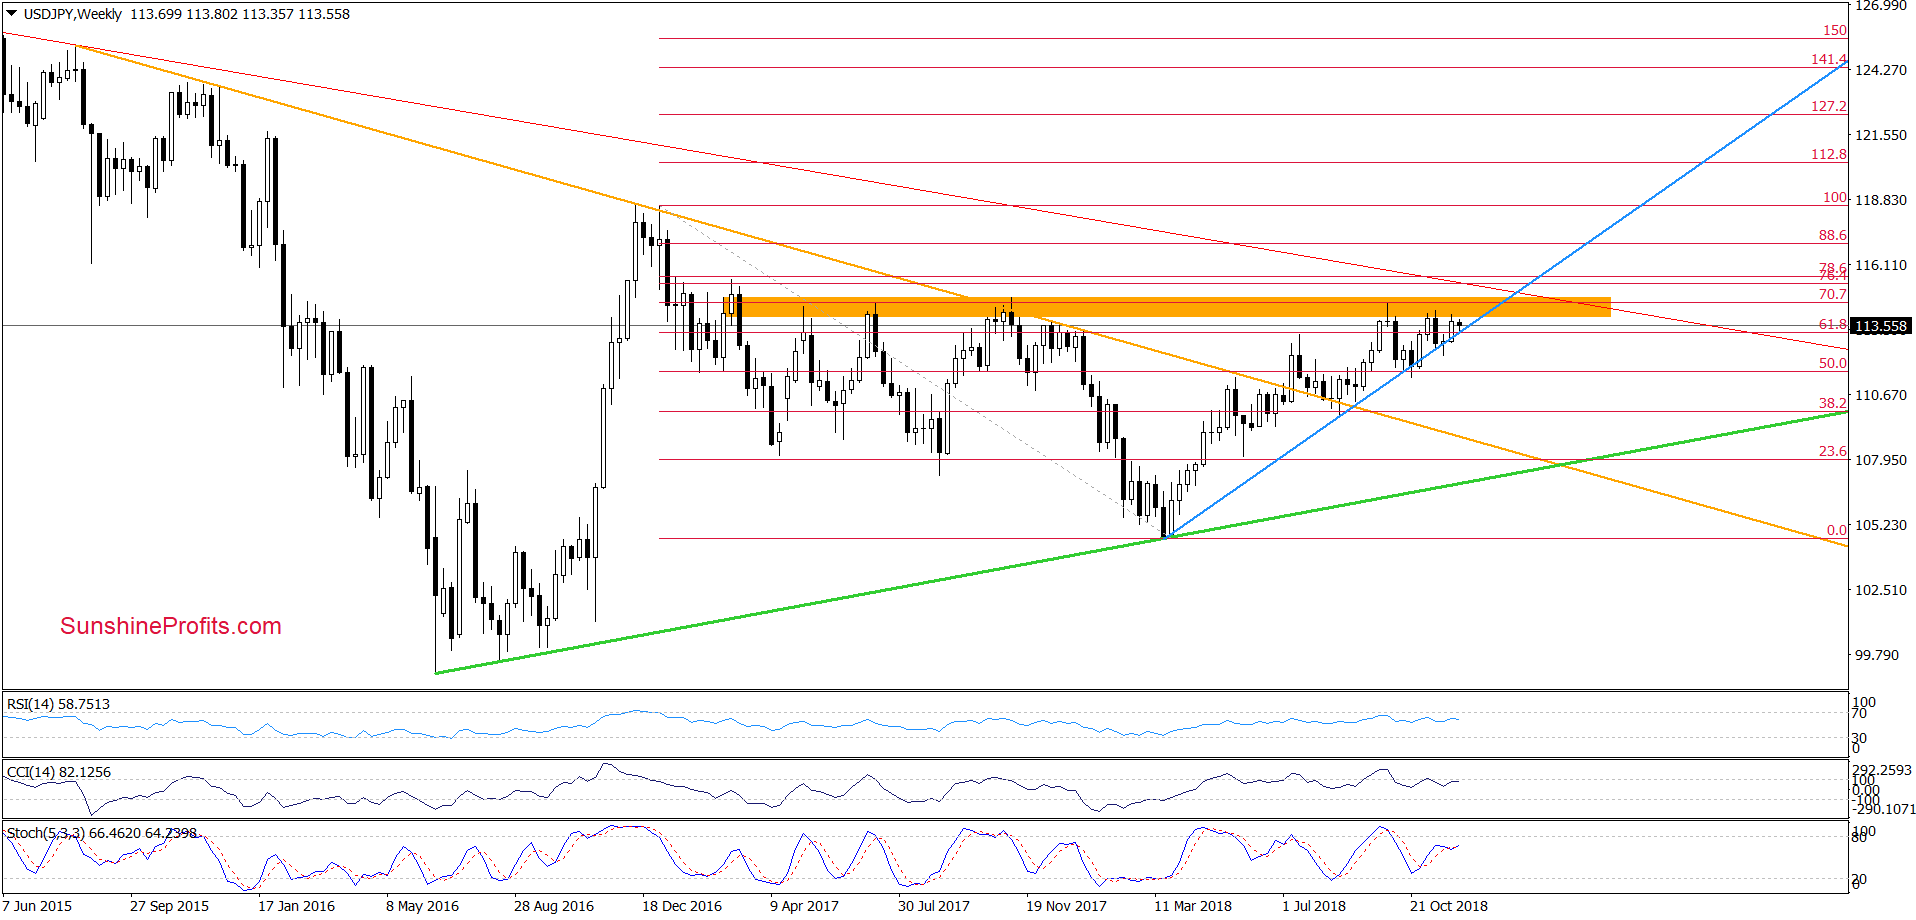
From the weekly perspective, we see that the overall situation in the medium term remains almost unchanged as USD/JPY is trading in a narrow range between the major resistance zone (marked with orange, which continues to keep gains in check since March 2017) and the long-term blue support line based on the March 2018 and August 2018 lows.
Although currency bulls managed to invalidate the earlier tiny breakdowns under this major support line, the orange zone is still in cards, encouraging the sellers to act. Additionally, the current position of the weekly indicators suggests that anther move to the downside is just a matter of time.
Having said the above, let’s check how the last week’s price action affect the short-term perspective.
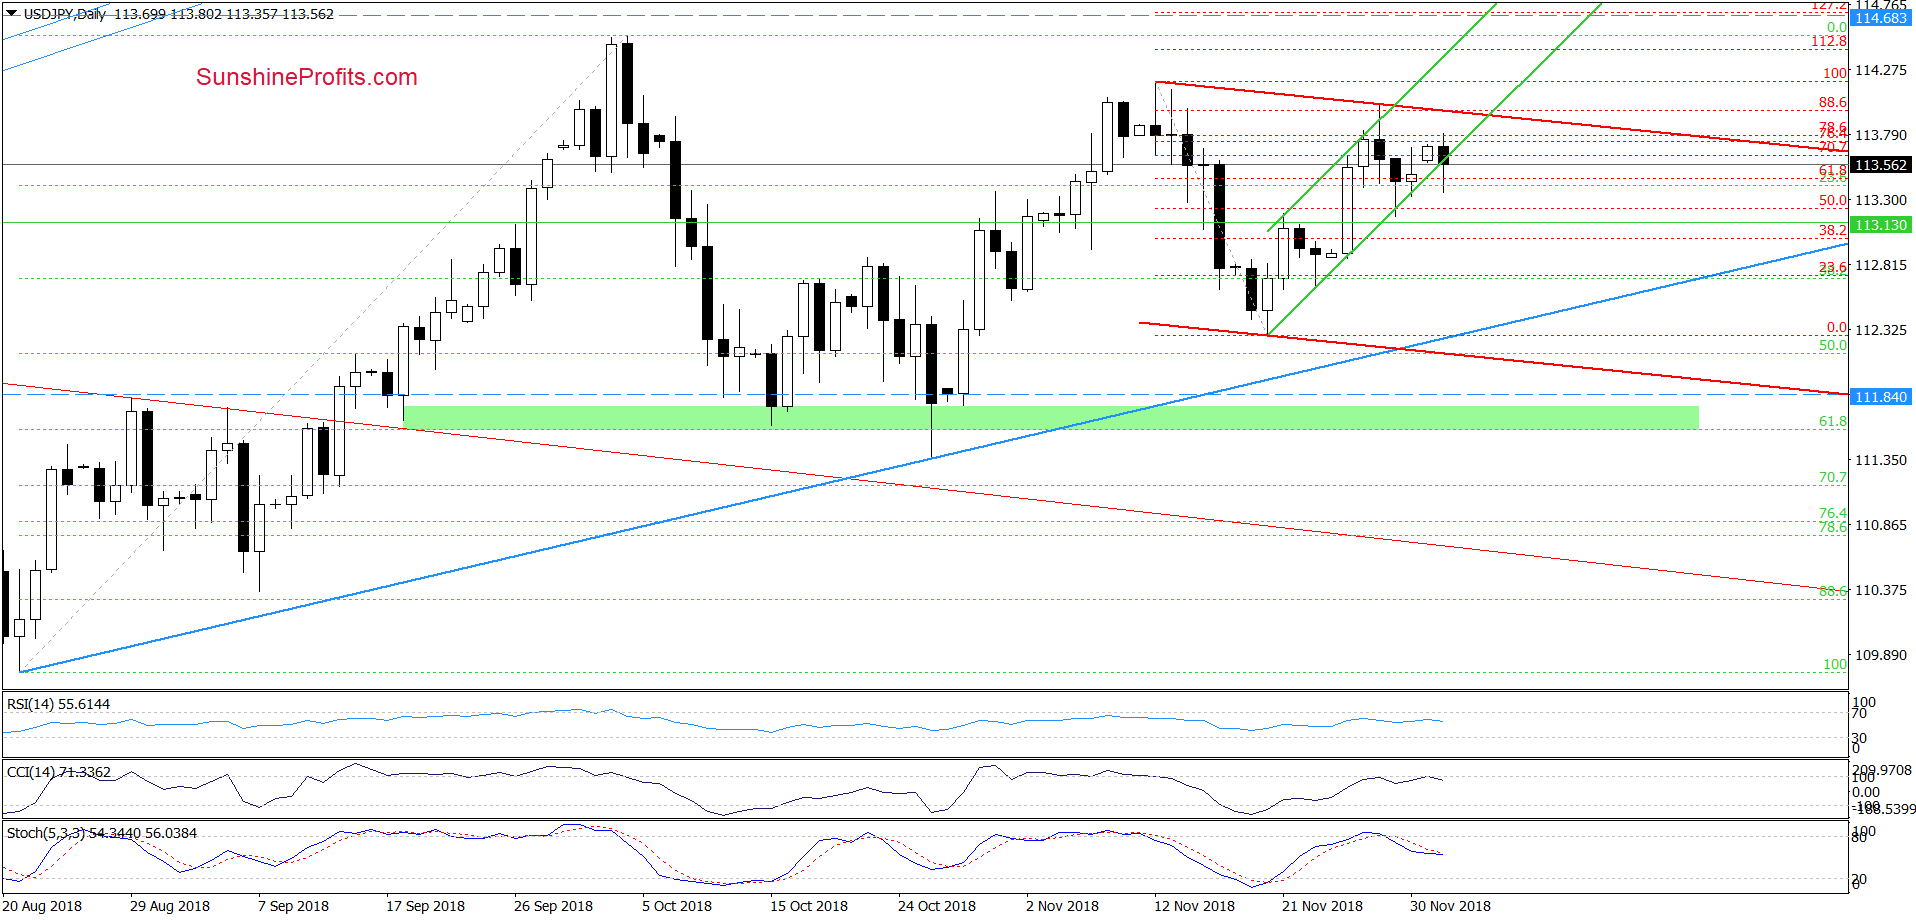
Looking at the daily chart, we see that currency bears pushed USD/JPY to the lower border of the green rising trend channel once again (there was even a short-lived decline under this support), which in combination with the sell signals generated by the CCI and the Stochastic Oscillator increases the likelihood of lower values of the exchange rate in the coming days.
What could happen if USD/JPY drops below the formation? In our opinion, the sellers will test (at least) the medium-term blue support line based on the August and October lows or even the November 20 low.
Trading position (short-term; our opinion): Short positions with a stop-loss order at 114.68 and the initial downside target at 111.84 are justified from the risk/reward perspective.
USD/CAD
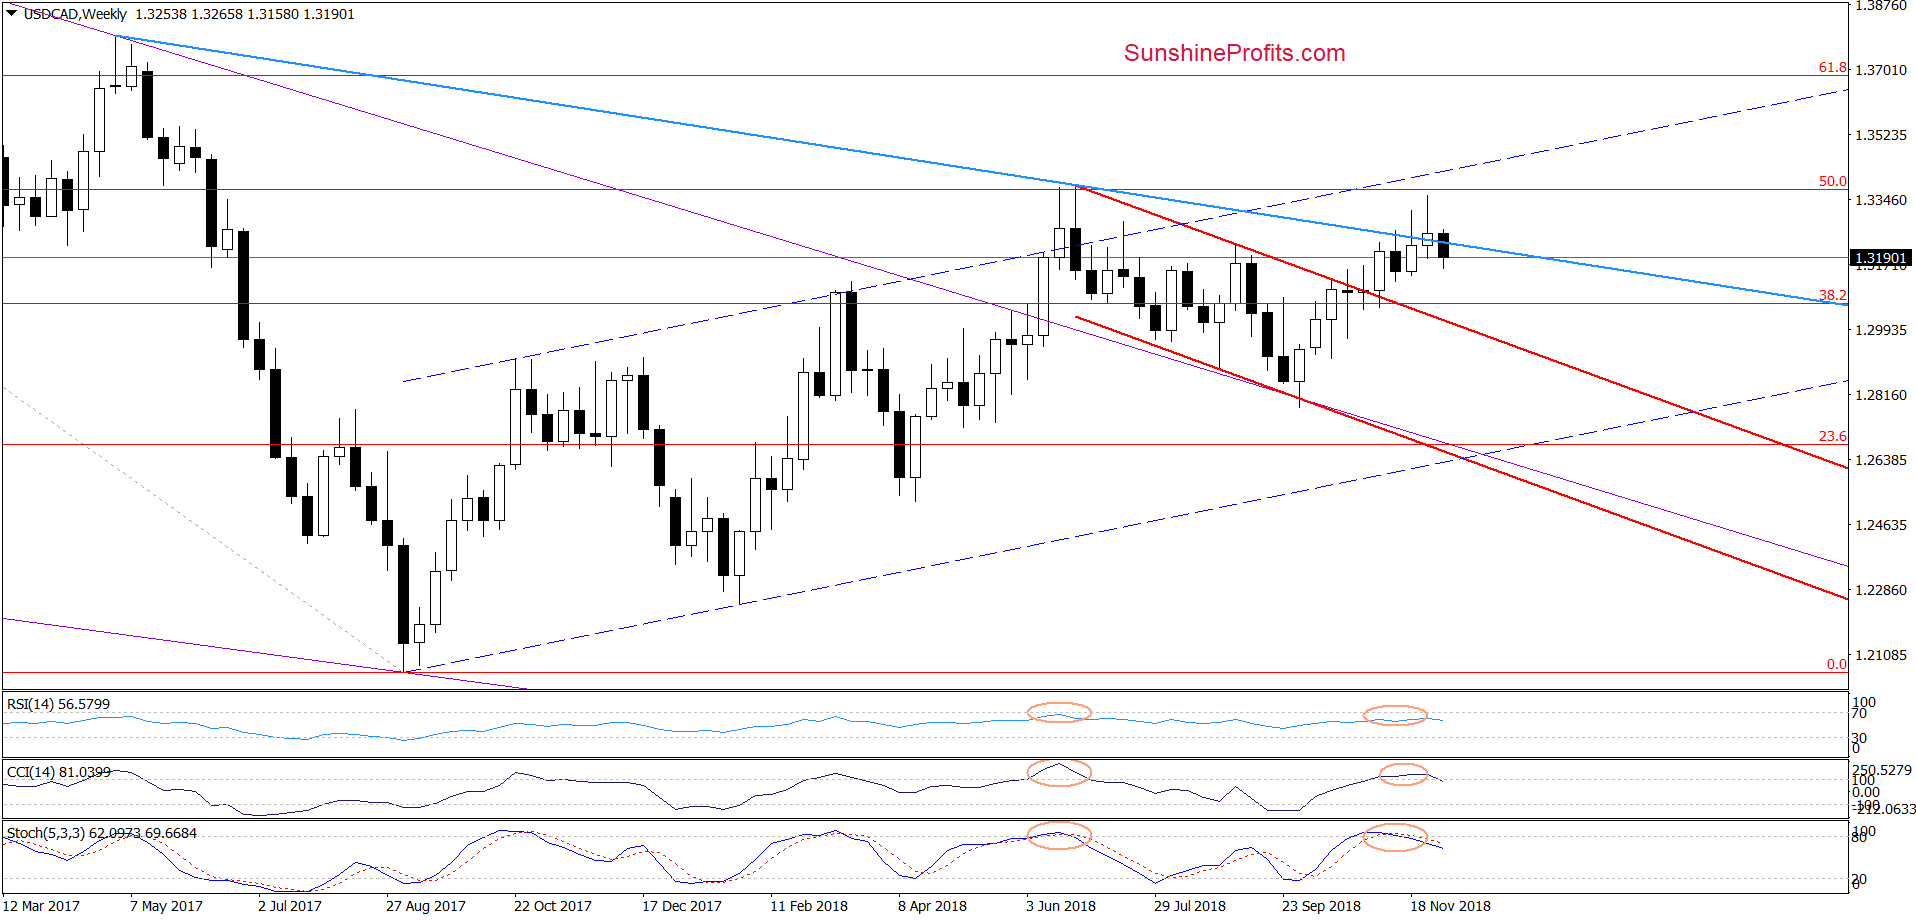
The first thing that catches the eye on the weekly chart is an invalidation of the earlier small breakout above the long-term blue resistance line. Taking this bearish development into account and combining it with the current position of the weekly indicators (it is very similar to what we saw at the end of June before “the summer” decline below the barrier of 1.3000), we continue to think that lower values of USD/CAD are more likely than not.
How low could USD/CAD go in the following days? Let’s examine the daily chart to find out.
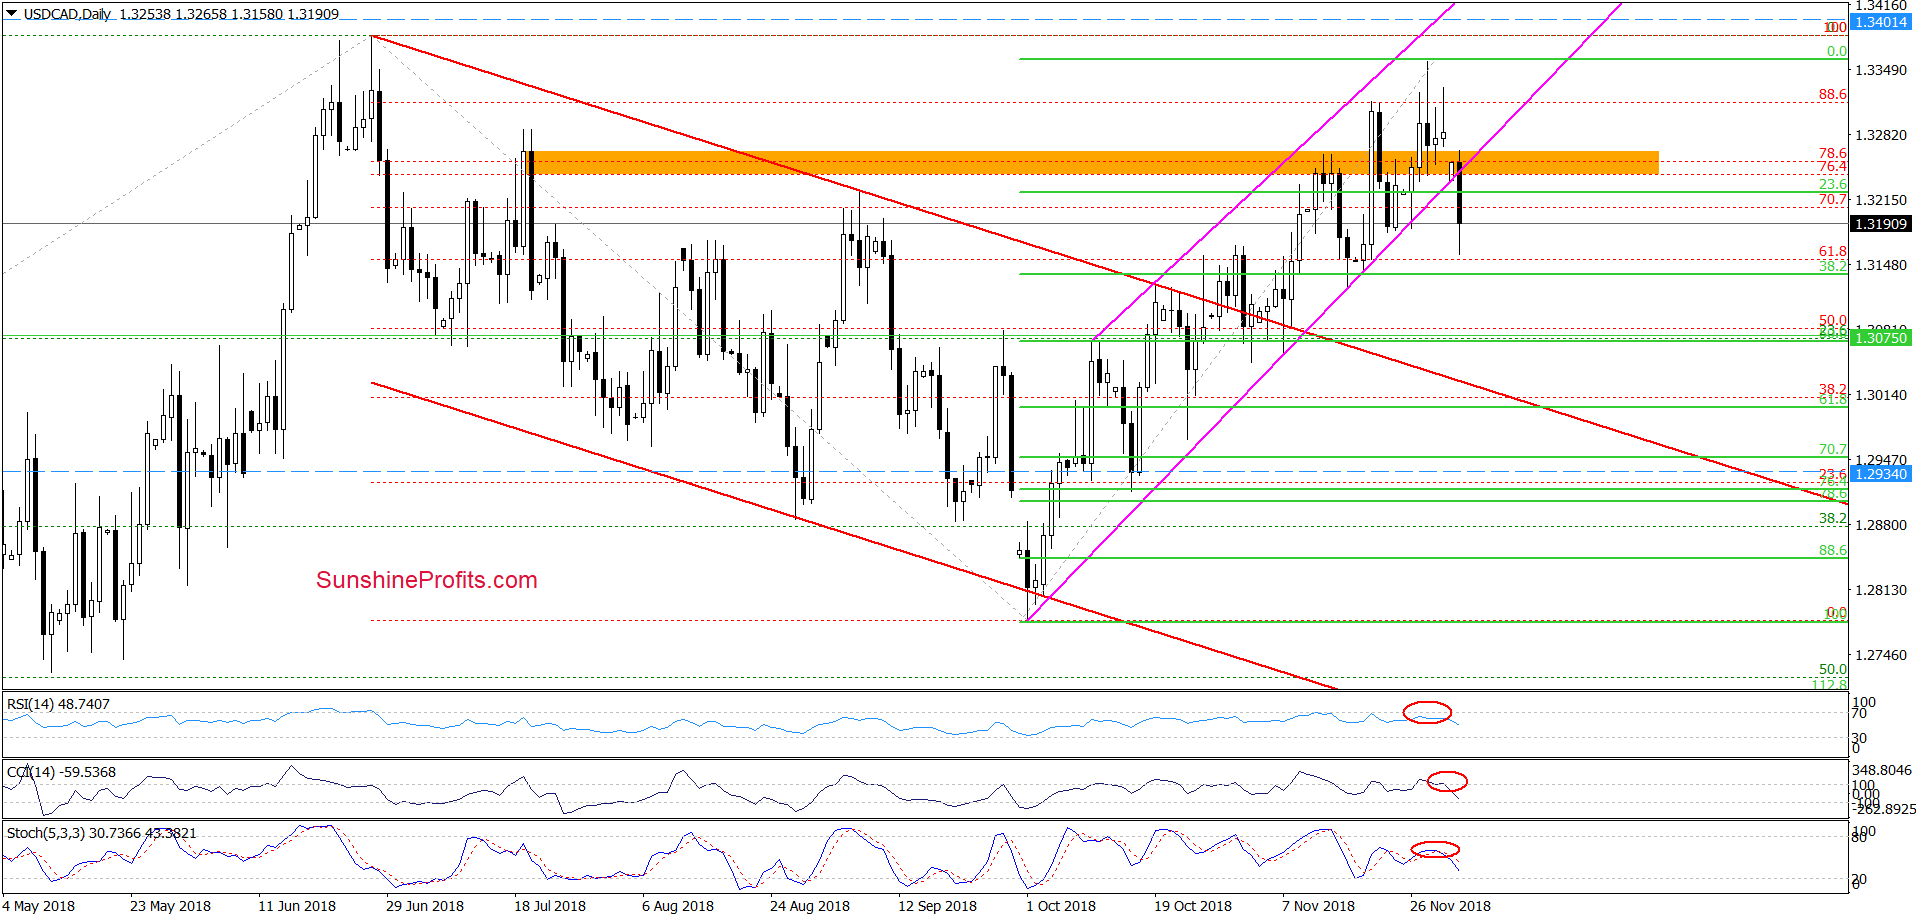
In our last commentary on this currency pair, we wrote the following:
(…) When can we expect such deterioration? (…) the pro-bearish scenario will be more likely and reliable if the sellers manage to close the day below the lower border of the pink rising trend channel. If the situation develops in tune with this assumption, the way to the previously-broken upper border of the red declining trend will be open.
From today’s point of view, we see that the situation developed in line with our assumptions and USD/CAD moved sharply lower earlier today. Thanks to this price action, the exchange rate dropped below the pink trend channel, which suggests that we’ll see a test of the 50% Fibonacci retracement (based on the October-November upward move) or even the above-mentioned downside target (the upper border of the red declining trend, which is currently at around 1.3025) later this week.
Trading position (short-term; our opinion): Short positions with a stop-loss order at 1.3401 and the initial downside target at 1.2934 are justified from the risk/reward perspective.
Thank you.
Nadia Simmons
Forex & Oil Trading Strategist
Przemyslaw Radomski, CFA
Founder, Editor-in-chief, Gold & Silver Fund Manager
Gold & Silver Trading Alerts
Forex Trading Alerts
Oil Investment Updates
Oil Trading Alerts

