

Invalidation of the breakdown under three important lines (including two lower borders of declining trend channels) aroused the imagination of currency bulls and warmed them to fight for higher levels of USD/CAD. Are worrying technical factors visible on the short-term chart enough to stop their rally in the coming days?
- EUR/USD: short (a stop-loss order at 1.1878; the initial downside target at 1.1343)
- GBP/USD: short (a stop-loss order at 1.3256; the initial downside target at 1.2923)
- USD/JPY: half of the long positions (a stop-loss order at 112.47; the next upside target at 114.03)
- USD/CAD: none
- USD/CHF: none
- AUD/USD: none
EUR/USD
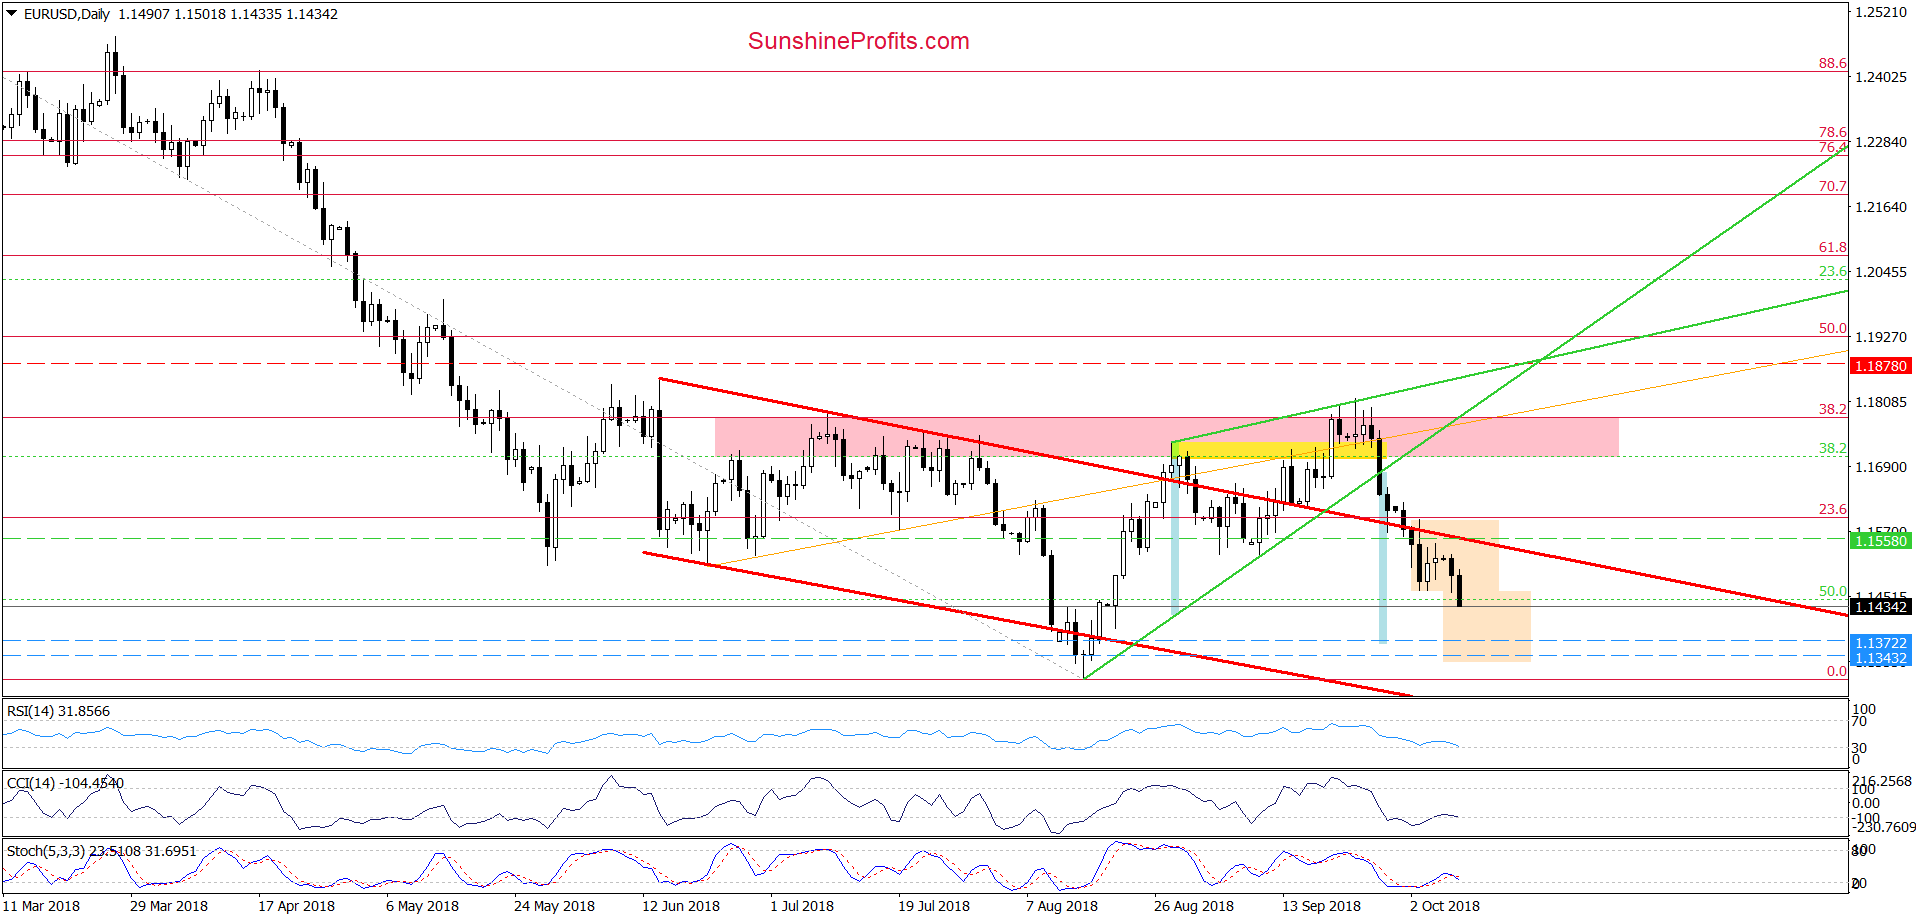
Yesterday, EUR/USD bounced off the last week’s lows, which caused the currency pair closed another day inside the consolidation. Nevertheless, the combination of negative factors about which we wrote in the previous alerts encouraged the bears to another attack during today's session.
As a result, the exchange rate broke below the lower line of the formation, which means that we’ll see a realization of the pro-bearish scenario that we posted in yesterday's alert:
(…) What can we expect next?
Taking into account the last week’s consolidation (between Wednesday high and low), we think that if the pair drops under the lower line of the formation, we’ll see not only a decline to around 1.1372 (where the size of the downward move will correspond to the height of the green triangle), but also a test of our initial downside target and the mid-August lows in the coming days.
Trading position (short-term; our opinion): Short positions with a stop-loss order at 1.1878 and the initial downside target at 1.1343 are justified from the risk/reward perspective.
USD/CAD
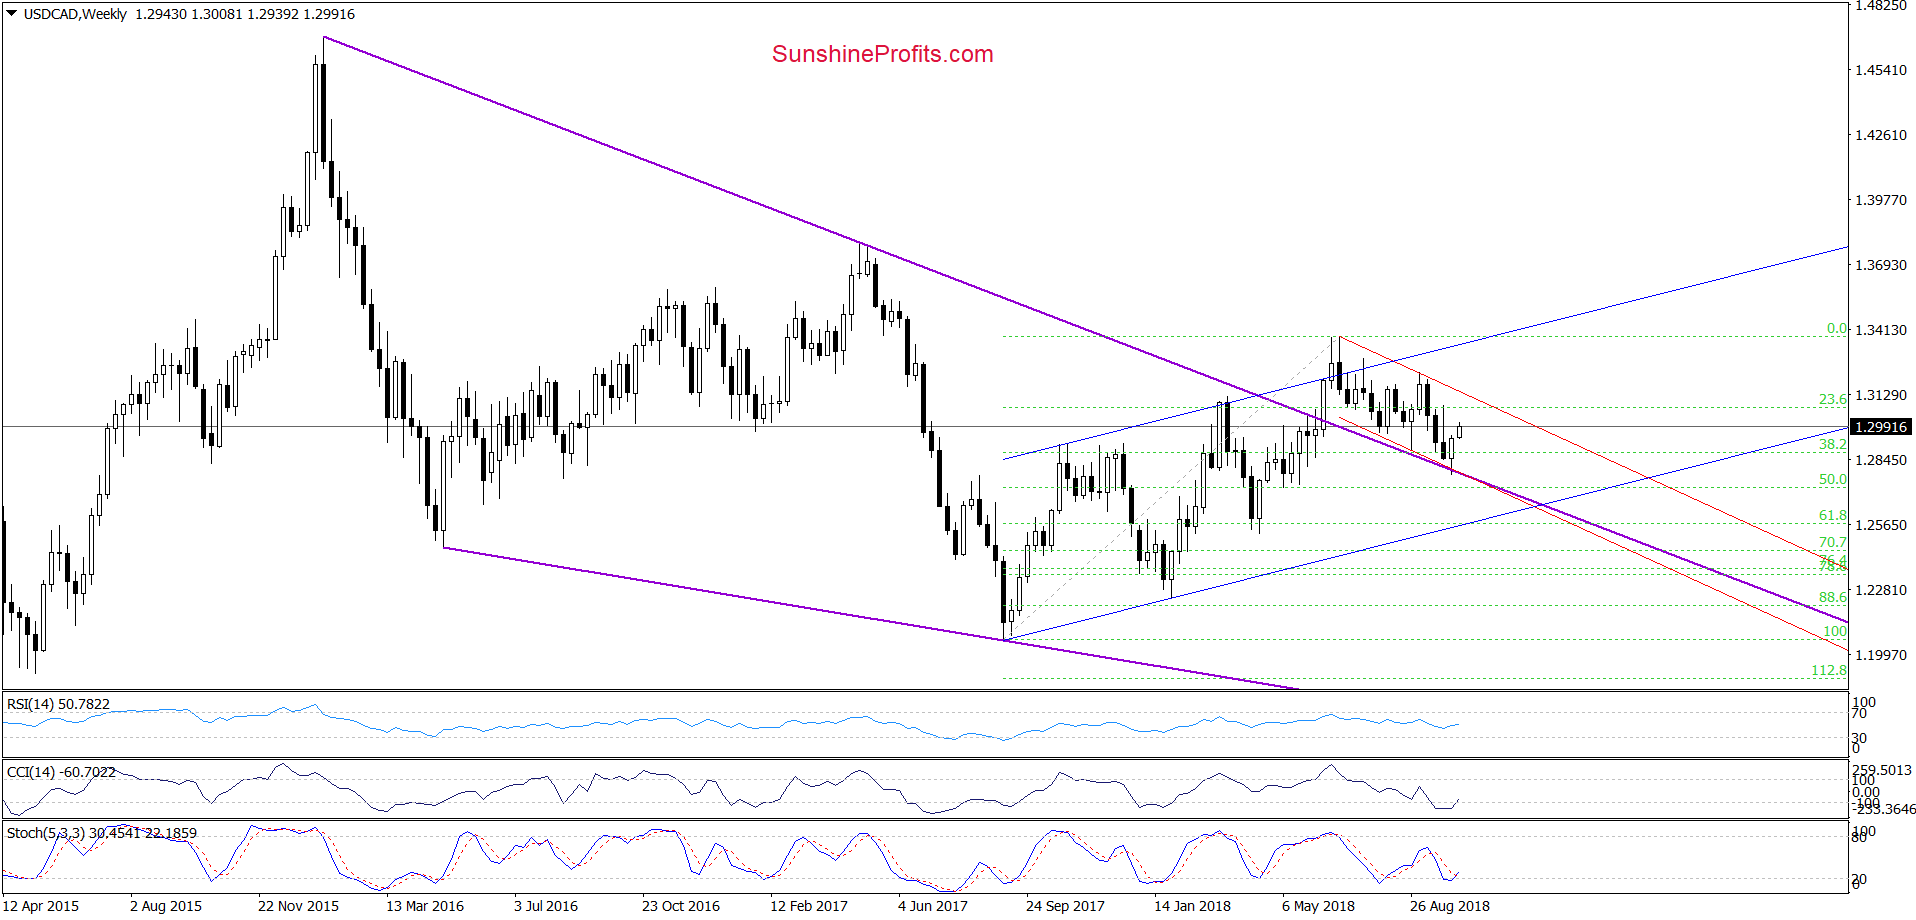
Looking at the weekly chart of USD/CAD, we see that the exchange rate bounced off the previously-broken long-term purple declining line (it serves as the major support) in September, invalidating the tiny breakdown (frankly speaking barely visible from this perspective). Thanks to this upswing, the pair also invalidated the earlier breakdown under the lower border of the red declining trend channel, which gave currency bulls important reasons to act.
How the recent price action affected the short-term picture of USD/CAD?
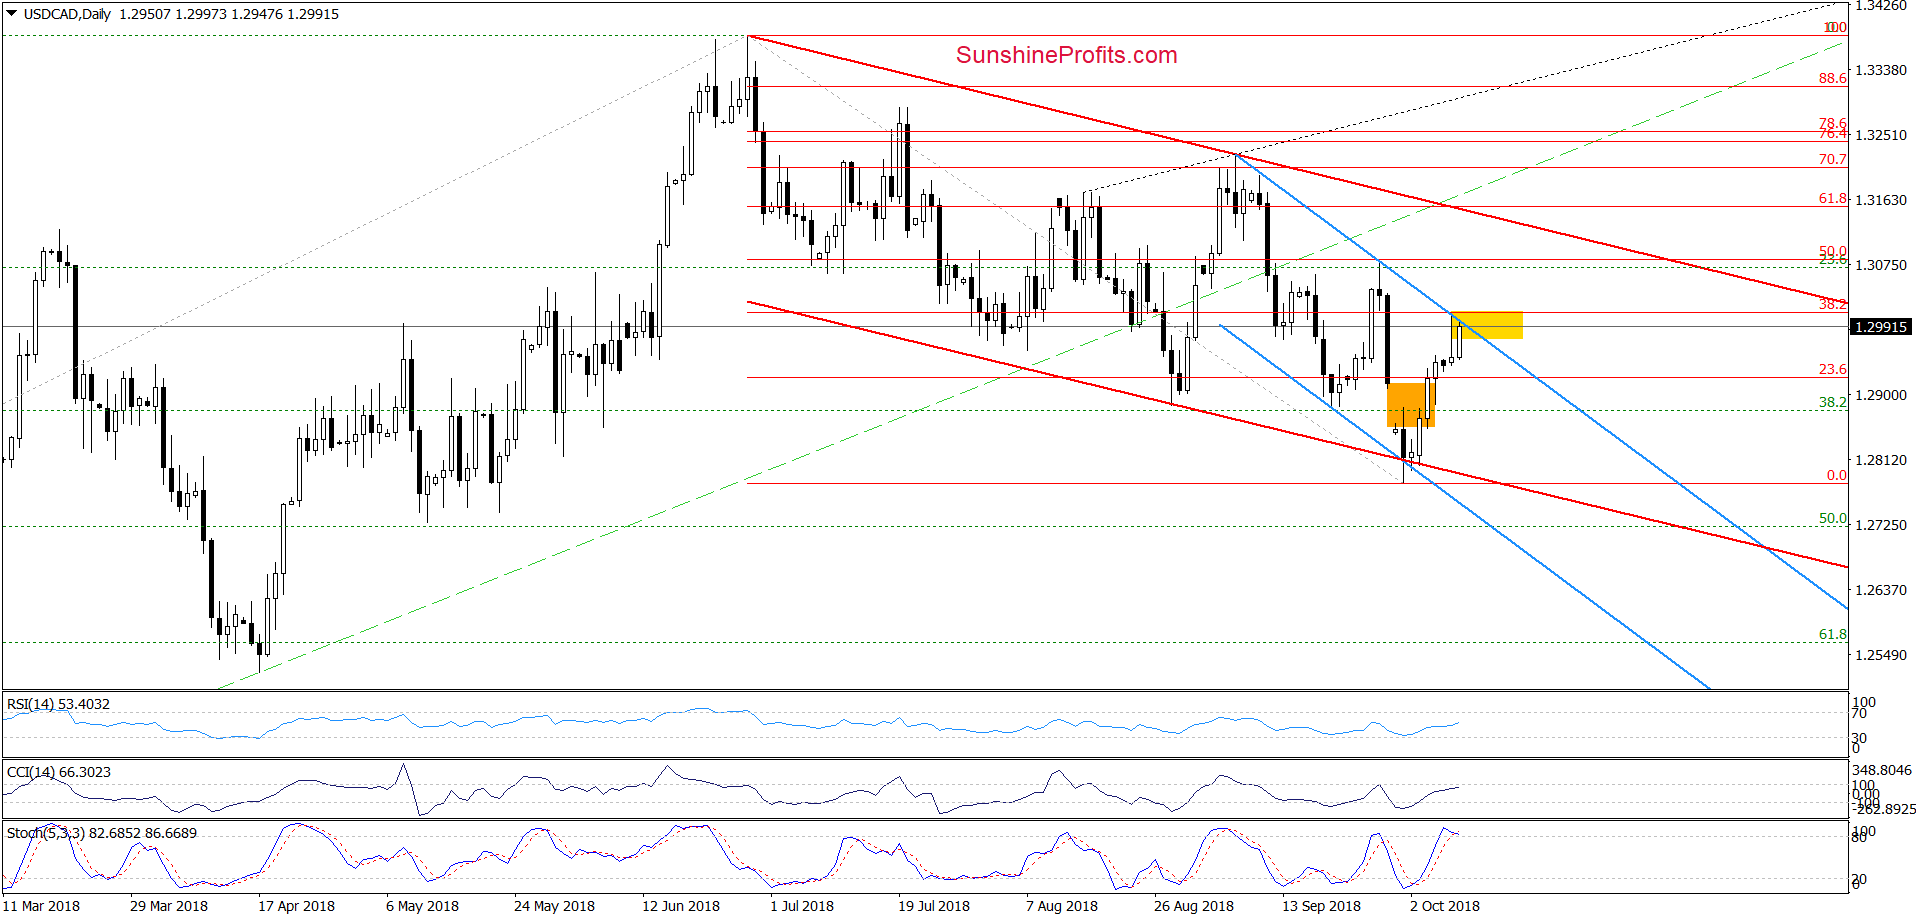
From the daily perspective, we see that the recent move to the upside invalidated also earlier breakdown under the very short-term blue declining trend channel, which in combination with the above-mentioned invalidations and buy signals generated by the daily indicators triggered a rally.
Thanks to this price action USD/CAD climbed to the yellow resistance zone created by the upper border of the formation and the 38.2% Fibonacci retracement (based on the entire June-October decline), which could stop further improvement in the very near future.
Such scenario is also reinforced by the current position of the CCI and the Stochastic Oscillator (the latter generated a sell signal earlier today) and the shape of yesterday’s candlestick. As you see it has a long upper shadow that informs that currency bears are very active around yesterday's intraday high (and the above-mentioned resistances) and will likely do not give up without a fight.
If the situation develops in line with the above assumptions and we see currency bulls’ weakness in this area (for example, a “fakeout” above the yellow resistance zone), the exchange rate will likely test Friday’s low (which is very close to the 50% Fibonacci retracement based on the recent upward move) in the following days.
Trading position (short-term; our opinion): No positions are justified from the risk/reward perspective. We will keep you informed should anything change, or should we see a confirmation/invalidation of the above.
USD/CHF
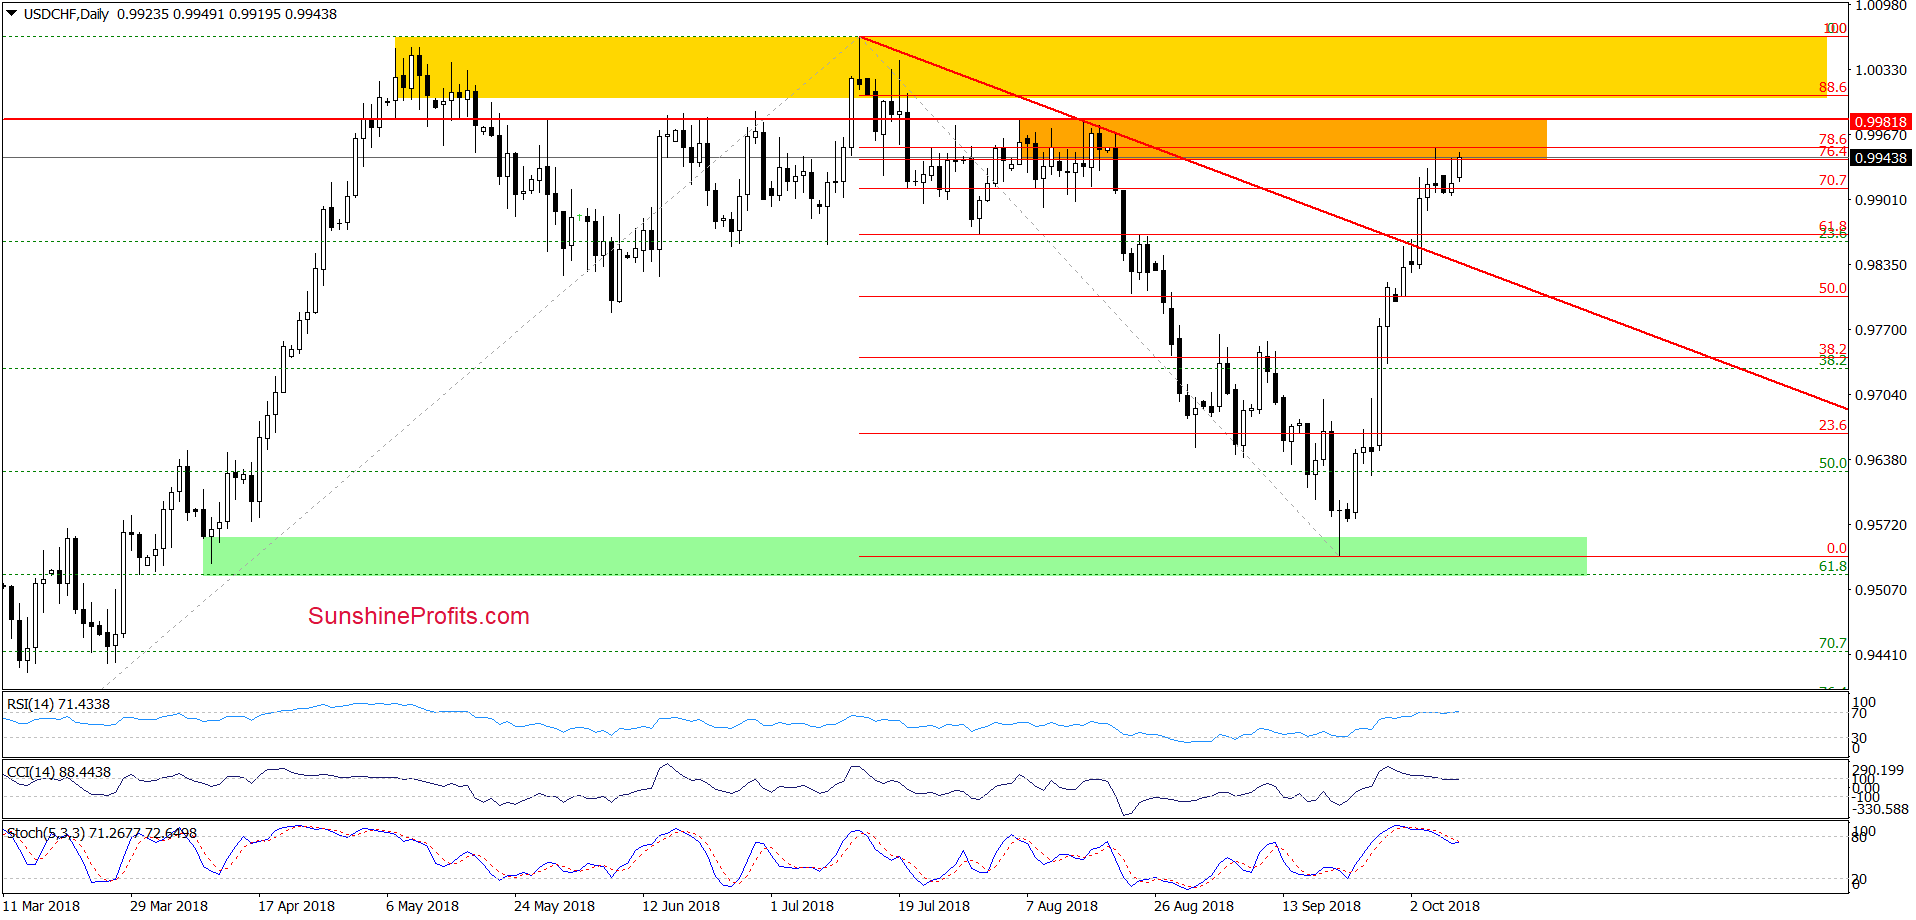
Last week’s breakout above the red declining resistance line triggered further improvement in the following days, which resulted in a climb to the orange resistance zone created by the 78.6%, 78.6% Fibonacci retracements and the August peaks.
Nevertheless, the RSI increased above the level of 70 for the first time since May, which doesn’t bode well for further rally. Why? Last time such high readings of the indicator preceded a bigger move to the downside, which suggests that if the history repeats itself once again, we’ll see a reversal and lower values of USD/CHF in the near future.
Additionally, there are bearish divergences between the CCI, the Stochastic Oscillator and the exchange rate, which increases the probability of pro-bearish scenario.
And what could it be like? In our opinion, if currency bulls do not show more strength in the coming days and the pair reverses and drops under yesterday’s low, we’ll likely see a test of the previously-broken red declining line, which serves as the nearest support later this week or at the beginning of next week.
Trading position (short-term; our opinion): No positions are justified from the risk/reward perspective. We will keep you informed should anything change, or should we see a confirmation/invalidation of the above.
Thank you.
Nadia Simmons
Forex & Oil Trading Strategist
Przemyslaw Radomski, CFA
Founder, Editor-in-chief, Gold & Silver Fund Manager
Gold & Silver Trading Alerts
Forex Trading Alerts
Oil Investment Updates
Oil Trading Alerts

