

Earlier today, currency bears pushed the greenback lower against its Canadian counterpart, which resulted in a re-test of the medium-term support. This is a repeat of what already saw in the previous week, but will this time the buyers be stronger and more willing to fight for higher levels?
EUR/USD
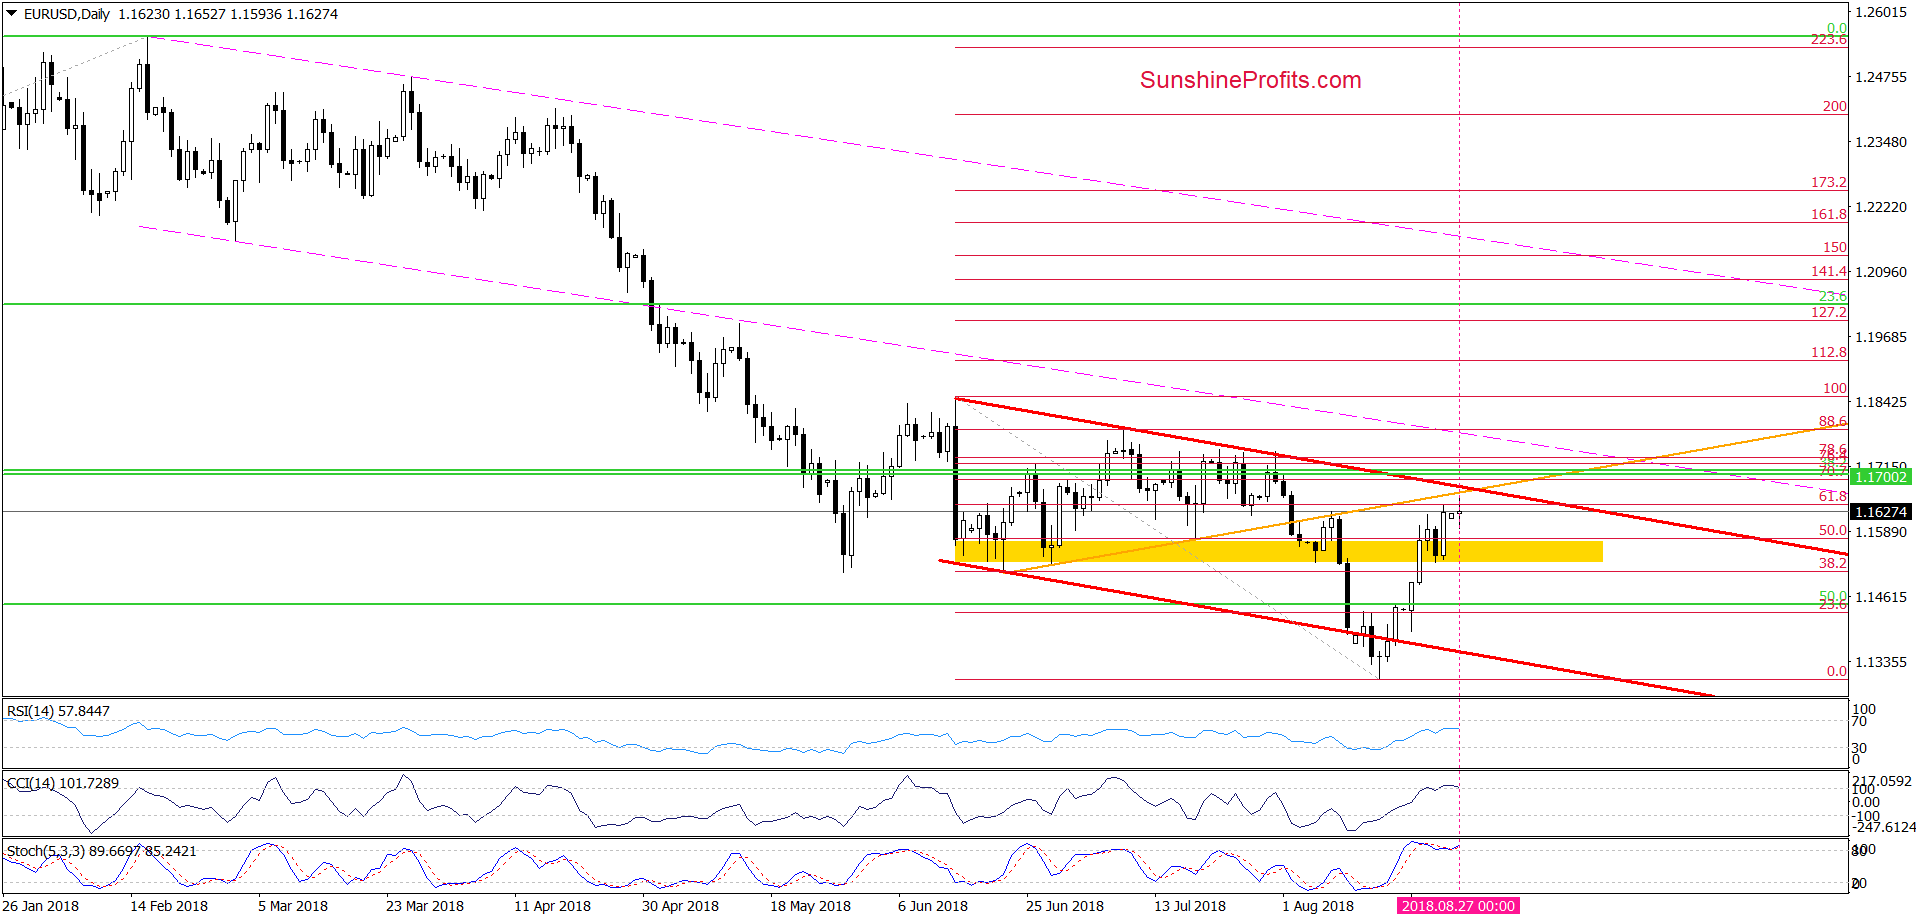
On Friday, we wrote the following:
(…) the yellow zone withstood the selling pressure and currency bulls triggered another upswing earlier today. Taking this fact into account, we continue to believe that further improvement and a test of the 61.8% Fibonacci retracement, the previously-broken orange line of even the upper border of the red declining trend channel (we marked this area with the blue ellipse) is very likely in the following days.
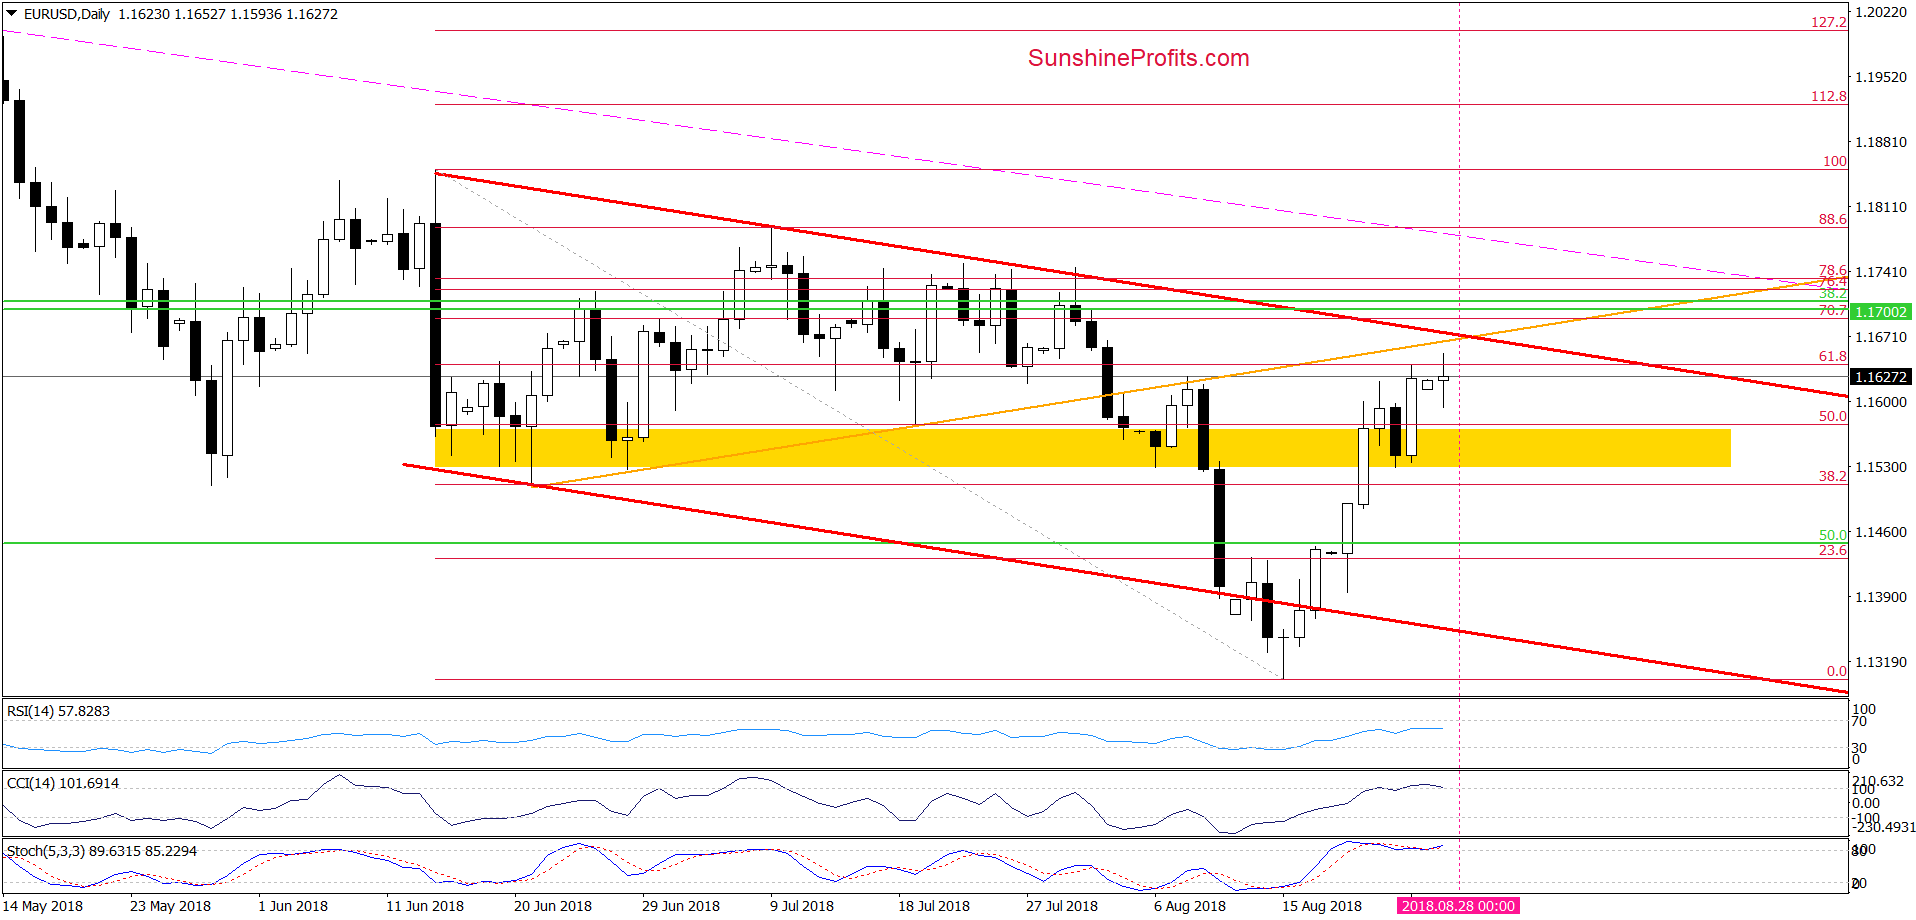
(…) this scenario is also reinforced by the current situation in the USD Index about which we wrote on Wednesday:
Focus on the USD Index
From today’s point of view, we see that the situation developed in tune with our assumptions and EUR/USD climbed to the first upside target - the 61.8% Fibonacci retracement. What’s interesting, the Stochastic Oscillator invalidated the earlier sell signal and generated an opposite signal, supporting currency bulls and increasing the likelihood of another upswing to our next upside targets in the very near future.
Nevertheless, taking into account the proximity to the nearest resistances and the intersection of the upper and lower arms of the triangle, we think that reversal is just around the corner. Therefore, if we see reliable signs of the bulls’ weakness, we’ll consider going short in the following days.
Trading position (short-term; our opinion): Connecting the dots, no positions are justified from the risk/reward perspective. We will keep you informed should anything change, or should we see a confirmation/invalidation of the above.
USD/CAD
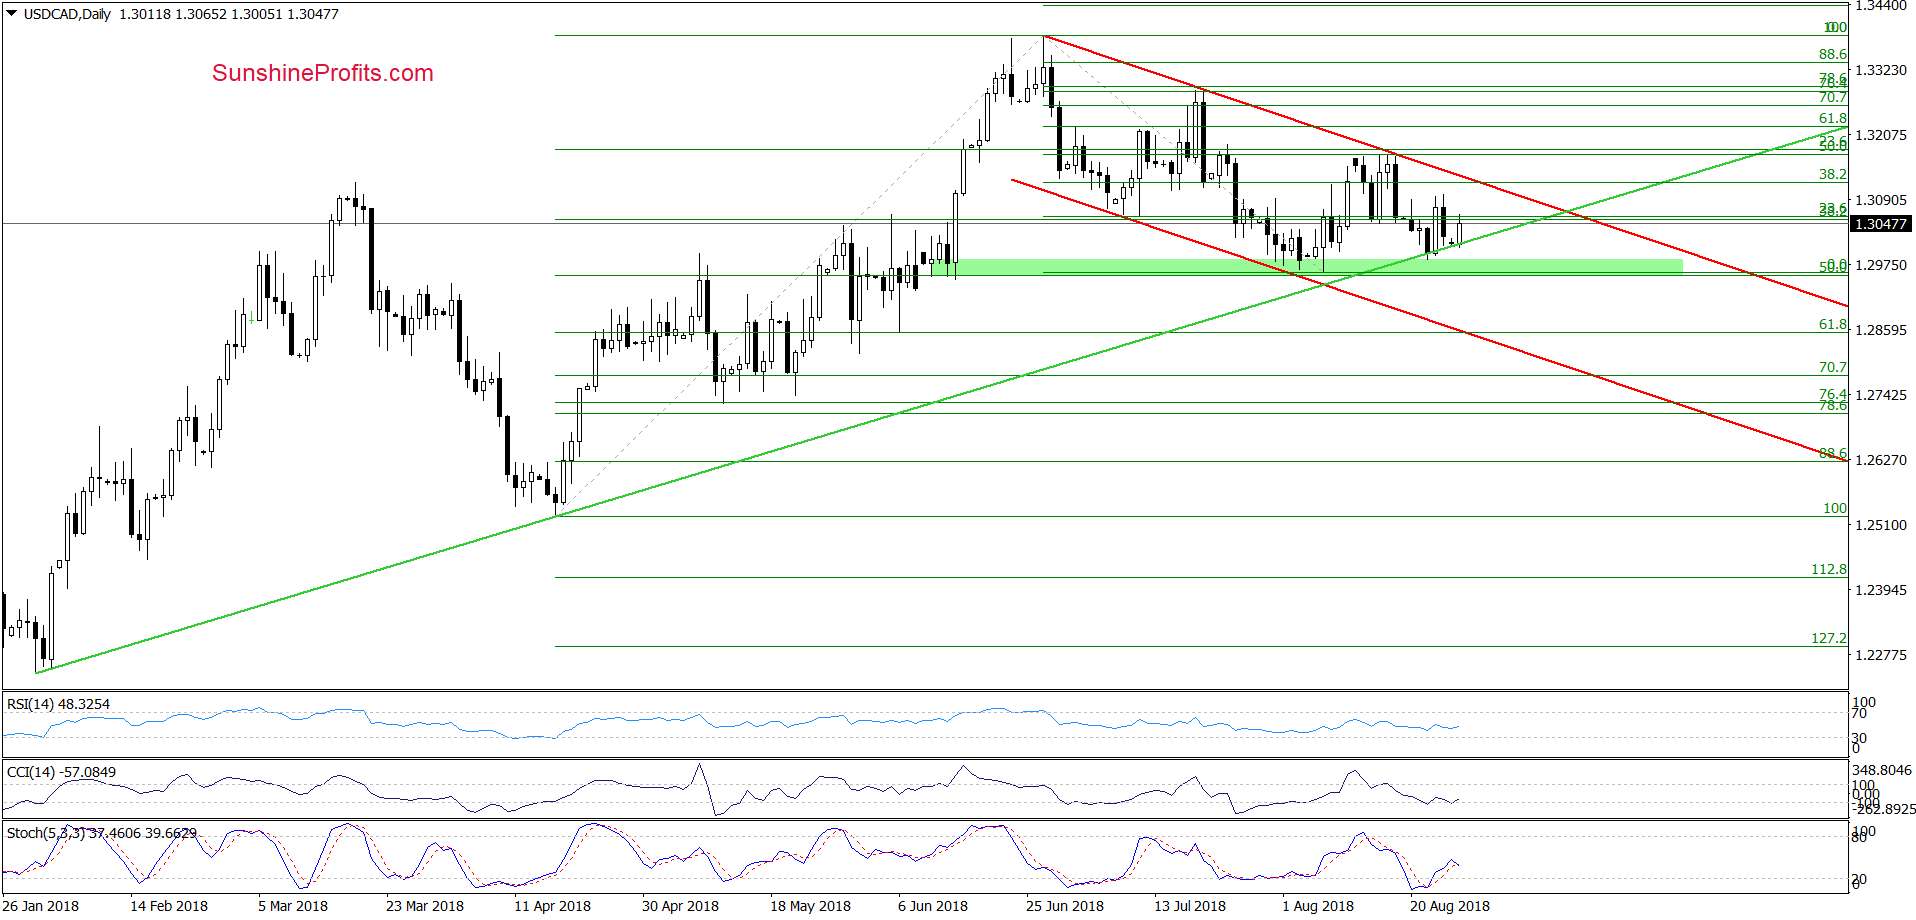
Looking at the daily chart, we see that although currency bears took USD/CAD lower earlier today, the medium-term green support line withstood the selling pressure, triggering another rebound (similarly to what we saw on Thursday).
Taking this fact into account, we think that as long as there is no breakdown under this important support, a bigger move to the downside is not likely to be seen and a test of the upper border of the red declining trend channel should not surprise us in the very near future. Therefore, if USD/CAD mange to break above this major very short-term resistance, we’ll consider opening long positions.
Trading position (short-term; our opinion): No positions are justified from the risk/reward perspective. We will keep you informed should anything change, or should we see a confirmation/invalidation of the above.
USD/CHF
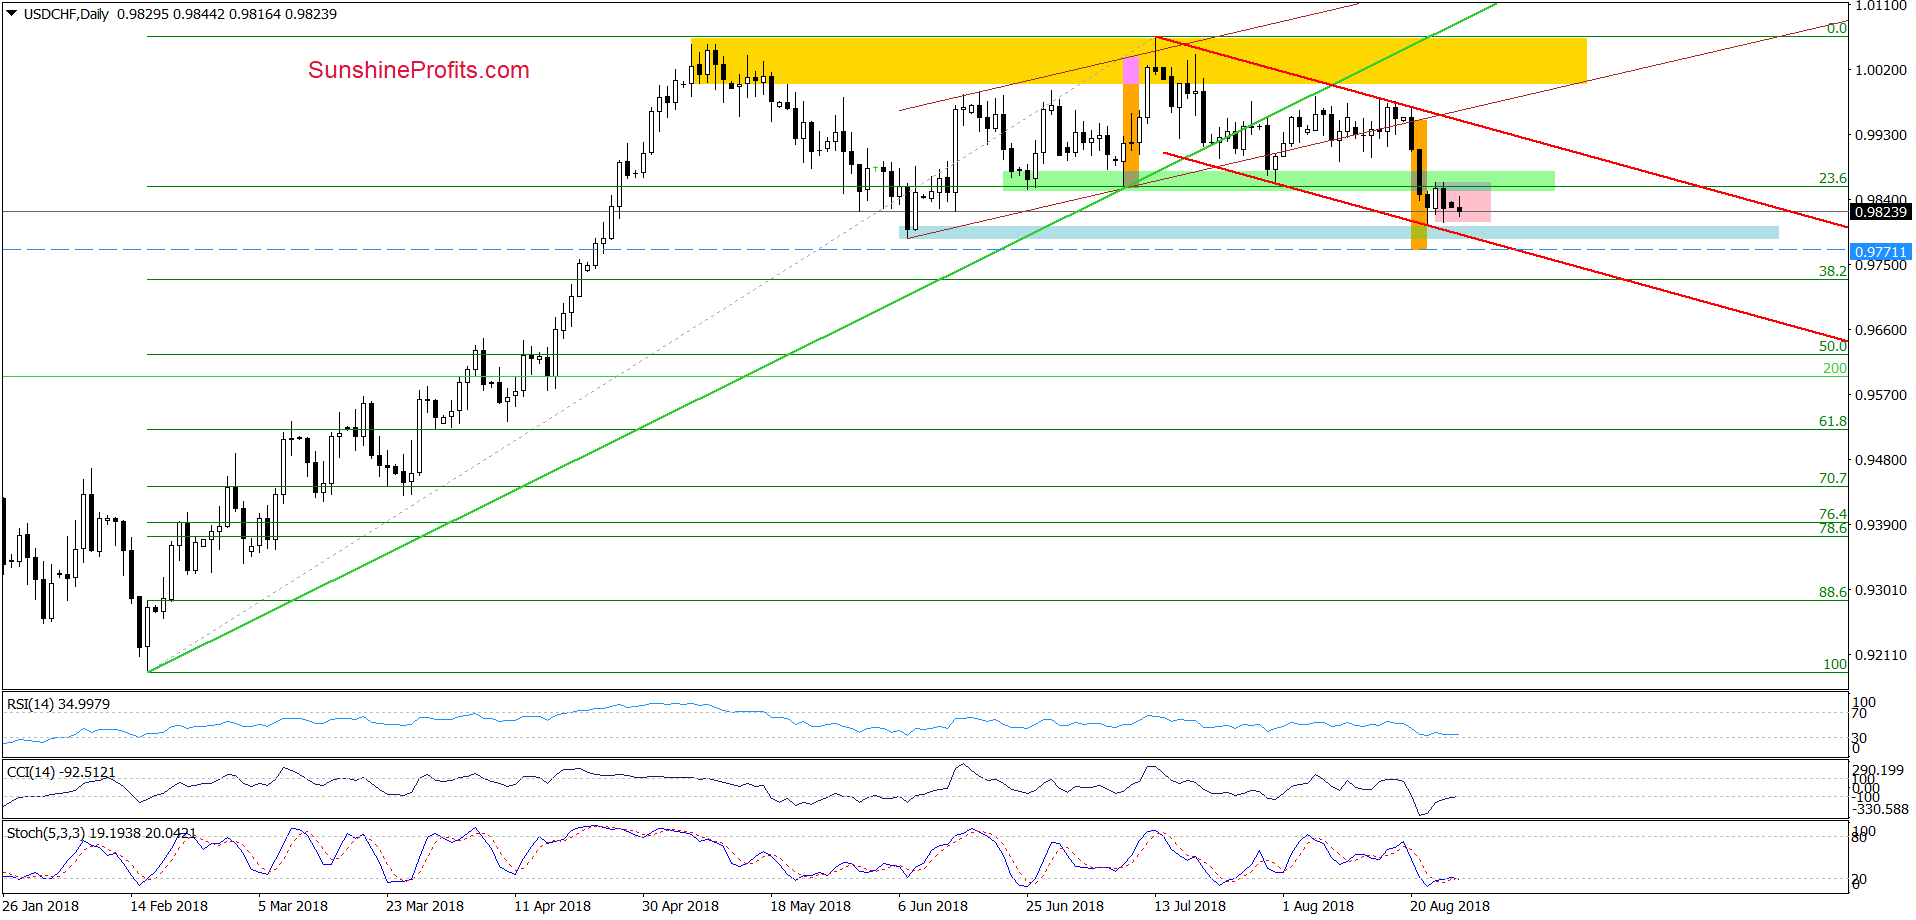
On the daily cart, we see that the overall situation hasn’t changed much since Thursday, because USD/CHF is still trading inside the pink consolidation between the previously-broken green support zone (created by the 23.6% Fibonacci retracement and previous lows) and the blue support zone based on June lows.
Taking this fact into account, we believe that our last commentary on this currency pair is up-to-date also today:
(…) the pair slipped to the lower border of the red declining trend channel and reached the blue support area based on June lows, which encouraged currency bulls to fight.
Nevertheless, although the exchange rate bounced off these levels yesterday and extended the rebound earlier today, the previously-broken green zone (which serves as the nearest resistance now) stopped the buyers in recent hours, triggering a pullback.
Such price action looks like a verification of the Monday’s breakdown, which in combination with a lack of buy signals generated by the daily indicators suggests that one more downswing is just around the corner – especially when we factor in the current situation in EUR/UAS and the USD Index.
So, how low could the pair go?
In our opinion, if USD/CHF extends losses, we’ll see a re-test of the above-mentioned lower border of the red declining trend channel, which intersects the blue support area based on June lows.
Finishing today’s commentary on this currency pair it is worth mentioning that slightly below these levels (0.9771) the size of the downward move will correspond to the height of the brown rising trend channel, which will likely also decrease the selling pressure in the coming days.
Trading position (short-term; our opinion): No positions are justified from the risk/reward perspective. We will keep you informed should anything change, or should we see a confirmation/invalidation of the above.
Thank you.
Nadia Simmons
Forex & Oil Trading Strategist
Przemyslaw Radomski, CFA
Founder, Editor-in-chief, Gold & Silver Fund Manager
Gold & Silver Trading Alerts
Forex Trading Alerts
Oil Investment Updates
Oil Trading Alerts

